
Why did OpenTelemetry Ditch Black-box Tests?


Discover how trace-based testing techniques helped the OpenTelemetry (OTel) Demo increase reliability and confidence in releases.
Table of Contents
Black-box testing has long been the recommended technique for testing back-end architectures. This tendency to rely on them has continued even as major architectural and technology shifts have occurred.
What are those shifts?
- Monolith to distributed, microservice-based systems
- Logs to distributed logging to distributed tracing
- Synchronous, blocking based APIs to asynchronous handling of requests
- Database centric design to message based architectures
## Are black-box tests still adequate?
No.
Why?
This summer, the [OpenTelemetry (OTel) Demo](https://github.com/open-telemetry/opentelemetry-demo) (see below) experienced growing pains due to the rapid pace of merged PRs by numerous contributors. This resulted in releases with broken features and lower than desired quality. It was occurring in spite of test coverage with a suite of black box tests having been in place for quite some time.
This article will look at how trace-based testing techniques, which in turn rely on modern observability techniques, were used to increase the reliability and confidence in releases. The lessons learned can also help you.
## OpenTelemetry CNCF Project (OTel)
The [OpenTelemetry Project](https://opentelemetry.io/), commonly referred to as OTel for short, was formed in 2019 when [OpenCensus and OpenTracing merged](https://tracetest.io/blog/tracing-the-history-of-distributed-tracing-opentelemetry). The goal was to provide one unified standard to collect observability data. Before this standard, developers implementing observability were forced to choose a particular vendor's application performance monitoring (APM) solution and instrument their application with vendor specific tooling. This led to vendor lock-in.
From the observability vendor perspective, maintaining instrumentation across the wide spectrum of languages and technologies was a daunting task, even for the larger vendors. By moving to an open standard with OTel, developers have a standard way to instrument their code and vendors can focus on how to visualize and analyze the data.
OpenTelemetry focuses on 3 major observability signals:
- Logs
- Metrics
- Distributed Traces
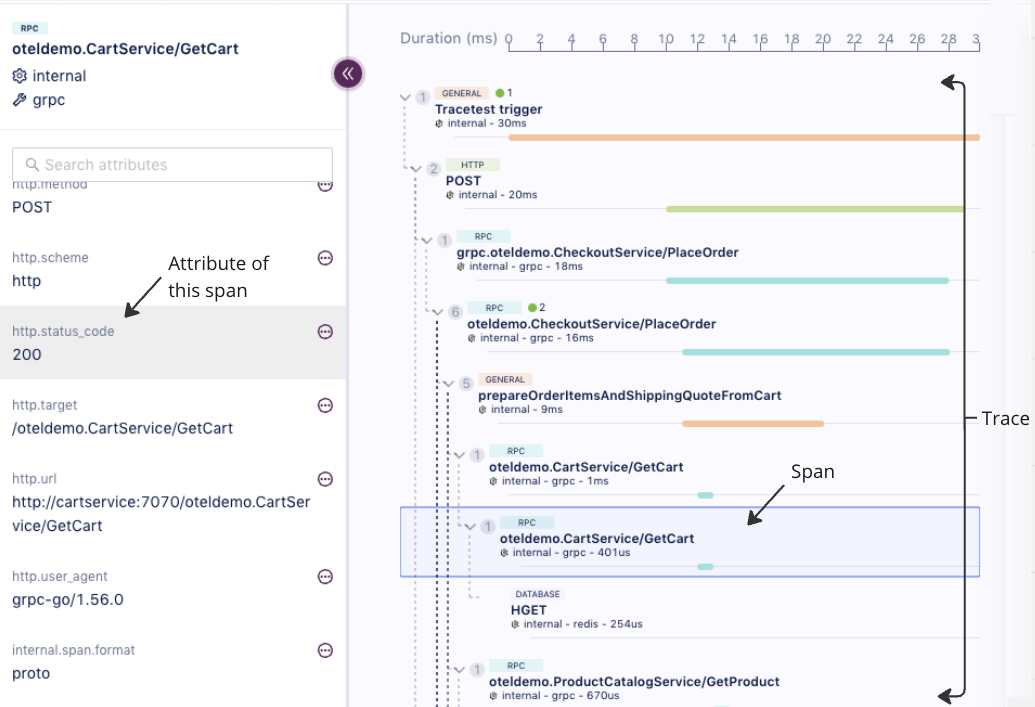
Of these, distributed tracing is considered the most valuable and was the starting point for the [OpenTelemetry Project](https://opentelemetry.io/docs/what-is-opentelemetry/). A distributed trace records the paths taken by requests as they propagate through multi-service architectures, showing you both call order, timing, and containing the details of each step.
A distributed trace has four components:
1. the trace
2. spans representing each step
3. attributes associated to each span
4. events associated to each span
Below is a typical trace:
## OpenTelemetry Demo Microservice App
In April of 2021, the OpenTelemetry Project decided to create a demo application to showcase how to instrument a heterogeneous distributed application. You can install and run the OpenTelemetry Demo in Docker [with these commands](https://docs.tracetest.io/live-examples/opentelemetry-store/overview/#get-and-run-the-demo):
```bash
git clone https://github.com/open-telemetry/opentelemetry-demo.git
cd opentelemetry-demo/
docker compose up --no-build
```
*__💡 Note: If you're running on Apple Silicon, run `docker compose build` in order to create local images vs. pulling them from the repository.__*
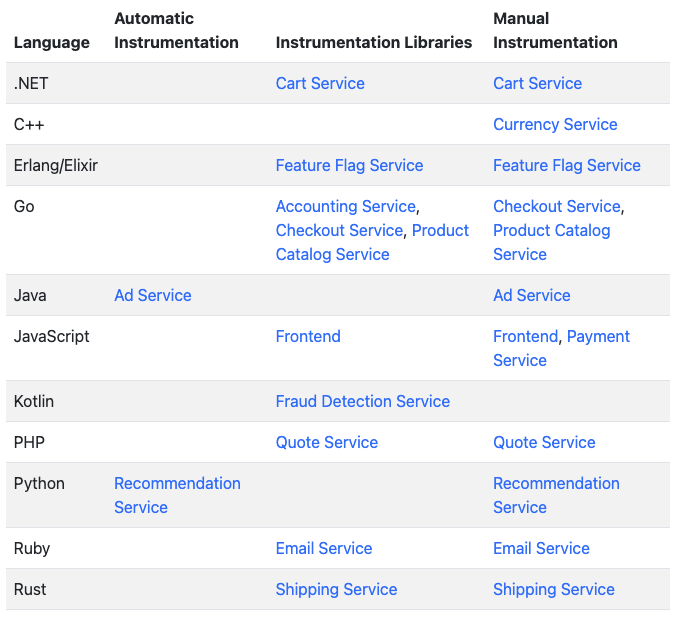
The application, in keeping with the observability theme of the OTel project, is an Astronomy Store Front. This application has evolved to have [11 different languages and 12 major services](https://opentelemetry.io/docs/demo/#language-feature-reference), and it demonstrates both automatic and manual instrumentation:
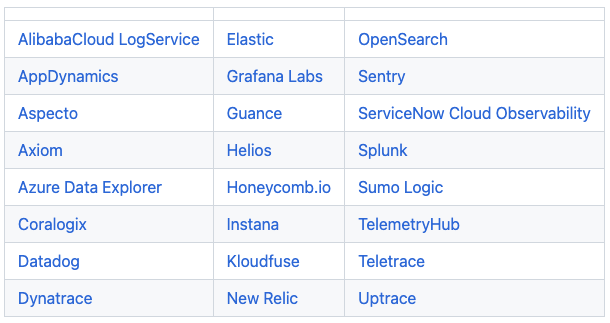
The application is used by developers beginning to learn observability, enterprises adopting OTel that want to be able to examine a working application, and by vendors that want to demonstrate their observability related product working with a complex application. The [list of companies](https://github.com/open-telemetry/opentelemetry-demo#demos-featuring-the-astronomy-shop) that work with and rely on the demo is extensive:
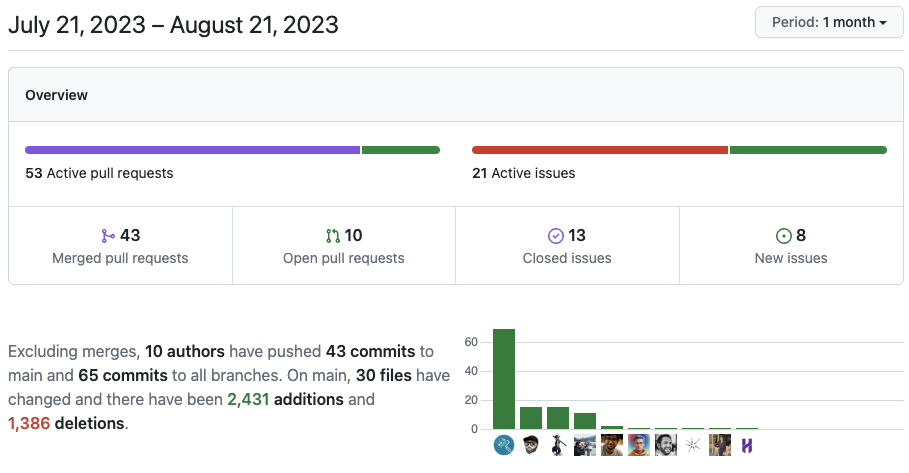
The project is quite popular, with over 1K stars on [GitHub](https://github.com/open-telemetry/opentelemetry-demo) and over 500 forks. It has had 86 unique contributors, and the pace of change is rapid. In just the past month, 10 different open source contributors have merged 43 PRs into the repo. These developers work for different companies, are located all over the world, and are submitting changes to different areas of the application.
Let’s add all of this up:
- 11 different languages
- 12 major services
- Both automatic and manual instrumentation
- 10 different developers around the globe merging 43 PRs in the last month
- Numerous technologies including Kafka, Redis, Postgres, gRPC, HTTP
This is considerable complexity, but not unlike most modern development environments which often have teams located in multiple areas, utilizing several development languages, a wide selection of technologies, and are committing code rapidly across numerous services. With this complexity, the risk of introducing errors when releasing is high.
What technique is widely used to reduce risk and increase confidence when releasing code
Tests!
## Existing OpenTelemetry Demo Tests
The OpenTelemetry Demo has had [test coverage](https://opentelemetry.io/docs/demo/tests/) for quite some time. The front end is covered with tests created in Cypress which were written when the front end was migrated to NextJS in August of 2022. These tests can be run with the following command:
```bash
docker compose run frontendTests
```
The back end was covered by black box tests against the gRPC endpoints that were written in AVA, a popular Node.js-based testing framework. They were added in July of 2022 with coverage across 9 of the services. These are straightforward black box tests, exercising a gRPC endpoint and verifying that the returned results were valid. Here is one of the AVA tests that verifies the checkout service, making sure the response to the call returns the proper data:
```jsx
const checkoutClient = new oteldemo.CheckoutService(
CHECKOUT_SERVICE_ADDR,
grpc.credentials.createInsecure()
);
checkoutOrder = promisify(checkoutClient.placeOrder).bind(checkoutClient);
// --------------- Checkout Service ---------------
test("checkout: place order", async (t) => {
const req = data.checkout;
const res = await checkoutOrder(req);
t.truthy(res.order.orderId);
t.truthy(res.order.shippingTrackingId);
t.truthy(res.order.shippingAddress);
t.is(res.order.shippingCost.currencyCode, "USD");
});
```
These existing AVA tests can be run with the following command:
```bash
docker compose run integrationTests
```
Front-end tests, back-end black box tests. **The world is great, and there are no problems!**
## Trouble in Testing the Distributed Application
Except there were problems. Changes were breaking the demo, resulting in many issues utilizing the demo application for both new and established users. The issue was highlighted in a thread in the [otel-community-demo](https://cloud-native.slack.com/archives/C03B4CWV4DA) channel of the [CNCF Slack](http://cloud-native.slack.com/) posted in May of 2023. This thread was started by one of the lead contributors to the repo:
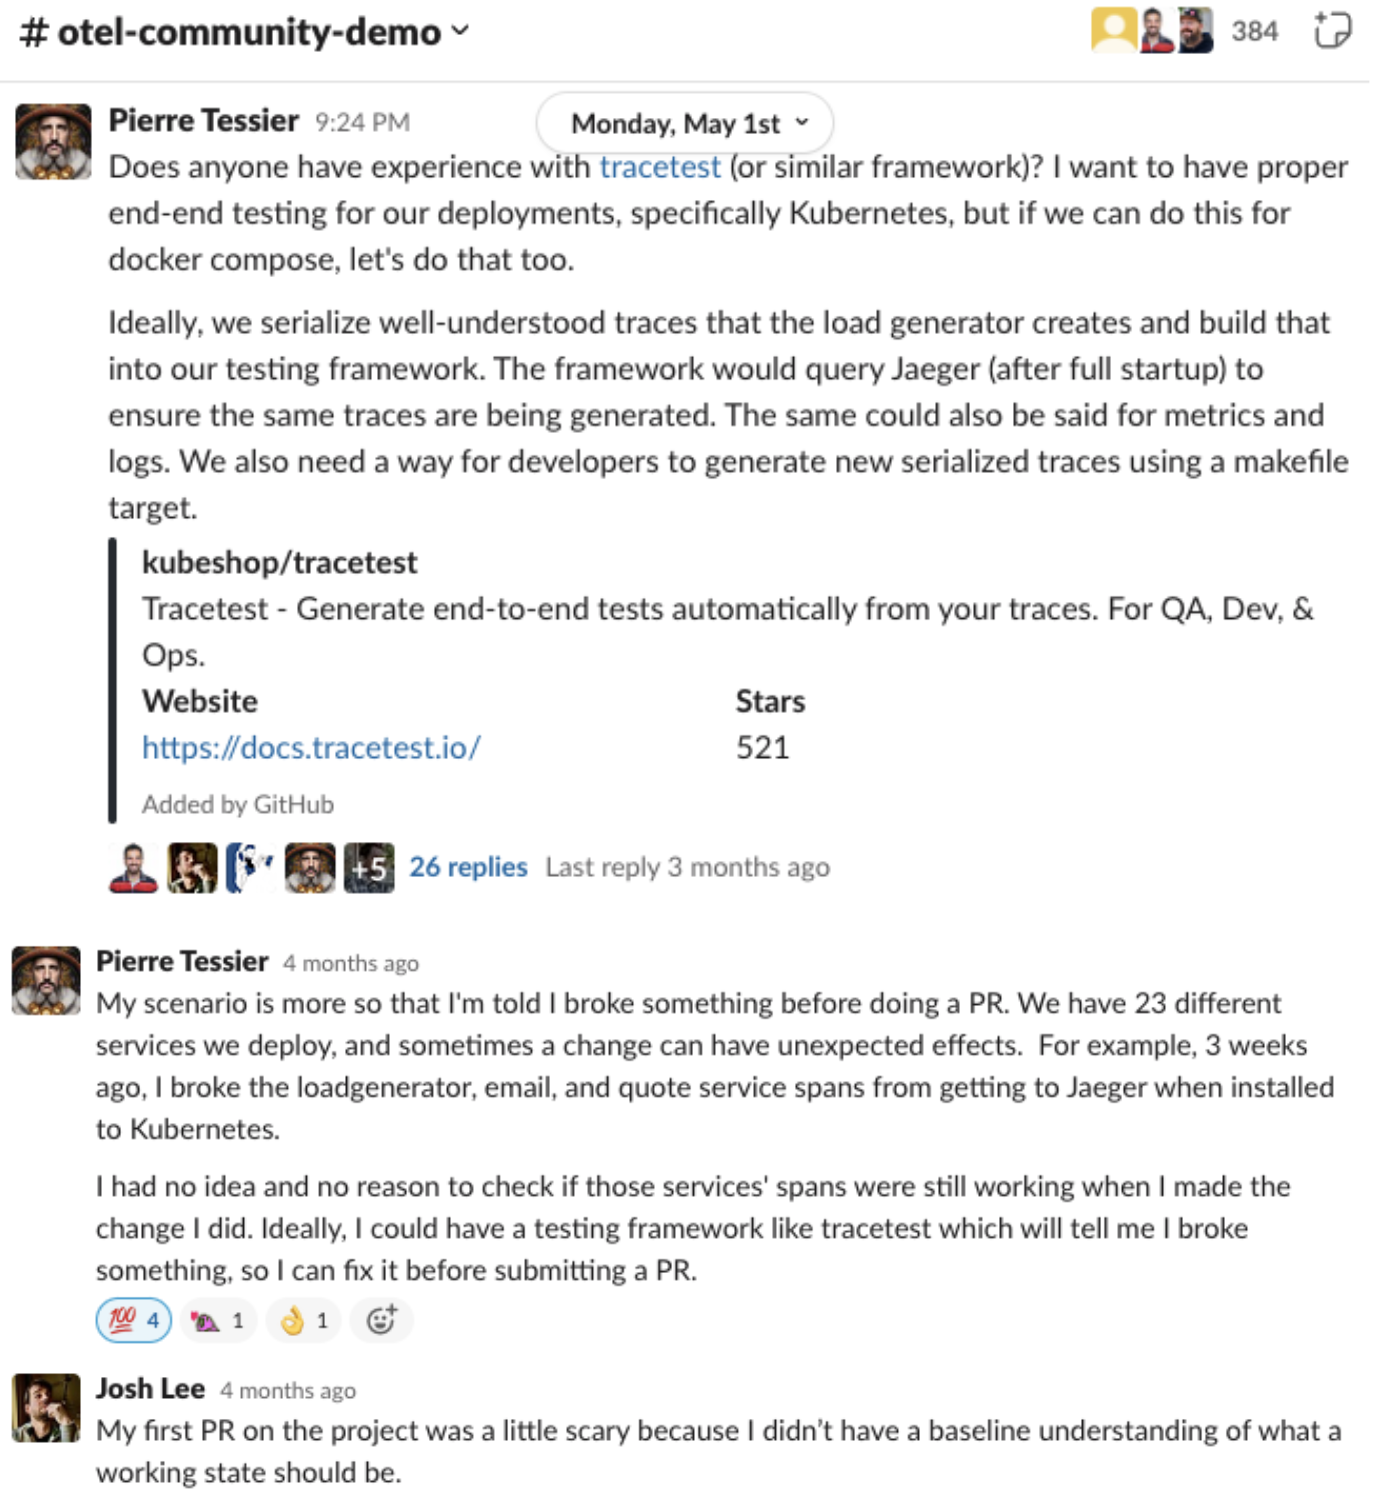
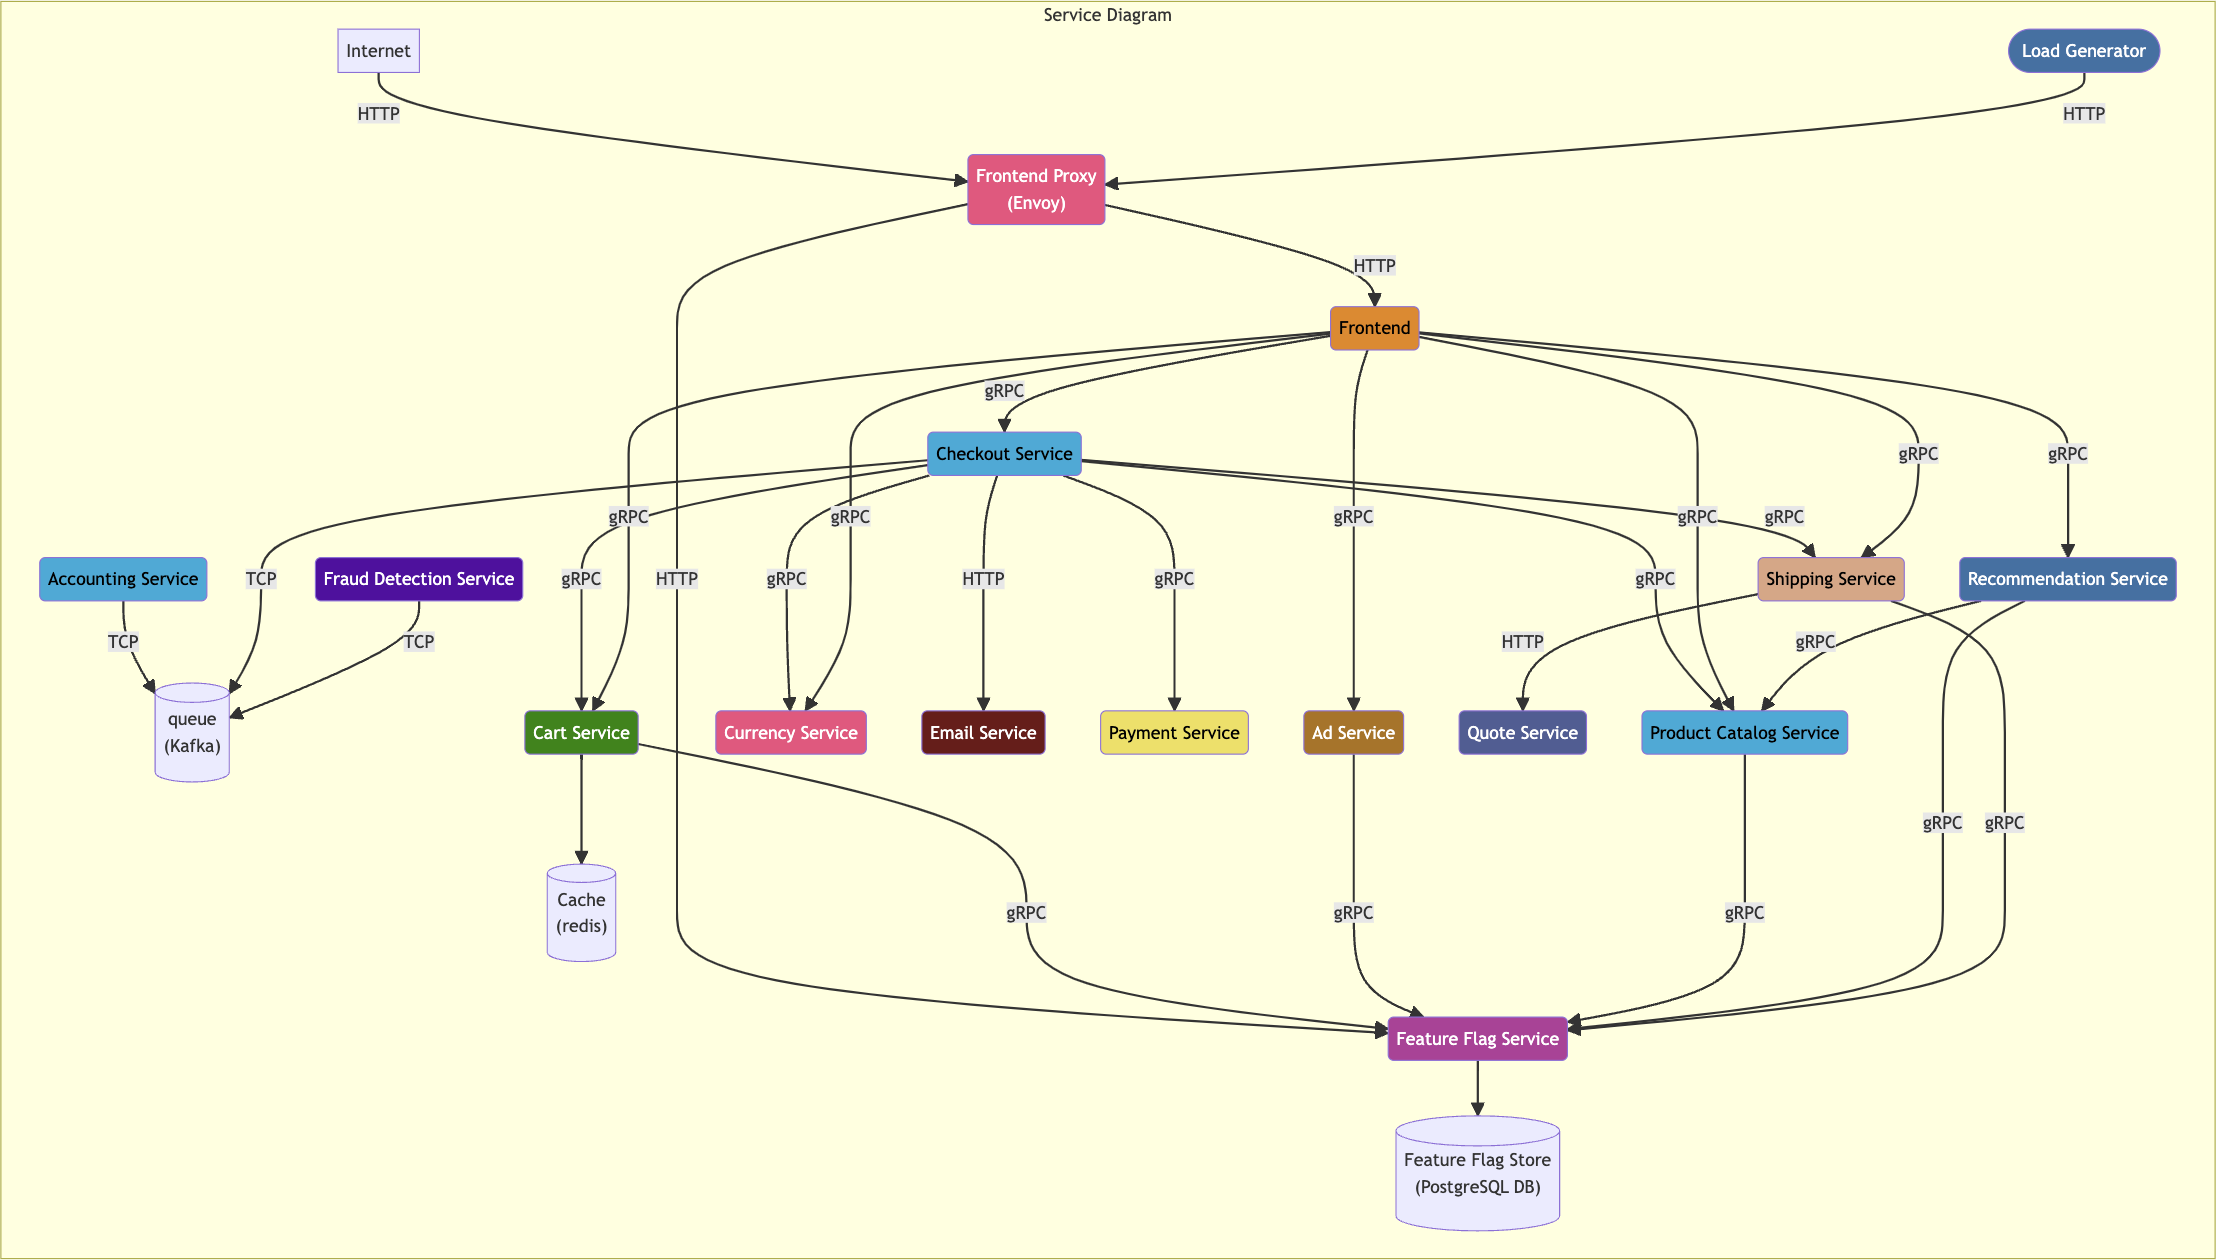
There was enough complexity in the Demo application that unintended consequences were occurring, reducing confidence when deploying changes or adding new features. Looking at how the [architecture of the application](https://opentelemetry.io/docs/demo/architecture/) had grown and the number of services involved, this is understandable:
What was needed was true end-to-end tests that could verify not only the response data from gRPC calls to the application, but could also verify that the entire application was working properly at a deeper level. Enter trace-based testing and Tracetest.
## Trace-based Testing
Traditionally, creating end-to-end tests that go past simple black box testing require instrumenting your application so you have visibility to deeper interactions throughout the system. When looking at these types of tests, typically 90% of the code enables visibility across the various services and technologies, while only 10% of the code in the test actually defines the triggering action or assertions.
Trace-based testing is a technique that uses the instrumentation you have already enabled by making your code observable and allowing assertions to be created against data contained in it. It leverages the work your development team has already invested in instrumenting your application for observability. In doing so, trace-based testing dramatically reduces the effort and time involved in creating end-to-end tests.
## Tracetest
[Tracetest](https://tracetest.io/) is an [open-source tool](https://github.com/kubeshop/tracetest) which enables trace-based testing. Read more about [Tracetest’s launch, here](https://tracetest.io/blog/introducing-tracetest-trace-based-testing-with-opentelemetry).
Tests can be created in both the web-based user interface and via a code editor in a YAML format. Tracetest works with any [OTel compatible vendor or open source solution](https://tracetest.io/integrations), including Jaeger, Grafana Tempo, Dynatrace, Datadog, NewRelic, etc. The Tracetest server can be installed in Docker or Kubernetes, and you will also be able to use it without a server via the upcoming cloud version.
The Tracetest team had previously contributed to the OpenTelemetry Community Demo in July of 2022 by [porting the Go-based front end to Next.js](https://github.com/open-telemetry/opentelemetry-demo/pull/236), so was familiar with contributing to the project and happy to help the community by adding a complete suite of true end-to-end tests against the back-end services.
## Trace-based Testing Suite
The new tests were created in early July on a service by service basis and can be viewed in the [OpenTelemetry Demo repo, here](https://github.com/open-telemetry/opentelemetry-demo/tree/main/test/tracetesting). You can run the tests with the following command:
```bash
docker compose run traceBasedTests
```
For this article, we are going to look at the [frontend-service tests](https://github.com/open-telemetry/opentelemetry-demo/tree/main/test/tracetesting/frontend-service) which focus on the checkout process. These tests are run as a test suite, and go all the way from checking the recommendation service to adding a product to a cart and then checking out.
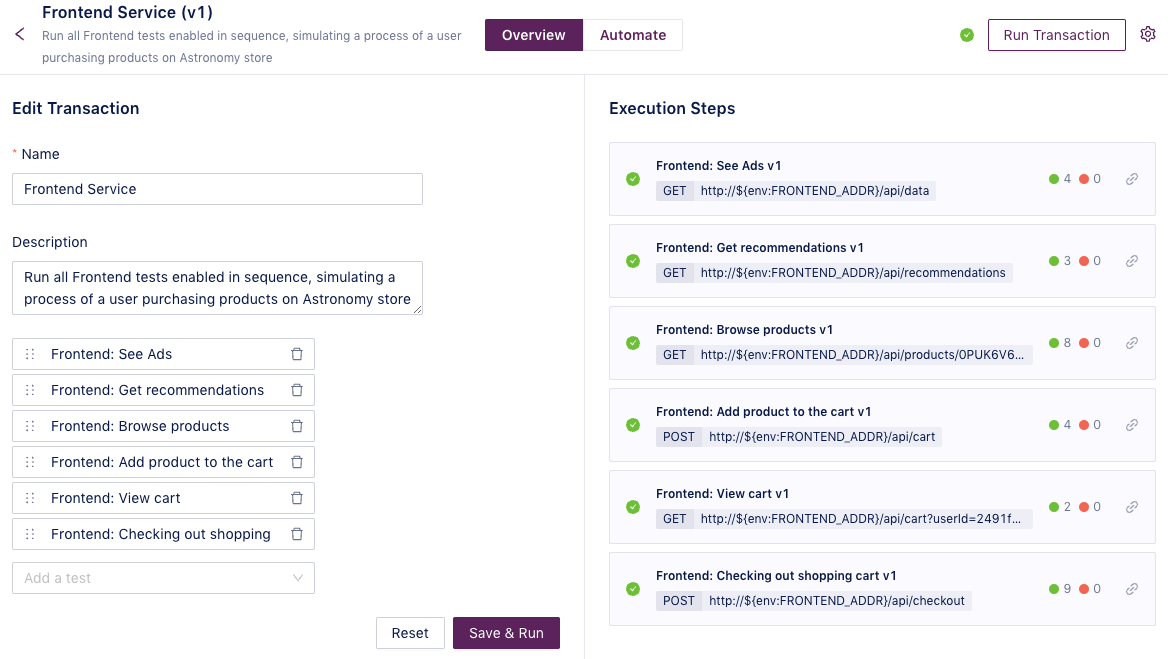
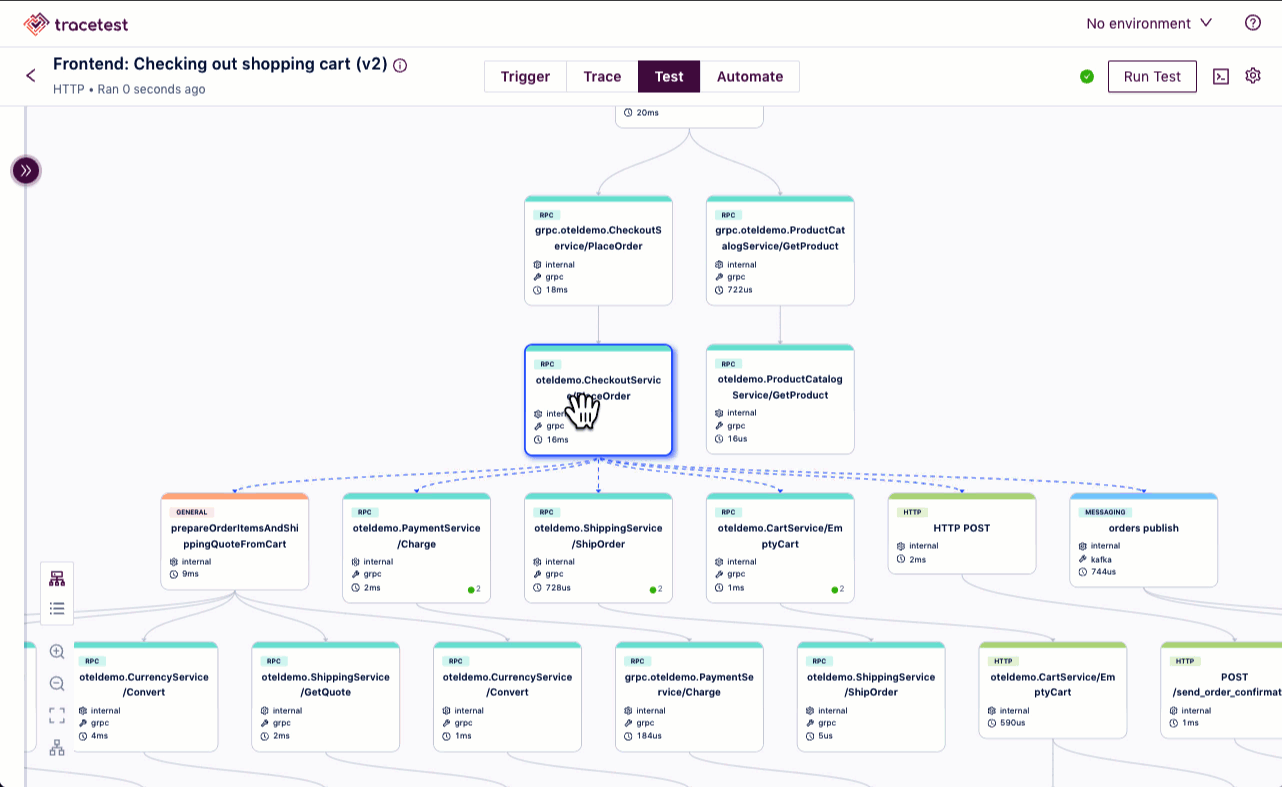
Looking at the last test, *“Frontend: Checking out shopping cart”*, we can see the structure of a Tracetest test. It is divided into two parts, the trigger and the test specs. The trigger, shown below, defines how the trace-based test is initiated:
```yaml
type: Test
spec:
id: frontend-checkout-shopping-cart
name: 'Frontend: Checking out shopping cart'
description: Simulate user checking out shopping cart
trigger:
type: http
httpRequest:
url: http://${env:FRONTEND_ADDR}/api/checkout
method: POST
headers:
- key: Content-Type
value: application/json
body: |
{
"userId": "2491f868-88f1-4345-8836-d5d8511a9f83",
"email": "someone@example.com",
"address": {
"streetAddress": "1600 Amphitheatre Parkway",
"state": "CA",
"country": "United States",
"city": "Mountain View",
"zipCode": "94043"
},
"userCurrency": "USD",
"creditCard": {
"creditCardCvv": 672,
"creditCardExpirationMonth": 1,
"creditCardExpirationYear": 2030,
"creditCardNumber": "4432-8015-6152-0454"
}
}
```
As we can see from the code, this is an http-based trigger that hits the `/api/checkout` endpoint. The information needed for the POST is contained in the body section. Running this test will cause the trigger to fire, initiating a checkout process. Since the OpenTelemetry Demo produces a trace for any request, Tracetest can capture both the response of this POST and the distributed trace which the OpenTelemetry Demo app writes to Jaeger. It can then process these results using the test specs defined in the second part of this test:
```yaml
specs:
- selector: span[tracetest.span.type="general" name="Tracetest trigger"]
name: "It called the frontend with success"
assertions:
- attr:tracetest.response.status = 200
- selector: span[tracetest.span.type="rpc" name="oteldemo.CheckoutService/PlaceOrder" rpc.system="grpc" rpc.method="PlaceOrder" rpc.service="oteldemo.CheckoutService"]
name: "The order was placed"
assertions:
- attr:app.user.id = "2491f868-88f1-4345-8836-d5d8511a9f83"
- attr:app.order.items.count = 1
- selector: span[tracetest.span.type="rpc" name="oteldemo.PaymentService/Charge" rpc.system="grpc" rpc.method="Charge" rpc.service="oteldemo.PaymentService"]
name: "The user was charged"
assertions:
- attr:rpc.grpc.status_code = 0
- attr:tracetest.selected_spans.count >= 1
- selector: span[tracetest.span.type="rpc" name="oteldemo.ShippingService/ShipOrder" rpc.system="grpc" rpc.method="ShipOrder" rpc.service="oteldemo.ShippingService"]
name: "The product was shipped"
assertions:
- attr:rpc.grpc.status_code = 0
- attr:tracetest.selected_spans.count >= 1
- selector: span[tracetest.span.type="rpc" name="oteldemo.CartService/EmptyCart" rpc.system="grpc" rpc.method="EmptyCart" rpc.service="oteldemo.CartService"]
name: "The cart was emptied"
assertions:
- attr:rpc.grpc.status_code = 0
- attr:tracetest.selected_spans.count >= 1
```
These test specs define the assertions to run on specific parts of the data returned from the test. If we look at the first test spec, we can see that it, similar to a black box test, checks against the response data to make sure the HTTP POST returns a status code of 200:
```yaml
- selector: span[tracetest.span.type="general" name="Tracetest trigger"]
name: "It called the frontend with success"
assertions:
- attr:tracetest.response.status = 200
```
More interesting is the next test specification. It looks into the trace attributes being exposed by the PlaceOrder method to make sure that the item count being checked out is equal to 1:
```yaml
- selector: span[tracetest.span.type="rpc" name="oteldemo.CheckoutService/PlaceOrder" rpc.system="grpc" rpc.method="PlaceOrder" rpc.service="oteldemo.CheckoutService"]
name: "The order was placed"
assertions:
- attr:app.user.id = "2491f868-88f1-4345-8836-d5d8511a9f83"
- attr:app.order.items.count = 1
```
This test specification is created in the Tracetest Web UI by simply selecting the span of interest, in this case the CheckoutService/PlaceOrder span.
```css
span[tracetest.span.type="rpc" name="oteldemo.CheckoutService/PlaceOrder" rpc.system="grpc" rpc.method="PlaceOrder" rpc.service="oteldemo.CheckoutService"]
```
Then, selecting the attribute of interest, `attr:app.order.items.count`, and creating a test specification asserting that this value should equal `1`.
```css
attr:app.order.items.count = 1
```
You can then name the test specification.
*__💡 Have you followed along and installed the OpenTelemetry Demo in Docker and ran the Tracetest tests? If so, go to [http://localhost:11633/](http://localhost:11633/) to view the UI.__*
Building tests based on the visibility provided by distributed tracing instrumentation makes end-to-end tests quick and easy to build. This reduction in the time, energy, and expertise needed to build tests makes it possible to provide high quality coverage across the entire distributed application. Once you set these tests up to run either manually or via your CI/CD process with the Tracetest CLI, your developers will be able to deploy changes with confidence.
*__💡 Want to read more about how Trace-based Testing overcomes the limits of black box testing and see where it fits in the testing pyramid? Check out this [TheNewStack article](https://thenewstack.io/where-does-trace-based-testing-fit-in-the-testing-pyramid/)!__*
## Conclusions and Final Remarks
The OpenTelemetry Demo, like many modern applications, contains different languages, services, and numerous technologies. For these types of complex cloud-native architectures, we have seen that black box testing is insufficient. Fortunately, we have also provided a solution!
With trace-based testing with tools like Tracetest, that leverage existing observability instrumentation, you can enable deep end-to-end testing and reduce the risk of introducing errors when releasing code. It makes developing new features in microservice infrastructures easier and more secure. But, most important, it gives developers more confidence to deploy code with confidence.
## Bonus Challenge - Run the Tests Yourself!
Want to see the OpenTelemetry Demo and run Tracetest tests yourself? It takes only four commands to install and run the demo and tests in Docker. Check out the [one page instructions](https://docs.tracetest.io/live-examples/opentelemetry-store/overview) in the docs!
Want to learn more about the OpenTelemetry Community Demo? [Look at the official OpenTelemetry docs](https://opentelemetry.io/docs/demo/)!
Want to read more about the trace-based tests by the author of the tests, Daniel? See the [blog post on the OpenTelemetry blog](https://opentelemetry.io/blog/2023/testing-otel-demo/).
Have questions for the Tracetest team? Reach out to us on [Slack](https://dub.sh/tracetest-community)!
Want to check out the repo, add an issue with a desired feature, or give Tracetest a star? [Go to our GitHub](https://github.com/kubeshop/tracetest).
.jpg)
.avif)
.avif)