End-to-End Observability with Grafana LGTM Stack
.avif)

Jump in and learn the ins-and-outs of the Grafana LGTM stack and Tracetest to get end-to-end observability and testing.
Table of Contents
Ensuring your applications are running smoothly requires more than just monitoring. It demands comprehensive visibility into every aspect of your system, from logs and metrics to traces. This is where end-to-end observability comes into play. It's about connecting the dots between different parts of your system to get a complete picture of how everything is performing.
In this blog post, we'll dive into setting up end-to-end observability using Grafana and its associated tools, including OpenTelemetry, Prometheus, Loki, and Tempo. Let's break down each component and see how they fit together to provide a robust observability solution.
> [View the full sample code for the observability stack you'll build, here.](https://github.com/kubeshop/tracetest/tree/main/examples/lgtm-end-to-end-observability-testing)
## What is End-to-End Observability, And Why Do We Need It?
Before we dive into the setup, it's important to understand what end-to-end observability means and why it's essential. End-to-end observability provides a unified view of your entire system, including traces, metrics, and logs. It helps you monitor and debug your applications more effectively by correlating different types of data to understand the overall health of your system.
With Grafana playing a key role in visualizing and analyzing this data, we can bring everything together. Grafana's ability to integrate with multiple data sources allows us to correlate logs, metrics, and traces in one unified platform, making troubleshooting and maintaining your system easier. The architecture diagram below gives a clear view of how these components fit together to provide end-to-end observability.
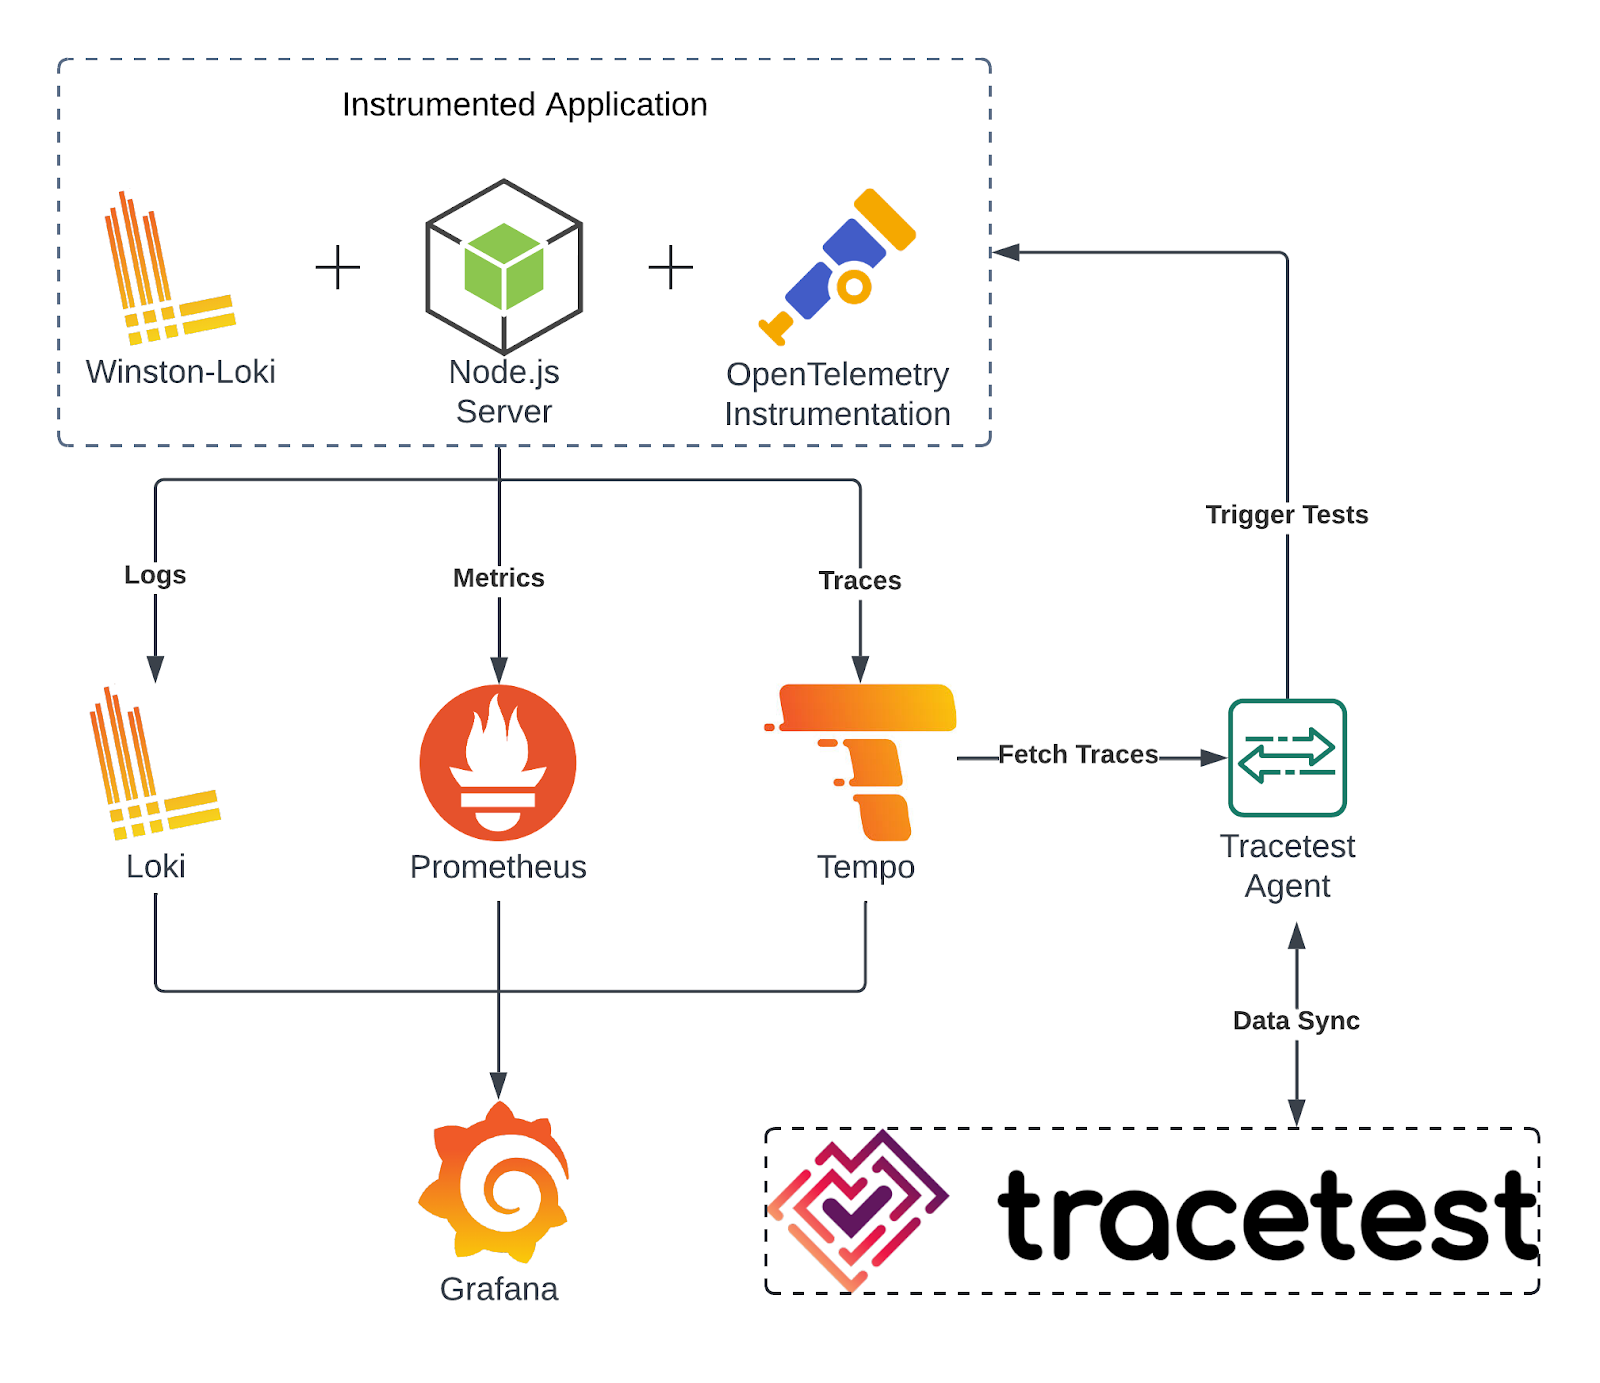
Here's what is happening:
1. The application is instrumented using OpenTelemetry for metrics and traces and Winston-Loki for logging.
2. The application sends logs to Loki, metrics to Prometheus, and trace data to Tempo.
3. Tempo forwards traces to the Tracetest Agent.
4. Grafana is used to visualize the logs (from Loki), metrics (from Prometheus), and traces (from Tempo), providing a unified observability dashboard.
5. Finally, the Tracetest Agent syncs the data to the Tracetest UI for trace-based testing.
But how do we get all this data into Grafana? The first step is to instrument your application. This means directly embedding tracing, logging, and metrics functionality into your code. By doing this, you'll generate the metrics required to monitor the system and identify any performance bottlenecks or issues.
## 1. Setting Up Instrumentation in Your Application
The first step in setting up end-to-end observability is to instrument your application. This involves adding tracing, logging, and metrics SDKs or libraries to your application code.
For this tutorial, you'll set up a simple [Express server](http://expressjs.com/en/starter/hello-world.html) in your root directory in **index.js**.
```js
const express = require('express')
const app = express()
const port = 8081
app.get('/', (req, res) => {
res.send('Hello World!')
})
app.listen(port, () => {
console.log(`Example app listening on port ${port}`)
})
```
This is a basic web application; while it doesn't include observability yet, let's imagine this is your real-world app or service that you've built.
### 1. Adding Metrics to Your Application
Metrics gives you insights into the behavior and performance of your application by tracking things like response times, error rates, or even custom-defined metrics like the number of requests handled.
In observability, metrics help identify trends or issues in real-time, allowing you to react quickly to problems. For this, we'll use OpenTelemetry, a popular open-source observability framework, to instrument our application for collecting metrics.
To start collecting metrics, create a new file, **meter.js**, which will handle generating and exporting the metrics to Prometheus, a time-series database commonly used for metrics storage and querying.
```js
// meter.js
const { MeterProvider } = require('@opentelemetry/sdk-metrics');
const { PrometheusExporter } = require('@opentelemetry/exporter-prometheus');
const { Resource } = require('@opentelemetry/resources');
const { SemanticResourceAttributes } = require('@opentelemetry/semantic-conventions');
const prometheusExporter = new PrometheusExporter({
port: 9464,
endpoint: '/metrics',
}, () => {
console.log('Prometheus scrape endpoint: http://localhost:9464/metrics');
});
const meterProvider = new MeterProvider({
resource: new Resource({
[SemanticResourceAttributes.SERVICE_NAME]: 'hello-world-app',
}),
});
meterProvider.addMetricReader(prometheusExporter);
const meter = meterProvider.getMeter('hello-world-meter');
module.exports = meter;
```
By adding this **meter.js** file to our application, we're setting the groundwork to collect and export metrics. Prometheus will now be able to scrape these metrics and store them for visualization and alerting later in Grafana.
### 2. Adding Logging to Your Application
Logs are a key component of observability, providing real-time information about the events happening inside your application. They help you trace errors, track user activity, and understand the execution flow. By centralizing your logs, you can more easily search, filter, and correlate them with other observability data like metrics and traces.
To manage logs, you'll use Winston, a popular logging library for Node.js, along with the Winston-Loki transport, which sends logs directly to a Loki server. Loki is a log aggregation system designed to work alongside tools like Prometheus, providing a scalable way to collect and query logs.
Create a **logger.js** file to handle logging and send the logs to a Loki server.
```js
// logger.js
const winston = require('winston');
const LokiTransport = require('winston-loki');
const logger = winston.createLogger({
level: 'info',
format: winston.format.json(),
transports: [
new LokiTransport({
host: 'http://loki:3100', // Loki URL
labels: { job: 'loki-service' },
json: true,
batching: true,
interval: 5,
}),
],
});
module.exports = logger;
```
Now, import the meter and logger in index.js to add logs and metrics to the application.
```js
const express = require('express');
const logger = require('./logger');
const meter = require('./meter');
const app = express();
// Define a custom metric (e.g., a request counter)
const requestCounter = meter.createCounter('http_requests', {
description: 'Counts HTTP requests',
});
// Middleware to increment the counter on every request and log the visited URL
app.use((req, res, next) => {
logger.info(`Received request for ${req.url}`);
requestCounter.add(1, { method: req.method, route: req.path });
next();
});
app.get('/', (req, res) => {
// Simulate some work
setTimeout(() => {
res.send('Hello, World!');
}, 100);
});
// Start the server
app.listen(8081, () => {
logger.info('Server is running on http://localhost:8081');
});
```
### 3. Adding Traces to Your Application
Traces are a critical part of understanding how requests flow through your application. They give you the ability to track requests from the moment they enter the system to when they leave, allowing you to see:
- The services that were called.
- The time it took for each of the services.
- The places where bottlenecks may be occurring.
This is especially important for debugging performance issues and understanding distributed systems.
To create and collect these traces, we'll use the OpenTelemetry SDK along with auto-instrumentation, which automatically instruments Node.js modules to start generating traces without you having to manually add trace code everywhere.
Create a file called **tracer.js** to set up OpenTelemetry in your application.
```js
// tracer.js
const opentelemetry = require('@opentelemetry/sdk-node')
const { getNodeAutoInstrumentations } = require('@opentelemetry/auto-instrumentations-node')
const { OTLPTraceExporter } = require('@opentelemetry/exporter-trace-otlp-http')
const { ConsoleSpanExporter } = require('@opentelemetry/sdk-trace-node');
const dotenv = require("dotenv")
dotenv.config()
const sdk = new opentelemetry.NodeSDK({
traceExporter: new OTLPTraceExporter({ url: process.env.OTEL_EXPORTER_OTLP_TRACES_ENDPOINT
}),
instrumentations: [getNodeAutoInstrumentations()],
})
sdk.start()
```
And a **.env** file to load the `OTEL_EXPORTER_OTLP_TRACES_ENDPOINT` environment variable.
```bash
OTEL_EXPORTER_OTLP_TRACES_ENDPOINT="http://tempo:4318/v1/traces"
```
Once this code is in place, and `tracer.js` is preloaded when running your index.js, every request to your Node.js app will automatically generate traces, thanks to OpenTelemetry's auto-instrumentation. These traces are collected and sent to an OTLP-compatible backend, which is Tempo in this case.
### 4. Containerize the Application
To run your application in a container, create a **Dockerfile** in your root directory:
```docker
FROM node:slim
WORKDIR /usr/src/app/
COPY package*.json ./
RUN npm install
COPY . .
EXPOSE 8081
```
Build the image of your application with the command `docker build -t <dockerhub-username>/tracetest-app .` in the root directory and push it to DockerHub with `docker push <dockerhub-username>/tracetest-app`
Also, add a new script in your **package.json** to automatically require **tracer.js** when running the server.
```json
"scripts": {
"index-with-tracer": "node -r ./tracer.js index.js"
},
```
Now create a **docker-compose.yml** and add the the code below to run the application in the container.
```yml
services:
app:
image: <your-dockerhub-uername>/tracetest-app
build: .
command: npm run index-with-tracer
ports:
- "8081:8081"
environment:
- OTEL_EXPORTER_OTLP_TRACES_ENDPOINT=${OTEL_EXPORTER_OTLP_TRACES_ENDPOINT}
depends_on:
tempo:
condition: service_started
tracetest-agent:
condition: service_started
```
And with that, you have successfully instrumented and containerized your application. Let's focus on setting up the Prometheus, Loki, and Tempo servers to collect all the data and visualize it in Grafana.
## 2. Setting up Prometheus for the Node.js Application
Prometheus is an open-source monitoring and alerting toolkit designed for reliability and scalability. It collects metrics from various sources, storing them in a time-series database, and providing a powerful query language (PromQL) for analysis.
In the context of observability, Prometheus is used to gather metrics from your applications and infrastructure, which can then be visualized and analyzed to gain insights into system performance and health.
To integrate Prometheus with your Node.js application, follow these steps:
### 1. Create the Prometheus Configuration File
The **prometheus.yml** file specifies how Prometheus should discover and scrape metrics from your application. Here's the configuration:
```yml
# prometheus.yml
global:
scrape_interval: 5s
scrape_configs:
- job_name: 'hello-world-app'
static_configs:
- targets: ['app:9464'] # Metrics exposed on port 9464
```
This defines the target endpoints where Prometheus will look for metrics. `host.docker.internal` refers to your local Docker host, and `9464` is the port on which your Node.js application exposes the metrics.
### 2. Run Prometheus in a Docker Container
To run the Prometheus server in a container, add the below service in your **docker-compose.yml**.
```yml
prometheus:
image: prom/prometheus
volumes:
- ./prometheus.yml:/etc/prometheus/prometheus.yml
ports:
- "9090:9090"
```
Here, `image` specifies the Docker image to use for Prometheus and `volumes` mounts your local **prometheus.yml** file into the container at `etc/prometheus/prometheus.yml`. This file contains the configuration Prometheus will use and `ports` maps port 9090 on the Docker container to port 9090 on your host machine. This makes the Prometheus web UI accessible at `localhost:9090`.
Use Docker Compose to start the Prometheus server: `docker-compose up`
### 3. Verifying Metrics Collection
Open your browser and navigate to `http://localhost:9090/graph` to access the Prometheus web UI. Here, you can execute queries to verify that Prometheus is successfully scraping and storing metrics.
For instance, running the query `http_requests_total` will display metrics related to the number of HTTP requests processed by your application.
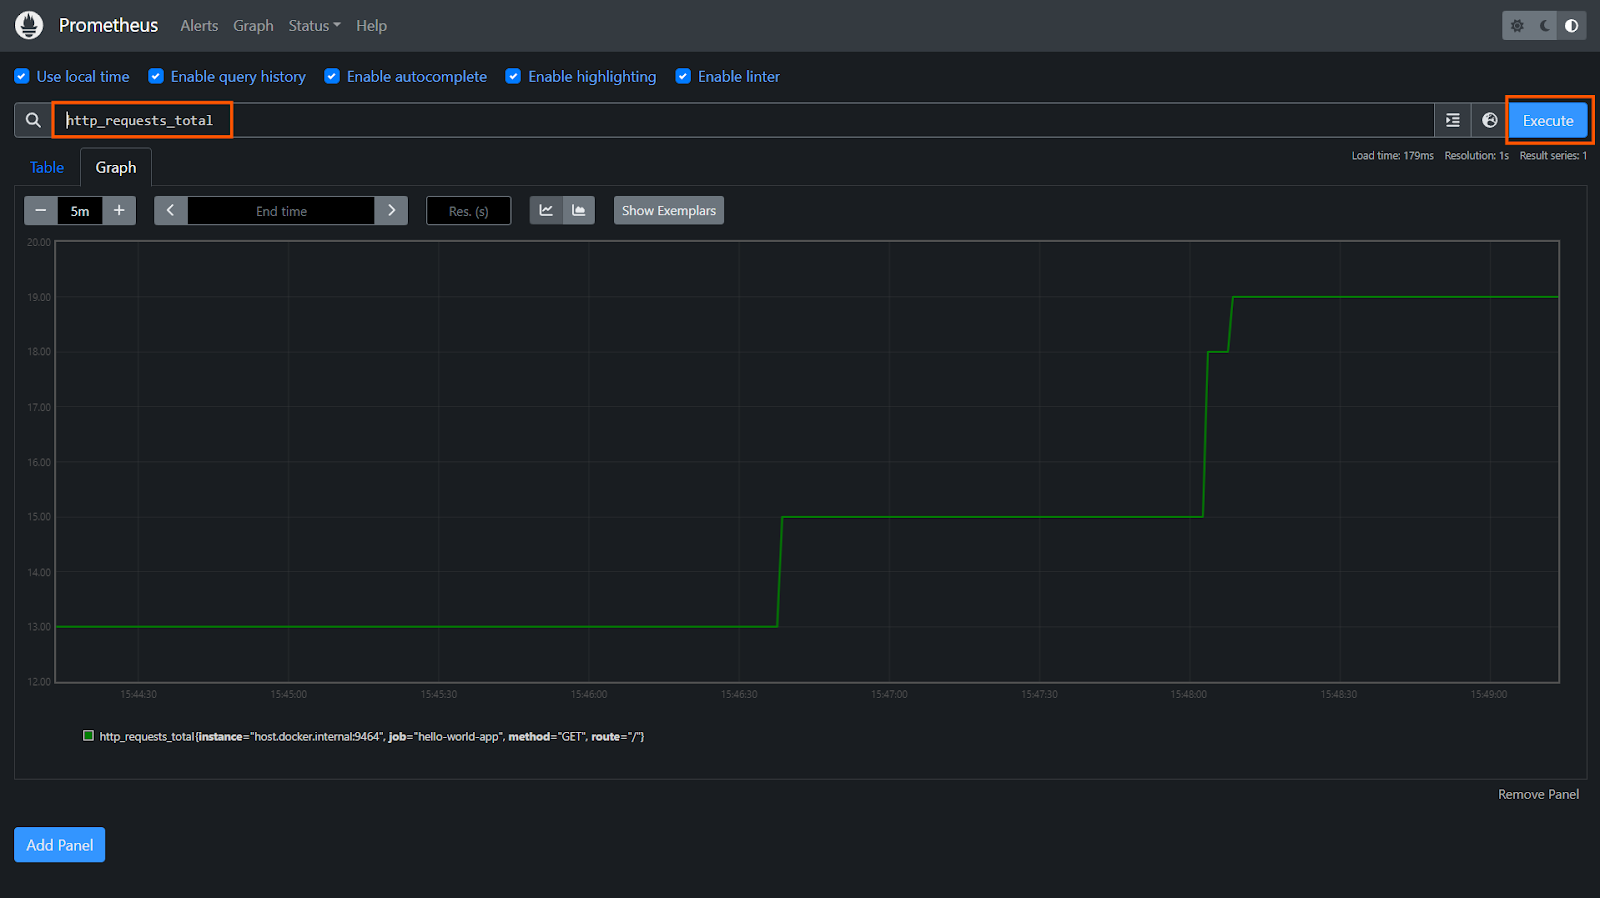
With Prometheus configured, you now have a monitoring tool that collects and stores metrics from your Node.js application. Now, let's configure Loki to get logs from your application.
## 3. Setting up Loki for the Node.js Application
Logs are vital for diagnosing issues and understanding how your application behaves in different scenarios. They offer detailed insights into system events, errors, and application flow, making them indispensable for effective troubleshooting and performance monitoring. Loki is a log aggregation system designed to work seamlessly with Grafana. It collects and stores logs, enabling powerful querying and visualization through Grafana.
To set up Loki to collect logs from your Node.js application, follow these steps:
### 1. Add Loki to Your Docker Compose Configuration
Extend your **docker-compose.yml** file to include Loki. This allows you to run Loki as a container alongside your Prometheus instance:
```yml
loki:
image: grafana/loki:2.9.10
ports:
- "3100:3100"
```
`grafana/loki:2.9.10` is the official Loki image from Grafana and the port `3100` on the Docker container is mapped to the port `3100` on your host machine. This allows you to access Loki's API and check its status.
With Loki added to your Docker Compose configuration, restart your containers to include Loki.
```bash
docker-compose up
```
### 2. Verify Loki's is Running
Loki does not have a traditional web UI for interacting with logs, so you'll need to check its status and ensure it's running correctly by accessing its metrics endpoint.
```bash
http://localhost:3100/metrics
```
This endpoint will display raw metrics data related to Loki, confirming that Loki is up and running. The metrics here are used internally by Grafana to visualize logs and track Loki's performance.
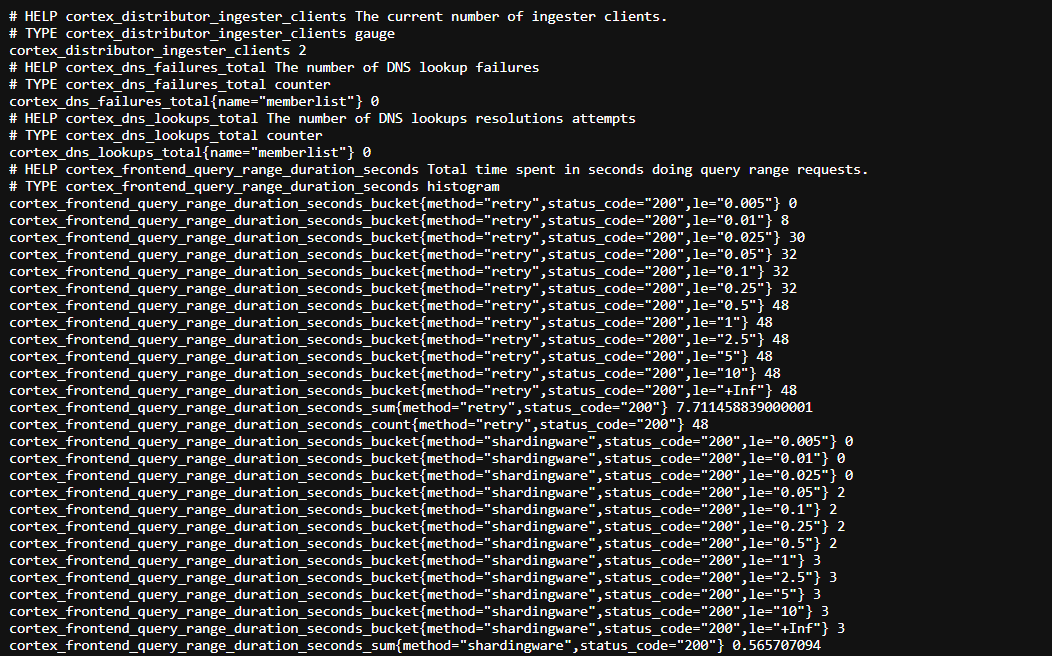
With logs being collected and stored by Loki, you can use Grafana to visualize these logs, helping you gain deeper insights into your application's behavior and troubleshoot issues more effectively.
## 4. Setting up Tempo for the Node.js Application
While metrics tell you how your application is performing and logs show what is happening, traces help answer why something is going wrong by showing the detailed flow of requests through your system. Tempo is designed to collect and store these traces.
To ensure traces from your Node.js application are captured, configure Tempo to accept traces exported by the OpenTelemetry. Tempo will act as a bridge, collecting traces from your app, which will be fetched by Grafana and the Tracetest Agent for further testing.
### 1. Create a Tempo Configuration File
Ensure that Tempo is set up with the appropriate storage configuration in the **tempo.yaml** file to handle the incoming traces.
```yaml
stream_over_http_enabled: true
server:
http_listen_port: 80
log_level: info
query_frontend:
search:
duration_slo: 5s
throughput_bytes_slo: 1.073741824e+09
trace_by_id:
duration_slo: 5s
distributor:
receivers:
jaeger:
protocols:
thrift_http:
grpc:
thrift_binary:
thrift_compact:
zipkin:
otlp:
protocols:
http:
grpc:
opencensus:
ingester:
max_block_duration: 5m
compactor:
compaction:
block_retention: 1h
storage:
trace:
backend: local
wal:
path: /var/tempo/wal
local:
path: /var/tempo/blocks
```
### 2. Add Tempo to Your Docker Compose
In the **docker-compose.yml**, add Tempo in the services and map the local port `3200` of your machine with `80` of the Docker container since that is the default port of Tempo.
```yml
init:
image: &tempoImage grafana/tempo:latest
user: root
entrypoint:
- "chown"
- "10001:10001"
- "/var/tempo"
volumes:
- ./tempo-data:/var/tempo
tempo:
image: *tempoImage
command: [ "-config.file=/etc/tempo.yaml" ]
volumes:
- ./tempo.yaml:/etc/tempo.yaml
- ./tempo-data:/var/tempo
ports:
- "14268:14268"
- "3200:80" # tempo
- "9095:9095"
- "4417:4317" # otlp grpc
- "4418:4318" # otlp http
- "9411:9411"
depends_on:
- init
```
The init container runs a command to change the ownership of the `/var/tempo` directory to user `10001`, and the Tempo service uses the `grafana/tempo` image to start Tempo with the specified configuration file, exposing multiple ports for tracing protocols.
## 5. Enabling Observability in Grafana
With Prometheus, Loki, and Tempo set up, it's time to integrate them into Grafana for visualization.
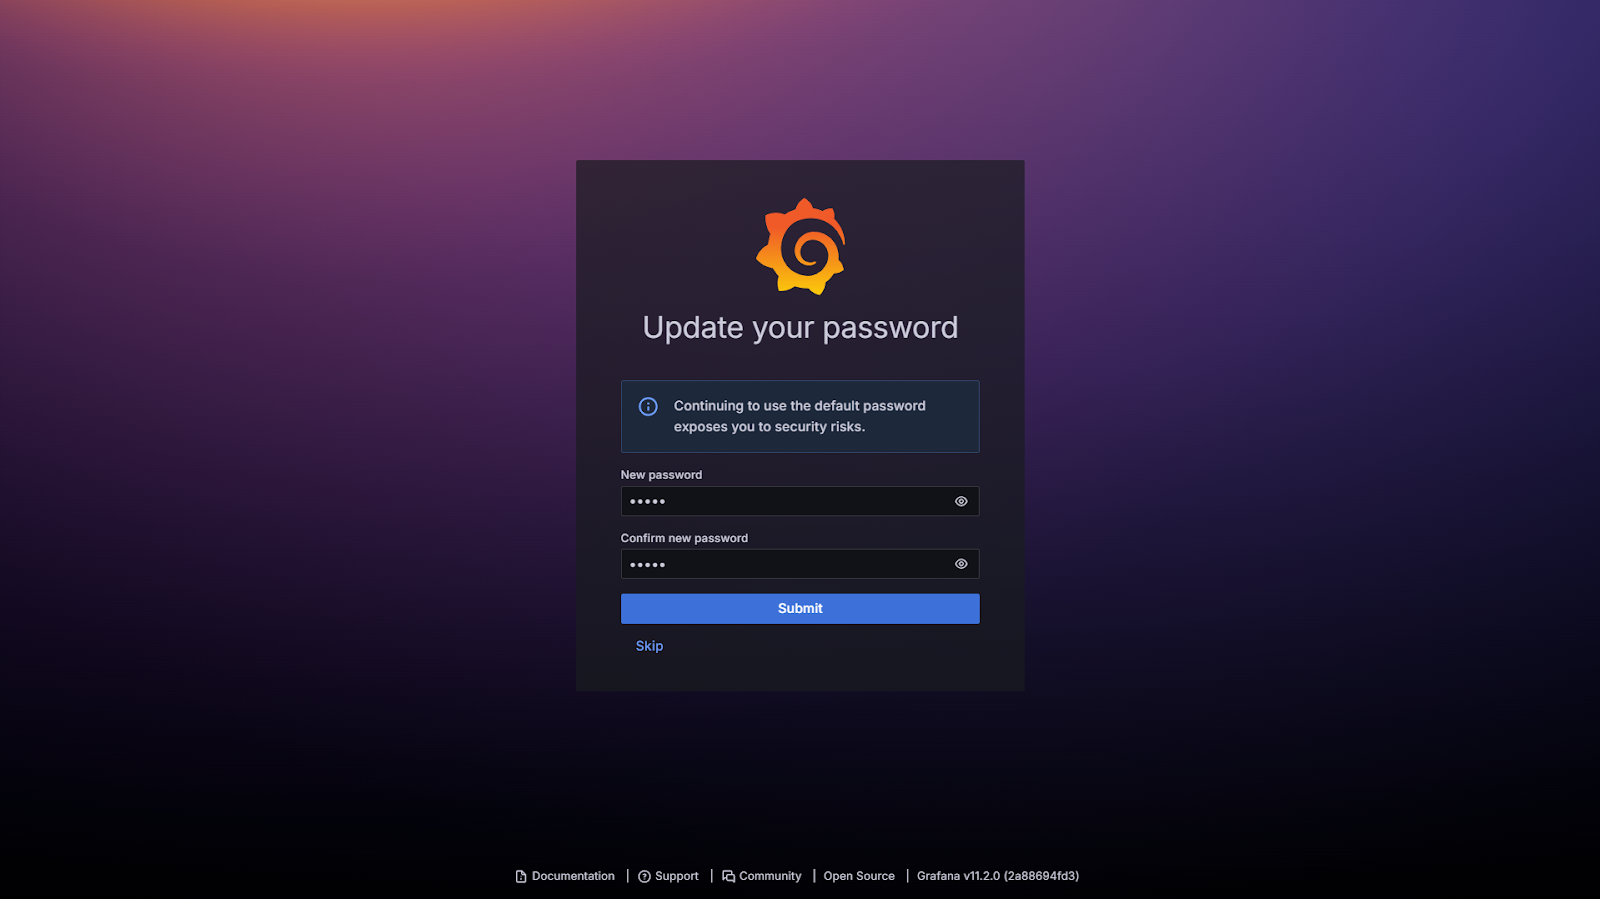
Begin with adding Prometheus as a data source in Grafana. Go to `localhost:3000` where Grafana is running. On the login page, enter `admin` in both username and password.
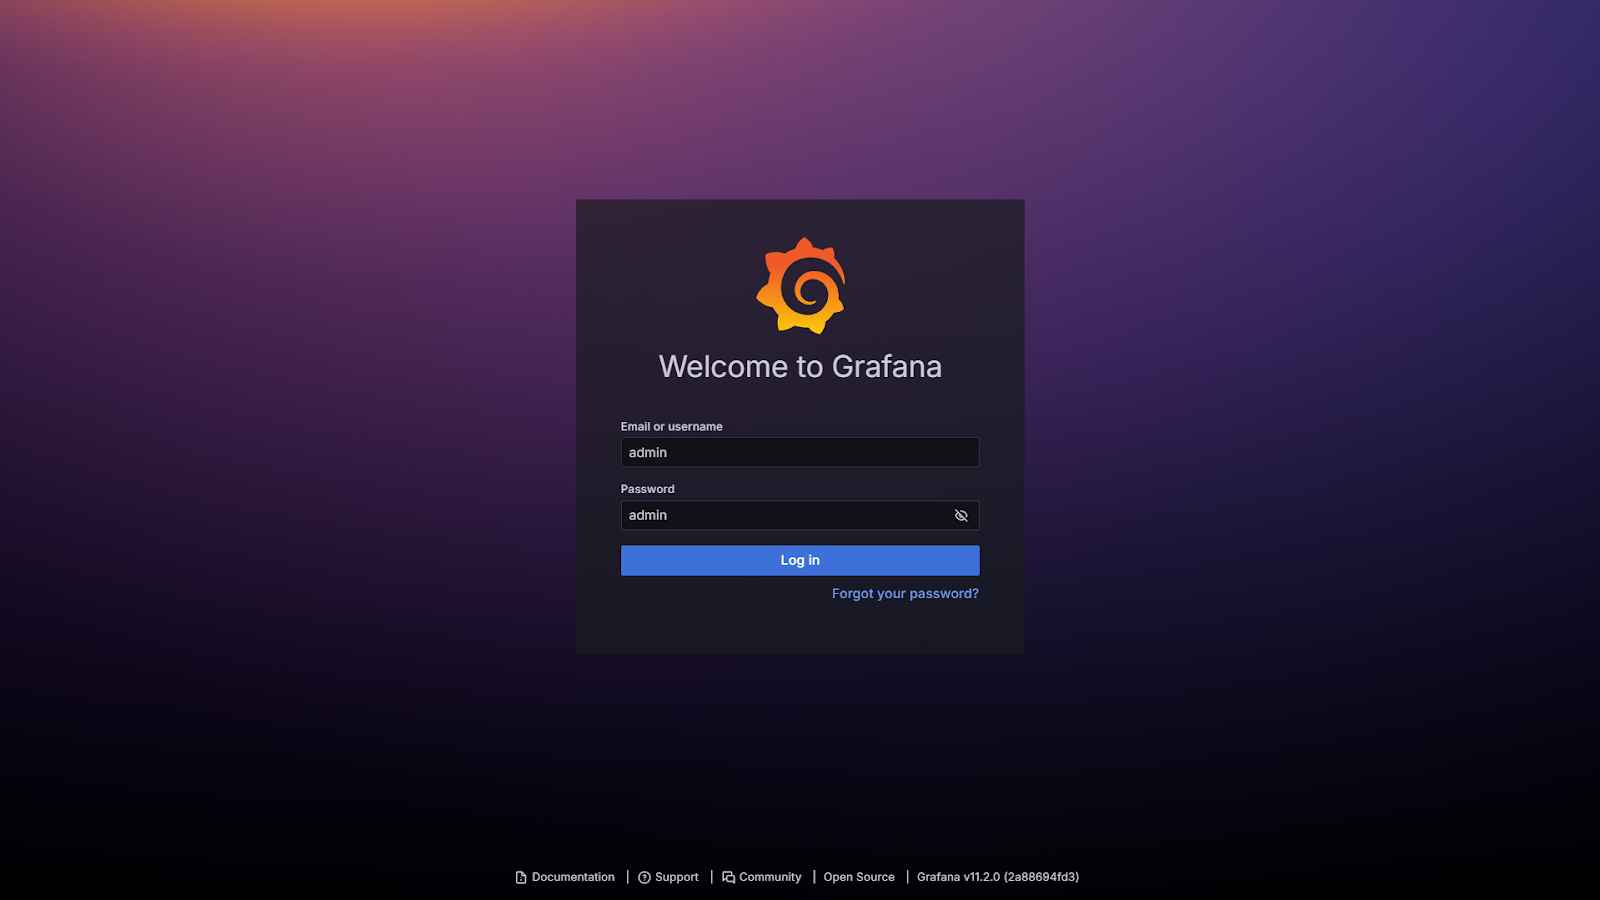
On the next page, you can update your password or skip it to continue with the default one.
### 1. Adding a Data Source in Grafana
After logging in, go to the Data Sources, click "Add new Data Source" and search for Prometheus to configure it.

In the "Connection" section enter the Prometheus server URL as `http://prometheus:9090`. Keep the other settings as default.
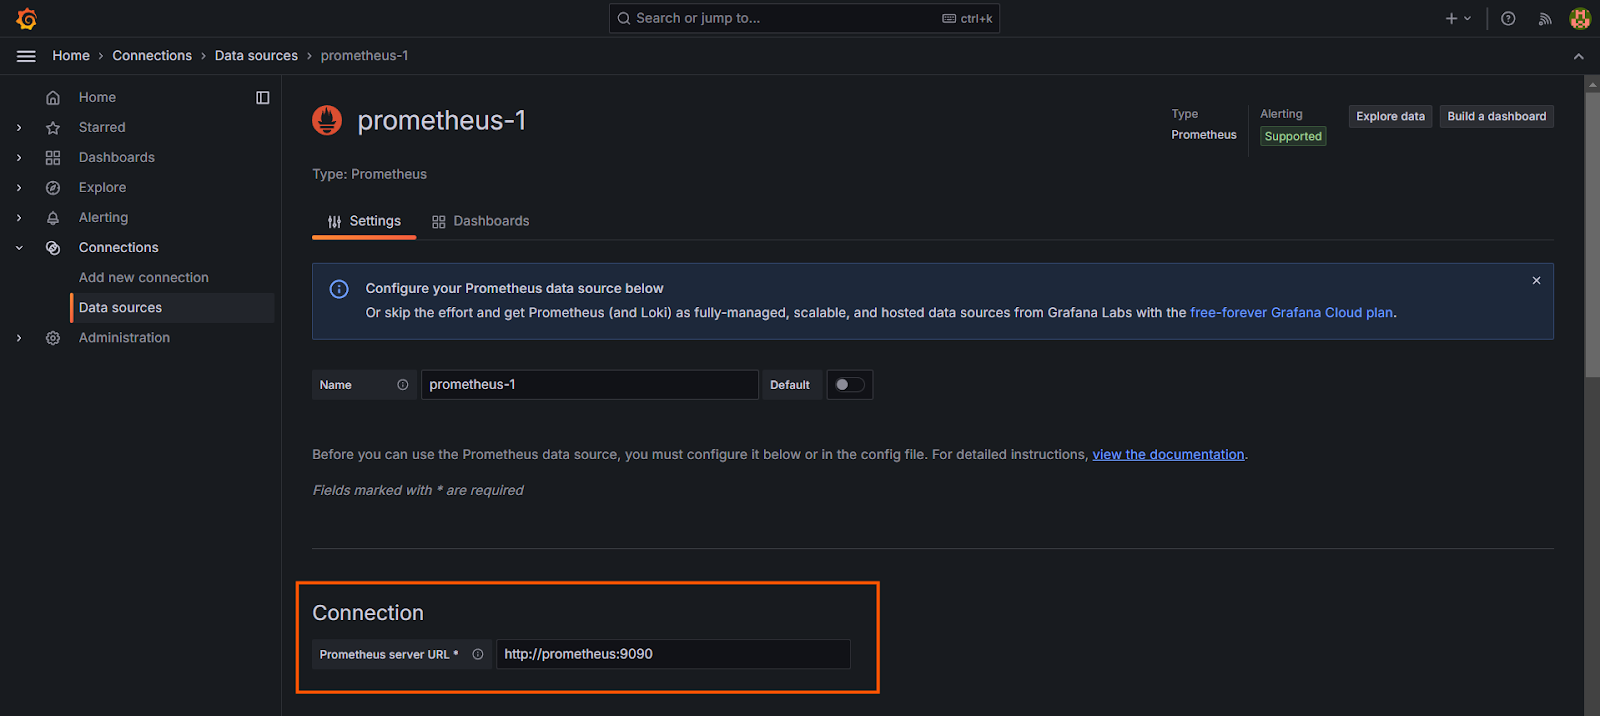
Scroll down and click the "Save & test" button to verify the connection between Prometheus and Grafana.

Similarly, search for Loki in the new Data Sources to configure it. In the connection URL of Loki, enter `http://loki:3100` and verify it by clicking "Save & test".

Add Tempo as the final Data Source. Configure its Connection URL as `http://tempo:80`. Finally, verify the server connection by clicking on "Save & test".

Adding these integrations allows you to create dashboards that visualize metrics, logs, and traces all in one place.
### 2. Setting up Grafana for Visualization
Go to the Dashboards tab to create dashboards in Grafana to visualize your metrics, logs, and traces. For example, you might create a dashboard that shows HTTP request rates, info logs, and trace latencies.

On the next panel, click on "Add visualization" to add panels of Prometheus, Loki and Tempo.
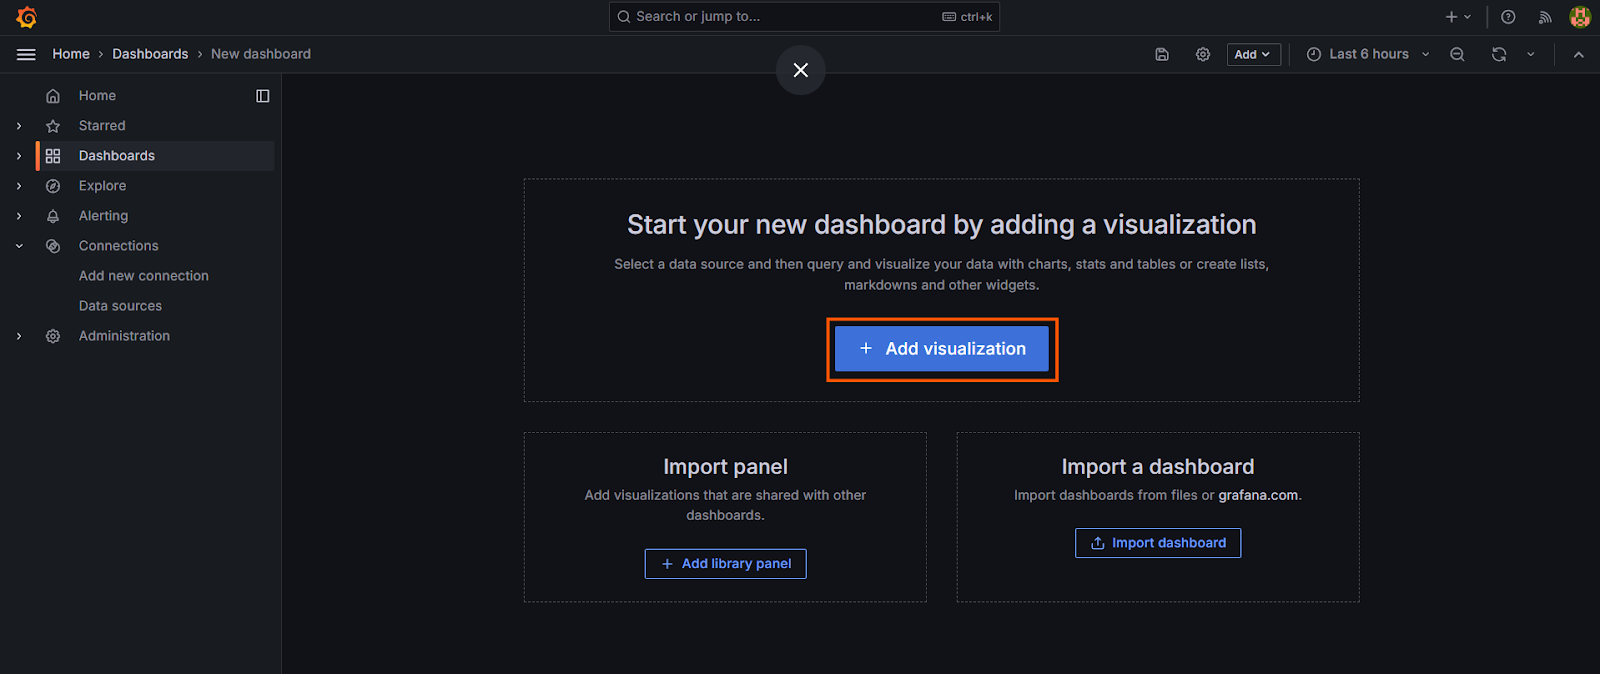
From the available data sources, select Prometheus to configure its panel. In the query section, select `http_request_total` and run the query to get a time series graph of total HTTP requests on the application. Click the "Save" button to save its configuration and get the panel on the dashboard.
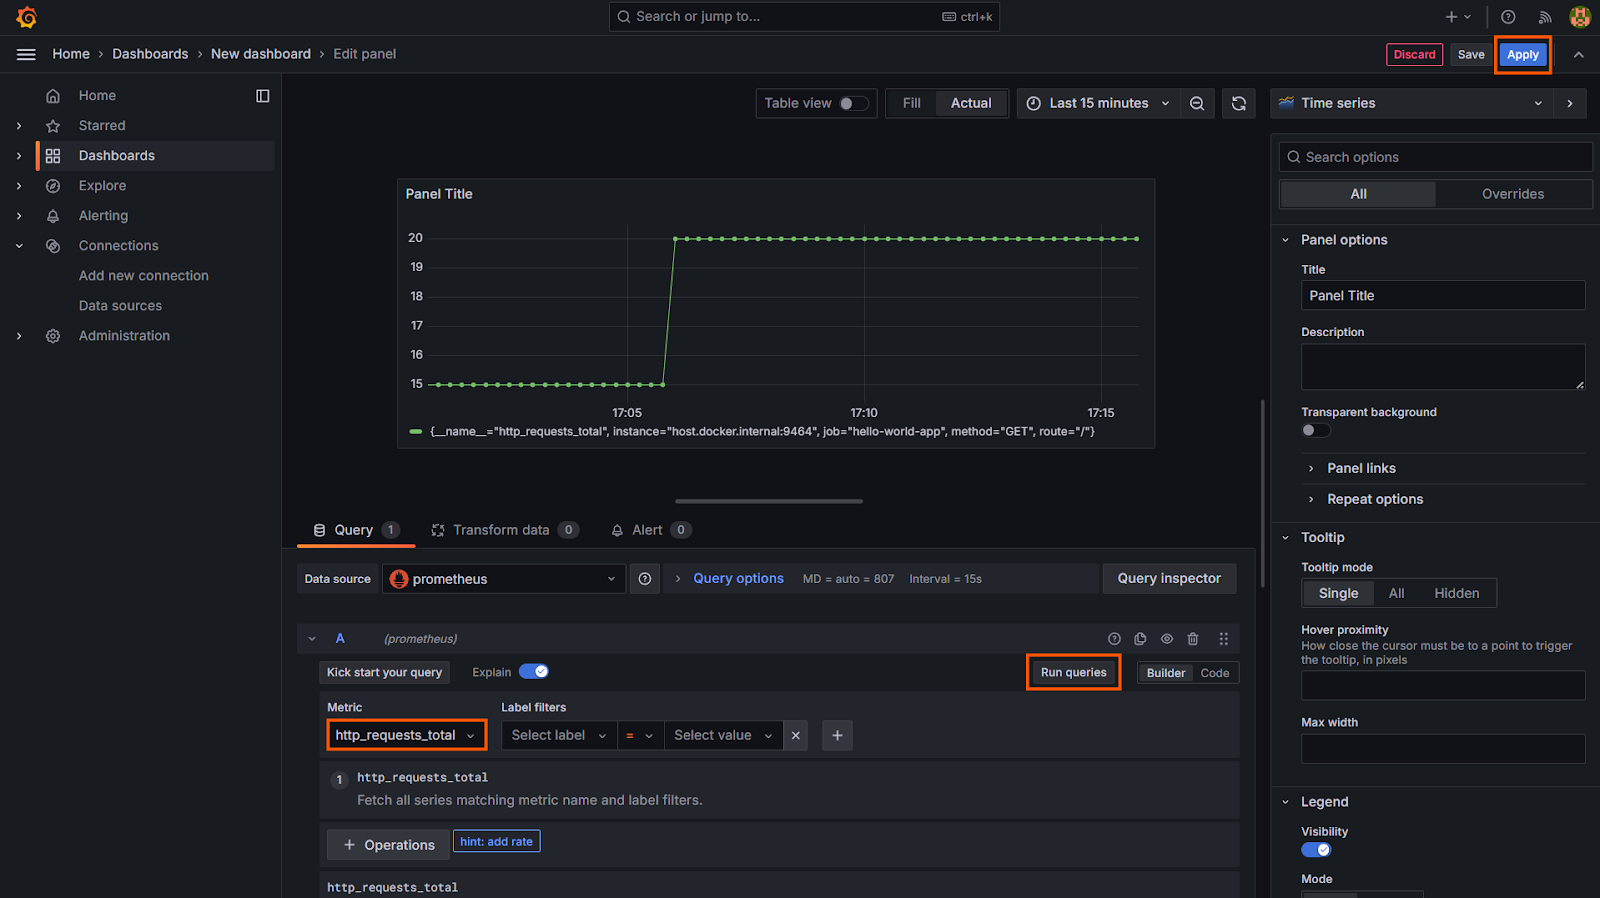
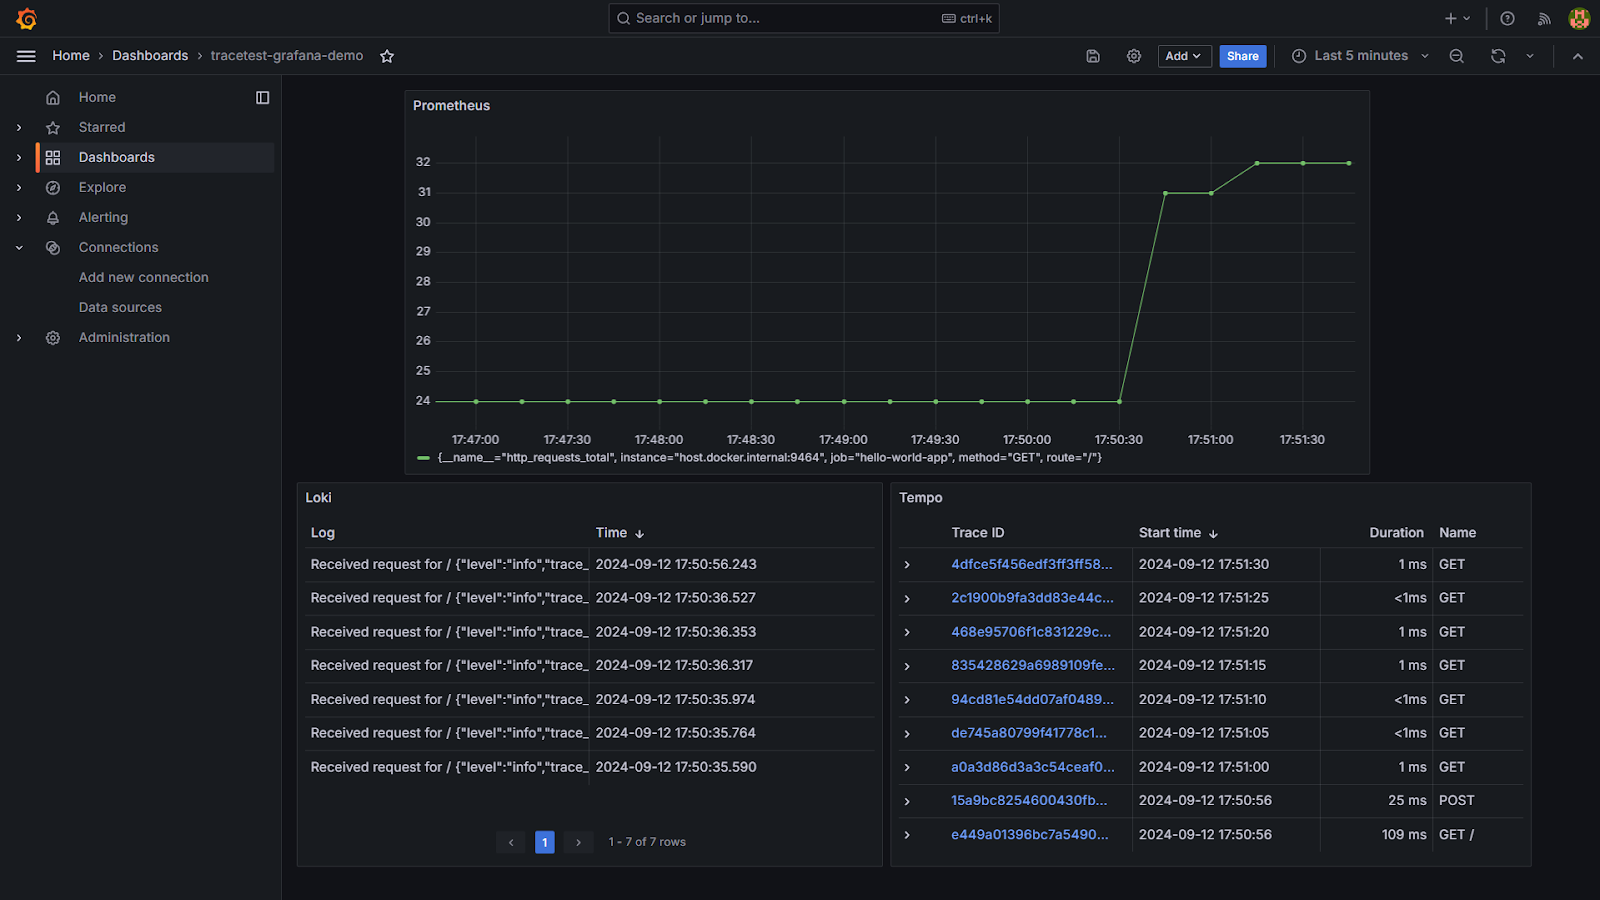
On the dashboard, you will see the panel showing the total HTTP requests on the application in the form of a time series graph. Now, select "Visualization" on the "Add" dropdown to add Loki in the similar way.

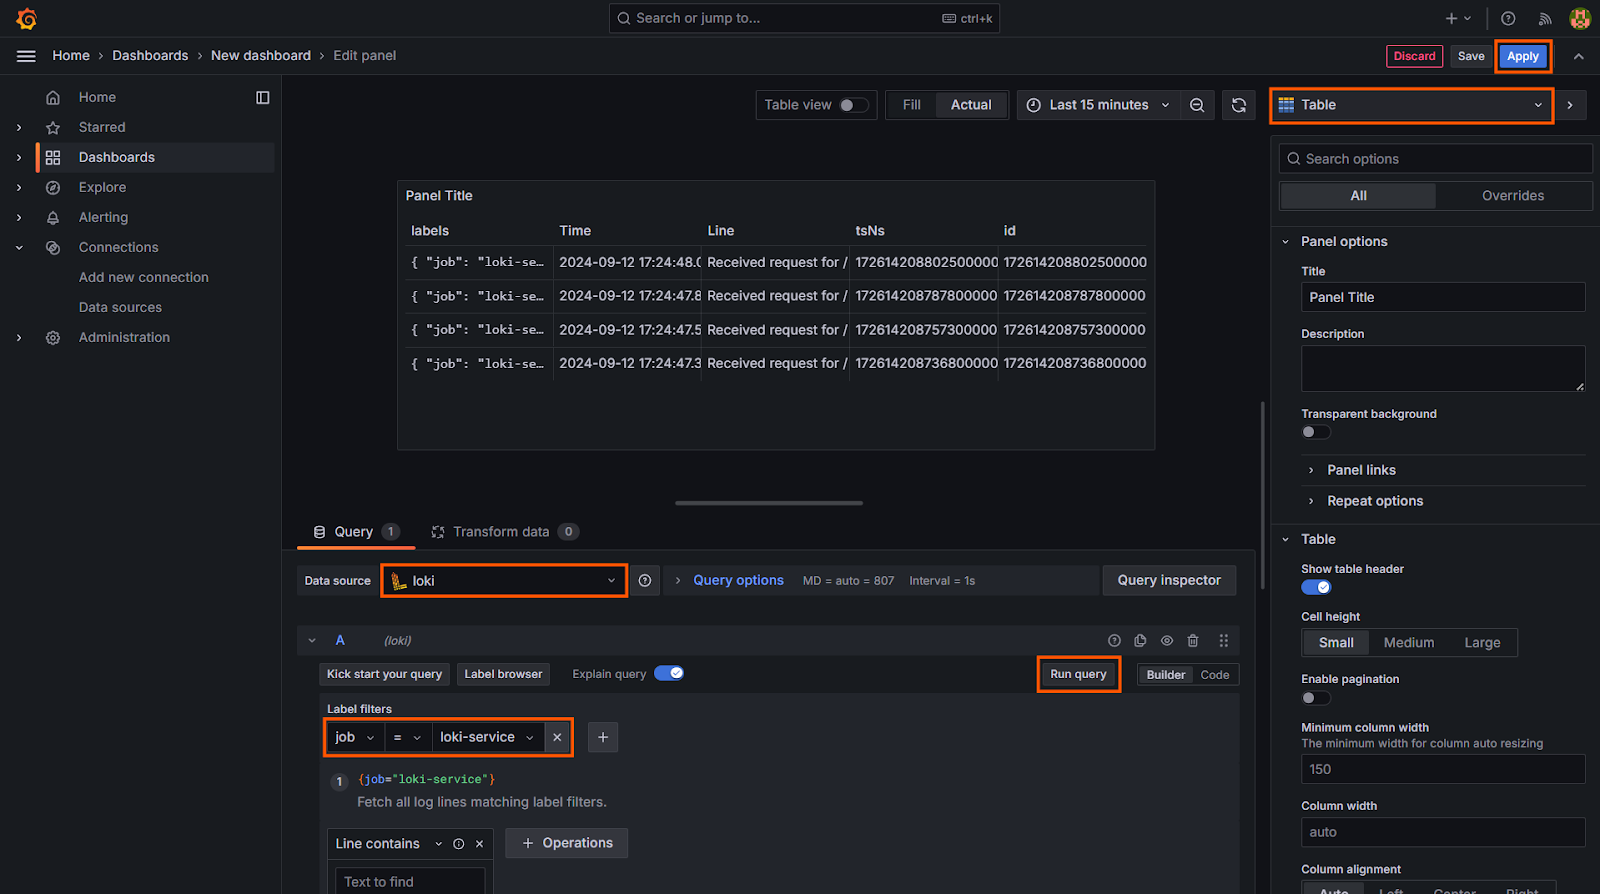
In the Data Source, select Loki, select job in the filter, and table as the visualization in the top right corner. Finally, apply the changes to save the panel.
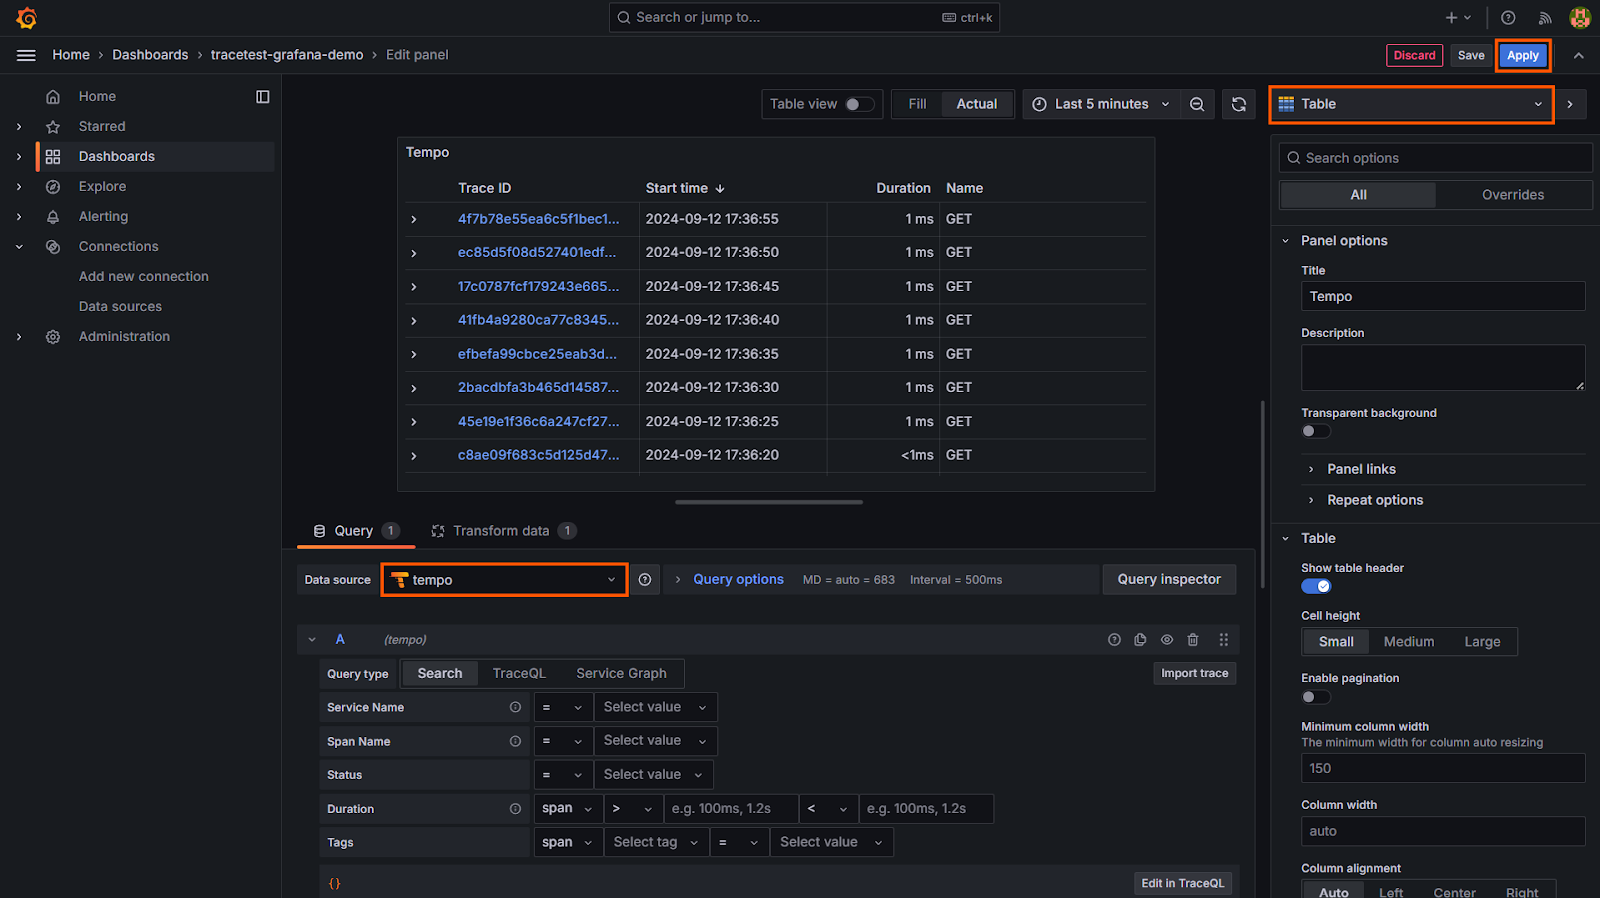
Similar to Loki, add one more panel, select the Data Source as Tempo and visualization as Table to get a proper view of all the traces generated in the application.
With all the three panels created, you can resize and adjust their position on the Grafana dashboard according to your requirements.
## 6. End-to-End Testing Using Trace-Based Testing with Tracetest
Once you have your observability stack up and running, the next step is ensuring everything works as expected. But how can you test if all the traces, logs, and metrics you're collecting are not only being captured correctly but also providing meaningful insight? That's where Tracetest comes in. It's designed to take your end-to-end testing to the next level by leveraging trace-based testing.
### 1. Sign up to Tracetest
Let us start by signing up to Tracetest. Go to the Tracetest [Sign Up](https://app.tracetest.io/?flow=ed6bcf4b-b36e-406e-b21b-66681981e68f) page and log in with your Google or GitHub account.
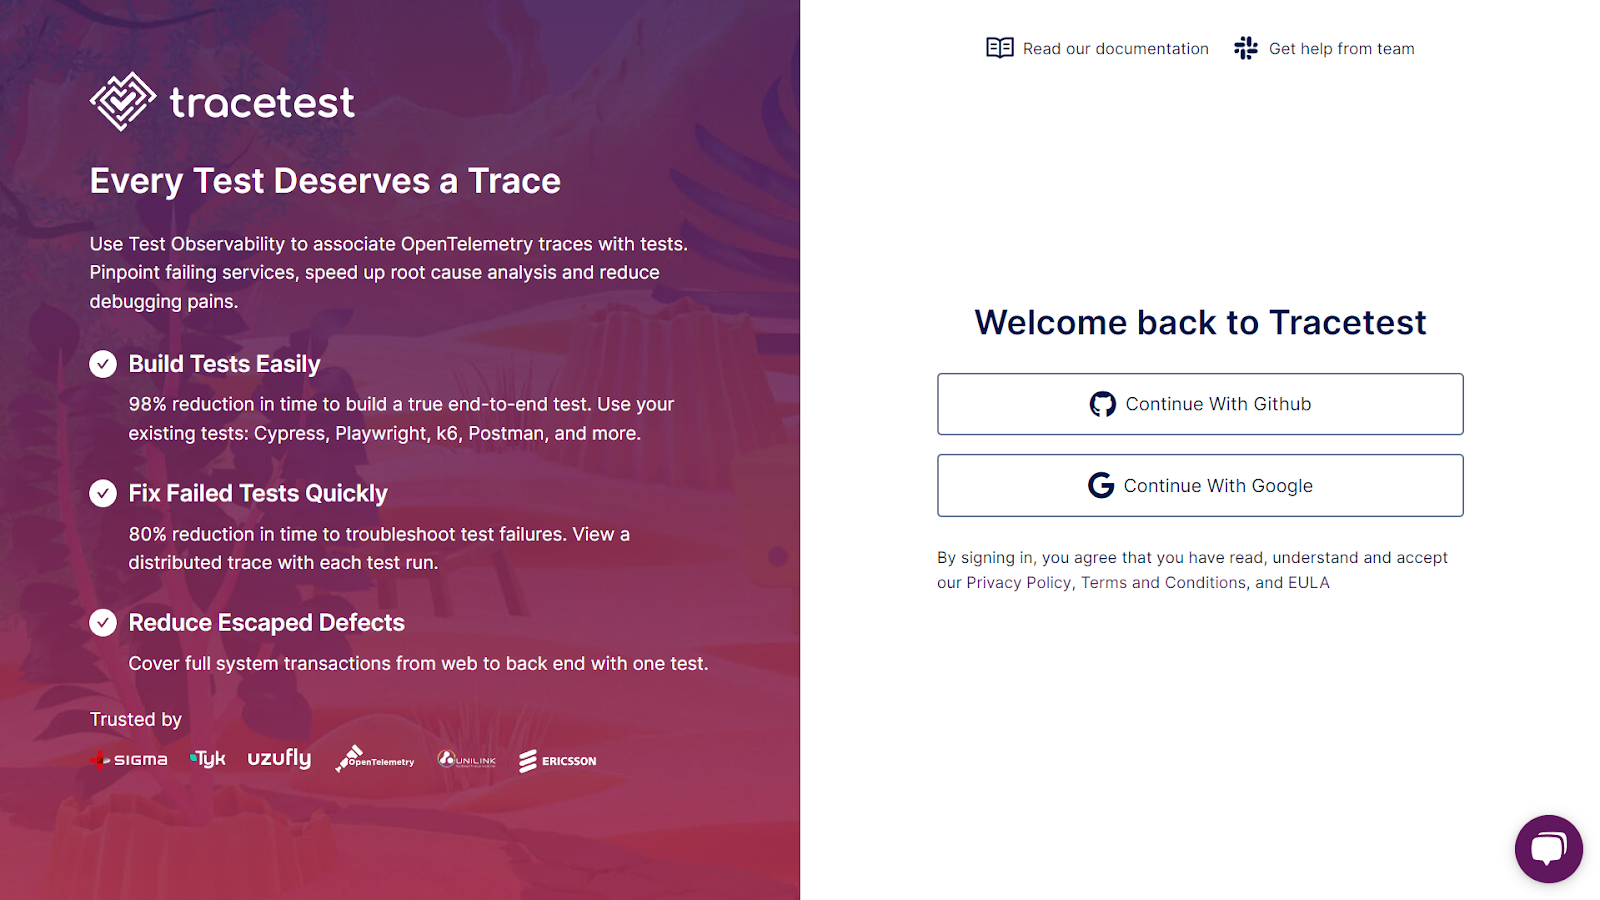
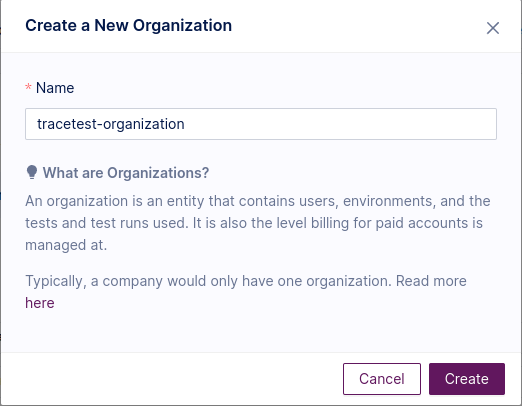
Create a new organization in your Tracetest account.
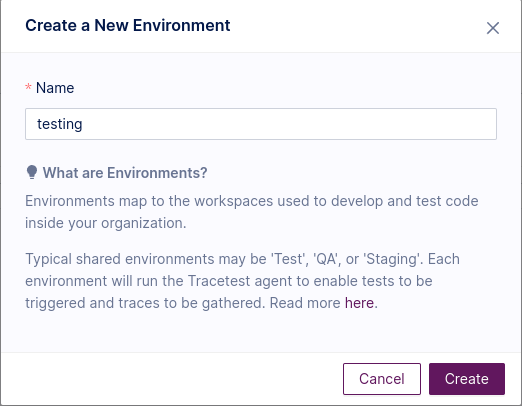
In the organization, a new environment must be created as well.
### 2. Set up the Tracetest Agent
Return to your `docker-compose.yml` file, and add a service to run the Tracetest Agent in a container.
```yml
tracetest-agent:
image: kubeshop/tracetest-agent
environment:
- TRACETEST_API_KEY=${TRACETEST_TOKEN}
- TRACETEST_ENVIRONMENT_ID=${TRACETEST_ENVIRONMENT_ID}
```
Find [your `TRACETEST_TOKEN` and `TRACETEST_ENVIRONMENT_ID`, here](https://app.tracetest.io/retrieve-token).
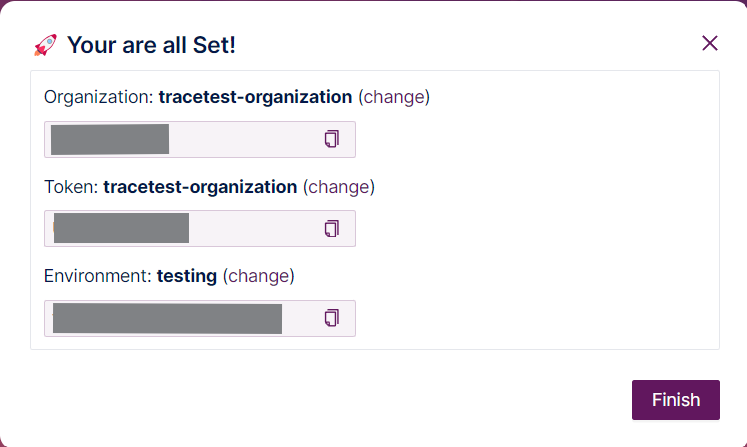
Now, update the **.env** file in the root directory and add the values of `TRACETEST_API_KEY` and `TRACETEST_ENVIRONMENT_ID` you copied from `https://app.tracetest.io/retrieve-token`
```bash
TRACETEST_TOKEN="<your-tracetest-organization-token>"
TRACETEST_ENVIRONMENT_ID="<your-environment-id>"
OTEL_EXPORTER_OTLP_TRACES_ENDPOINT="http://tempo:4318/v1/traces"
```
Run the Docker Compose file again with `docker-compose up` to run the Tracetest Agent with the rest of the services.
### 3 . Ingest the Traces from Tempo to Tracetest
In the Settings of Tracetest UI, go to the "Trace Ingestion" tab and select Tempo as your tracing backend. Enable trace ingestion, Select connection type as `Http`, and enter `http://tempo:80` as the URL. Finally, click "Test Connection" and "Save" to test the connection with Tempo and save the backend configuration.
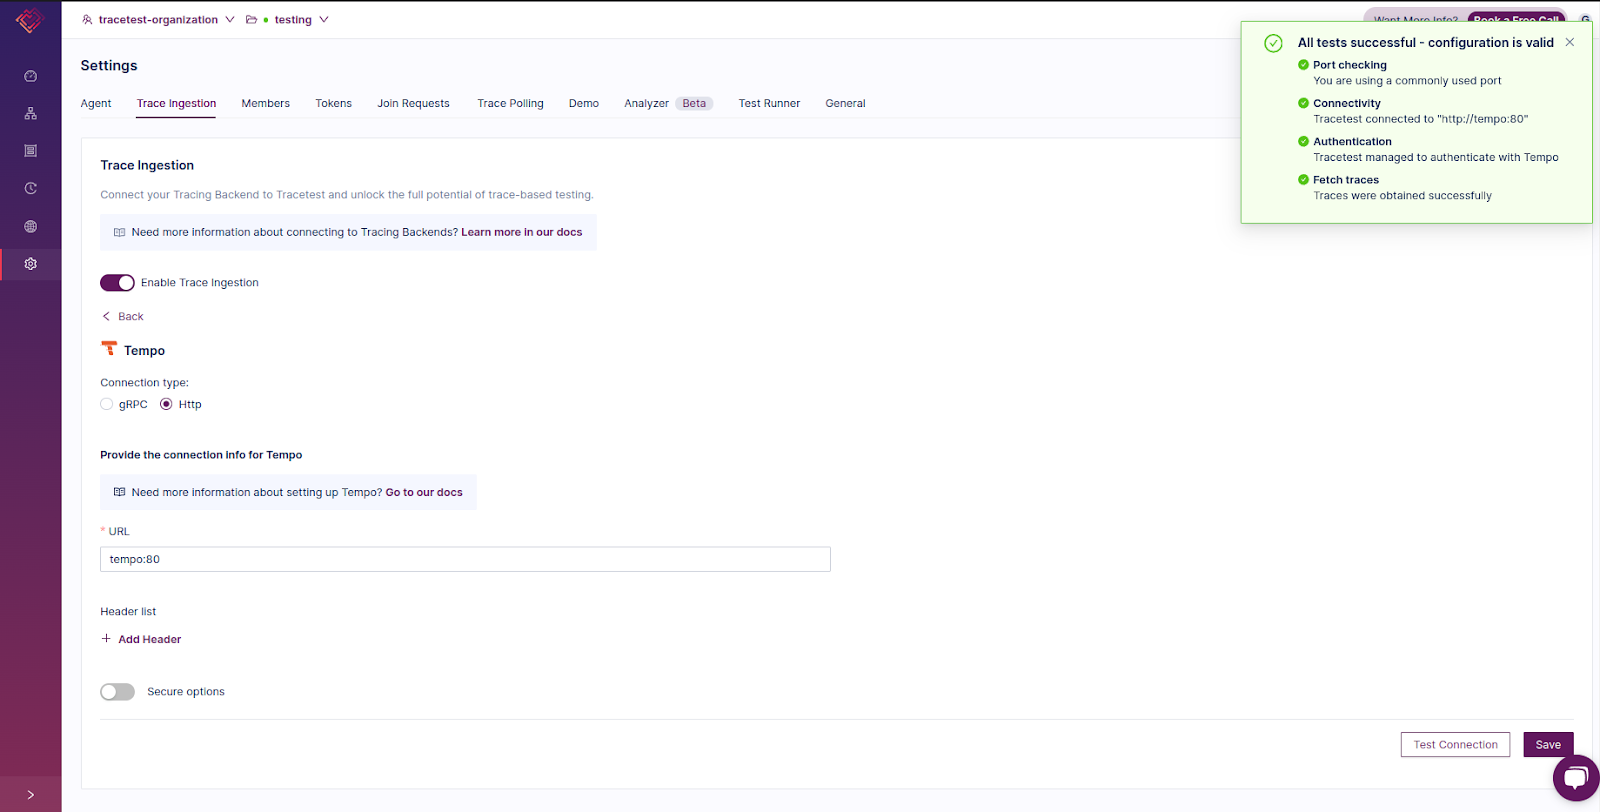
You can also apply it with the CLI. First, configure the Tracetest CLI in your Terminal.
```bash
tracetest configure --token <your-tracetest-organization-token> --environment <your-environment-id>
```
Create a file for the connection to Tempo.
```yaml
# tracetest-trace-ingestion.yaml
type: DataStore
spec:
id: current
name: Grafana Tempo
type: tempo
default: true
tempo:
type: http
http:
url: http://tempo:80
tls:
insecure: true
```
And run this command to apply it.
```bash
tracetest apply datastore -f tracetest-trace-ingestion.yaml
```
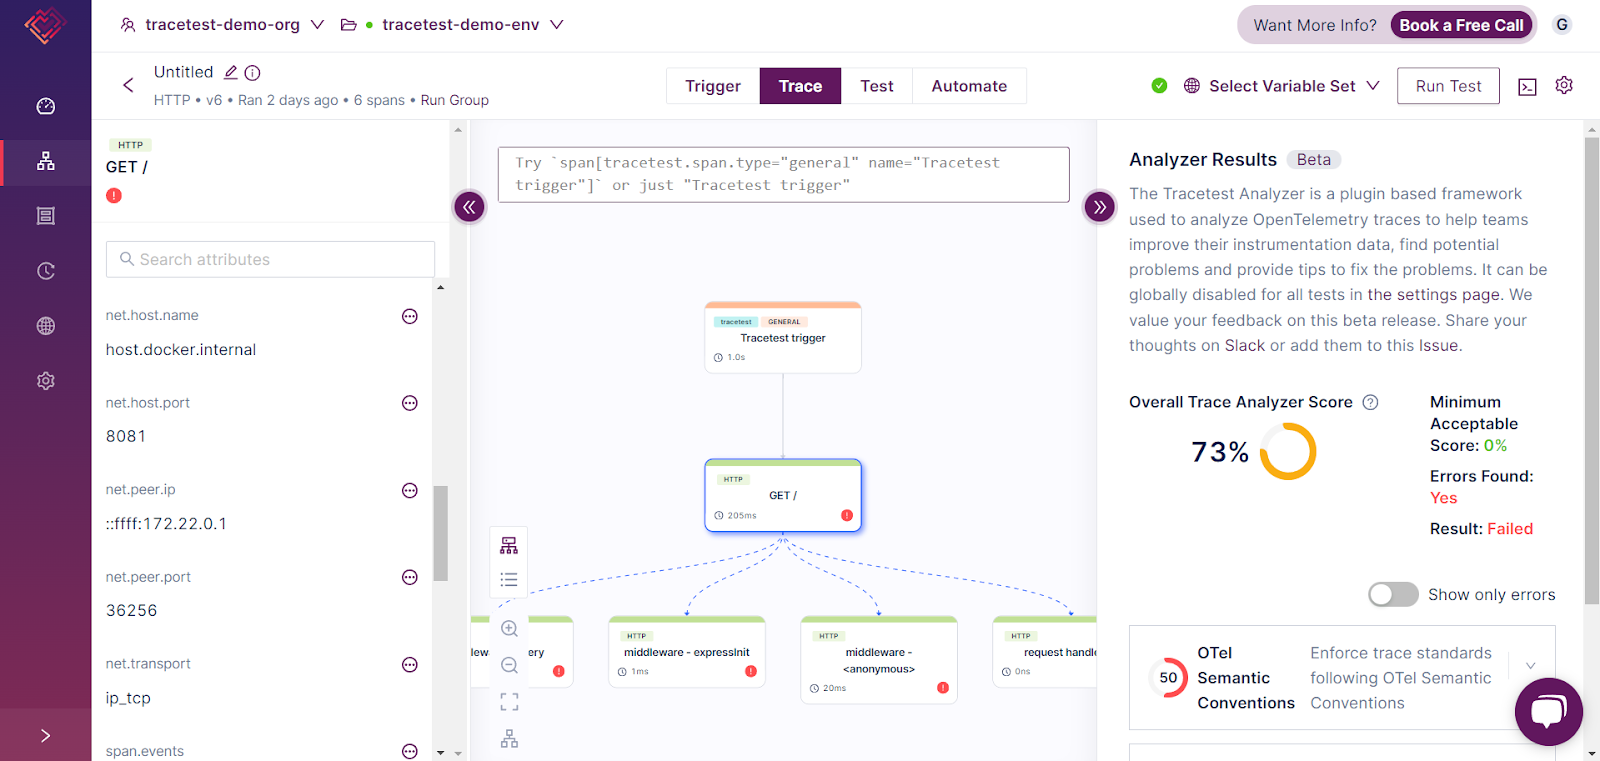
Now trigger a test with a `GET` request on `http://app:8081` where the application is running.

Go to the Trace tab to get a flow of your traces in the application.
### 4. Automate the Tests with Tracetest CLI
Now, let us see how to automate these tests. Go to the Automate tab and follow the CLI configuration steps to automate the testing using your command line.
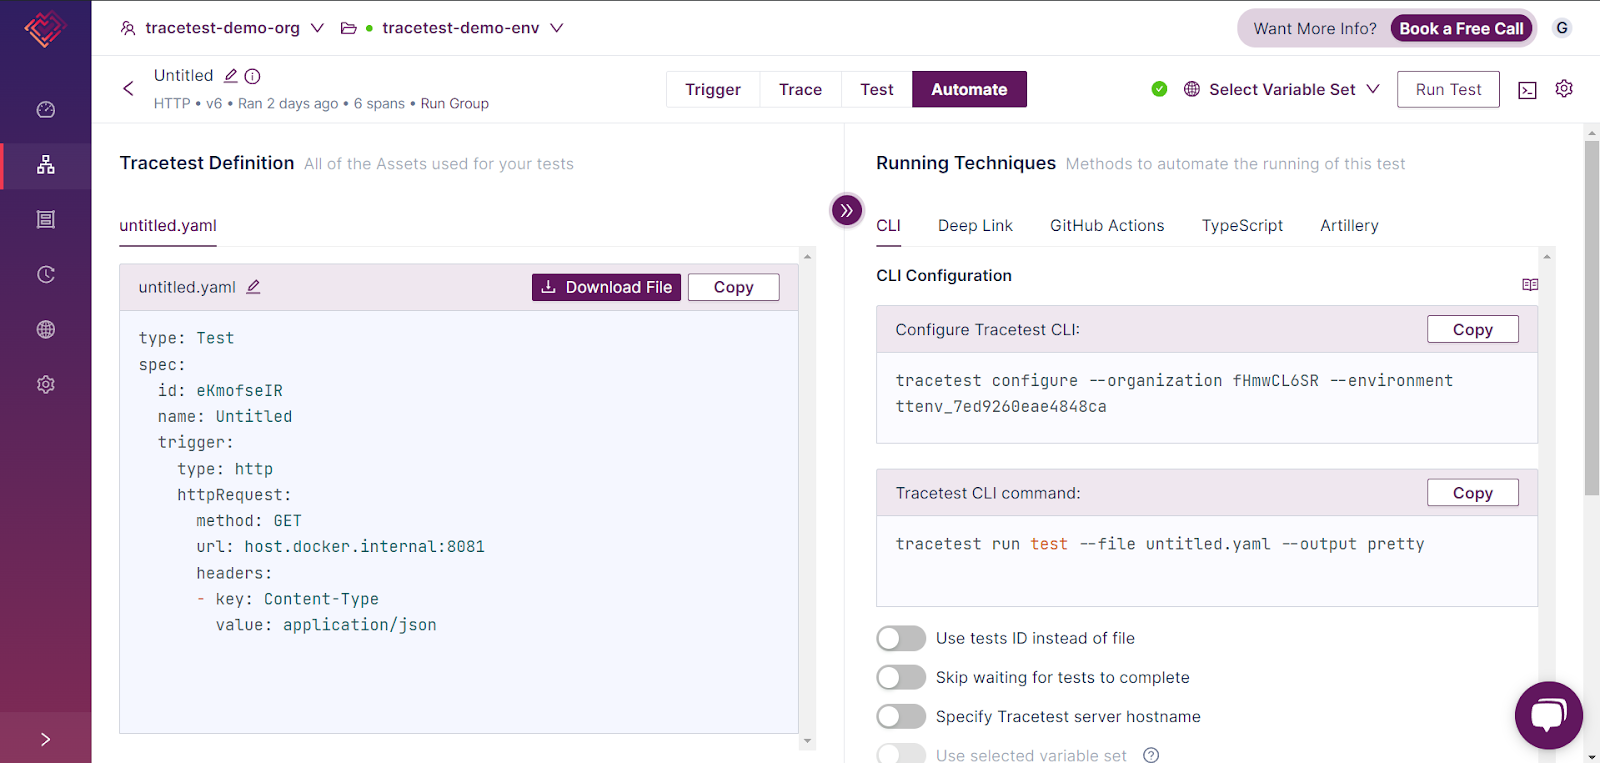
You can download the `untitled.yaml`, rename it to `tracetest-test.yaml`, and add assertions to the file in yaml format to execute the `tracetest run test --file tracetest-test.yaml --output pretty` command and automate the tests.
For example, you can add assertions in the configuration file as given below.
```yml
type: Test
spec:
id: eKmofseIR
name: Untitled
trigger:
type: http
httpRequest:
method: GET
Url: http://app:8081
headers:
- key: Content-Type
value: application/json
selector: span[tracetest.span.type = "http"]
# the assertions define the checks to be run. In this case, all
# http spans will be checked for a status code = 200
- assertions:
- http.status_code = 200
```
Trigger the test.
```bash
tracetest run test --file ./tracetest-test.yaml --output pretty
✔ RunGroup: #v52GDwRHR (https://app.tracetest.io/organizations/_HDptBgNg/environments/ttenv_6da9b4f817b8b9df/run/v52GDwRHR)\
Summary: 1 passed, 0 failed, 0 pending\
✔ Untitled (https://app.tracetest.io/organizations/_HDptBgNg/environments/ttenv_6da9b4f817b8b9df/test/mMtWIwgNg/run/5/test) - trace id: 4362a098956f9bf8790fc4b37e1ad99f
```
That's how Tracetest helps you with your End-to-End Observability by testing all generated traces and automating the end-to-end testing pipeline by leveraging telemetry data.
## Conclusion
End-to-end observability is critical for managing complex applications effectively. By integrating Grafana with Prometheus, Loki, and Tempo, you gain a comprehensive view of your system's performance, logs, and traces. This setup helps not only monitor but also debug and optimize your applications.
With Tracetest, you can further ensure the reliability of your system through proactive testing. As you saw today, implementing these observability practices allows for a more resilient and maintainable system, providing insights that are crucial for modern DevOps practices.
## Frequently Asked Questions
### Q. What are the stages of end-to-end testing?
End-to-end testing typically involves planning, where test cases and scenarios are defined; setup, which includes configuring the environment and integrating necessary tools; execution, where the test cases are run to simulate real-world user interactions; and validation, where results are analyzed to ensure the system behaves as expected. In the context of trace-based testing, this also includes inspecting traces to verify internal processes.
### Q. Is Prometheus a visualization tool?
No, Prometheus is not a visualization tool. It's primarily a metrics storage and monitoring system. It collects, stores, and queries time-series data. However, Prometheus integrates well with visualization tools like Grafana, which can be used to create dashboards and visualizations for the metrics stored in Prometheus.
### Q. What is "trace" in "trace-based testing"?
A trace in testing represents the journey of a request or transaction through various services in a system. In distributed systems, traces help track the flow of requests across different components, making it easier to identify bottlenecks, errors, or latency issues in the entire process.
### Q. What is Grafana and Prometheus?
Grafana is an open-source visualization platform that creates interactive dashboards for monitoring metrics, logs, and traces. Prometheus, on the other hand, is a metrics collection and storage tool. Together, they form a powerful monitoring solution, with Prometheus gathering the data and Grafana visualizing it for better insights and troubleshooting.


.jpg)
.avif)
.avif)