
Using Env Vars to Include & Exclude OpenTelemetry Node.js Libraries
.avif)

You’ll learn how to run Node.js with OpenTelemetry auto instrumentation and how to enable/disable auto instrumentations with environment variables or programmatically in code!
Table of Contents
OpenTelemetry's auto-instrumentation for Node.js is the open standard for tracing your applications. The default setting includes a wide range of events, some of which might not be meaningful or relevant to you. This can create a lot of noise in your distributed traces, making it harder to identify the insights that matter.
To run Node.js with OpenTelemetry auto instrumentation, you'll need to [install the Node.js auto instrumentation module](https://github.com/open-telemetry/opentelemetry-js-contrib/tree/main/metapackages/auto-instrumentations-node#usage-auto-instrumentation).
```bash
npm install --save @opentelemetry/api
npm install --save @opentelemetry/auto-instrumentations-node
```
Enable auto instrumentation by requiring this module using the [--require flag](https://nodejs.org/api/cli.html#-r---require-module):
```bash
node --require '@opentelemetry/auto-instrumentations-node/register' app.js
```
If your Node application is encapsulated in a complex run script, you can also set it via an environment variable before running Node.
```bash
env NODE_OPTIONS="--require @opentelemetry/auto-instrumentations-node/register"
```
The module is highly configurable using environment variables. Many aspects of the auto instrumentation's behavior can be configured for your needs. But, it’s sometimes hard to understand which instrumentations are most useful for your application. This might include HTTP events, database events, or other types of events depending on the nature of your application.
For instance, file system (`fs`) events and TCP (`net`) events are included in the auto-instrumentation, but these might not be useful in every application. Luckily, OpenTelemetry provides ways to customize the instrumentation to suit your needs.
## Enable/Disable Auto Instrumentations with Env Vars
One common problem is the inclusion of file system spans, which might not be relevant to all applications. Disabling these can help to streamline your data and make it easier to interpret.
By default, all [supported Instrumentations](https://github.com/open-telemetry/opentelemetry-js-contrib/tree/main/metapackages/auto-instrumentations-node#supported-instrumentations) are enabled. With the `OTEL_NODE_ENABLED_INSTRUMENTATIONS` environment variable, you can enable certain instrumentations by providing a comma-separated list of the packages without the `@opentelemetry/instrumentation-` prefix.
To enable only [`@opentelemetry/instrumentation-http`](https://github.com/open-telemetry/opentelemetry-js/tree/main/packages/opentelemetry-instrumentation-http) and [`@opentelemetry/instrumentation-express`](https://github.com/open-telemetry/opentelemetry-js-contrib/tree/main/plugins/node/opentelemetry-instrumentation-express) you can run this command below.
```bash
export OTEL_NODE_ENABLED_INSTRUMENTATIONS="http,express"
```
## Enable/Disable Auto Instrumentations Programmatically
You can also initialize OpenTelemetry and configure the auto instrumentations programmatically.
Custom configuration for each auto instrumentations package can be passed to the `getNodeAutoInstrumentations` function. You provide an object with the name of the instrumentation as a key and its configuration as the value.
```javascript
const opentelemetry = require("@opentelemetry/sdk-node")
const { getNodeAutoInstrumentations } = require("@opentelemetry/auto-instrumentations-node")
const { OTLPTraceExporter } = require('@opentelemetry/exporter-trace-otlp-grpc')
const { Resource } = require("@opentelemetry/resources")
const { SemanticResourceAttributes } = require("@opentelemetry/semantic-conventions")
const { NodeTracerProvider } = require("@opentelemetry/sdk-trace-node")
const { BatchSpanProcessor } = require("@opentelemetry/sdk-trace-base")
const dotenv = require("dotenv")
dotenv.config()
const resource = Resource.default().merge(
new Resource({
[SemanticResourceAttributes.SERVICE_NAME]: "quick-start-nodejs-manual-instrumentation",
[SemanticResourceAttributes.SERVICE_VERSION]: "0.0.1",
})
)
const provider = new NodeTracerProvider({ resource: resource })
const exporter = new OTLPTraceExporter()
const processor = new BatchSpanProcessor(exporter)
provider.addSpanProcessor(processor)
provider.register()
const sdk = new opentelemetry.NodeSDK({
traceExporter: exporter,
instrumentations: [
getNodeAutoInstrumentations({
'@opentelemetry/instrumentation-fs': {
enabled: false
},
'@opentelemetry/instrumentation-net': {
enabled: false
},
})
],
serviceName: 'quick-start-nodejs-manual-instrumentation'
})
sdk.start()
```
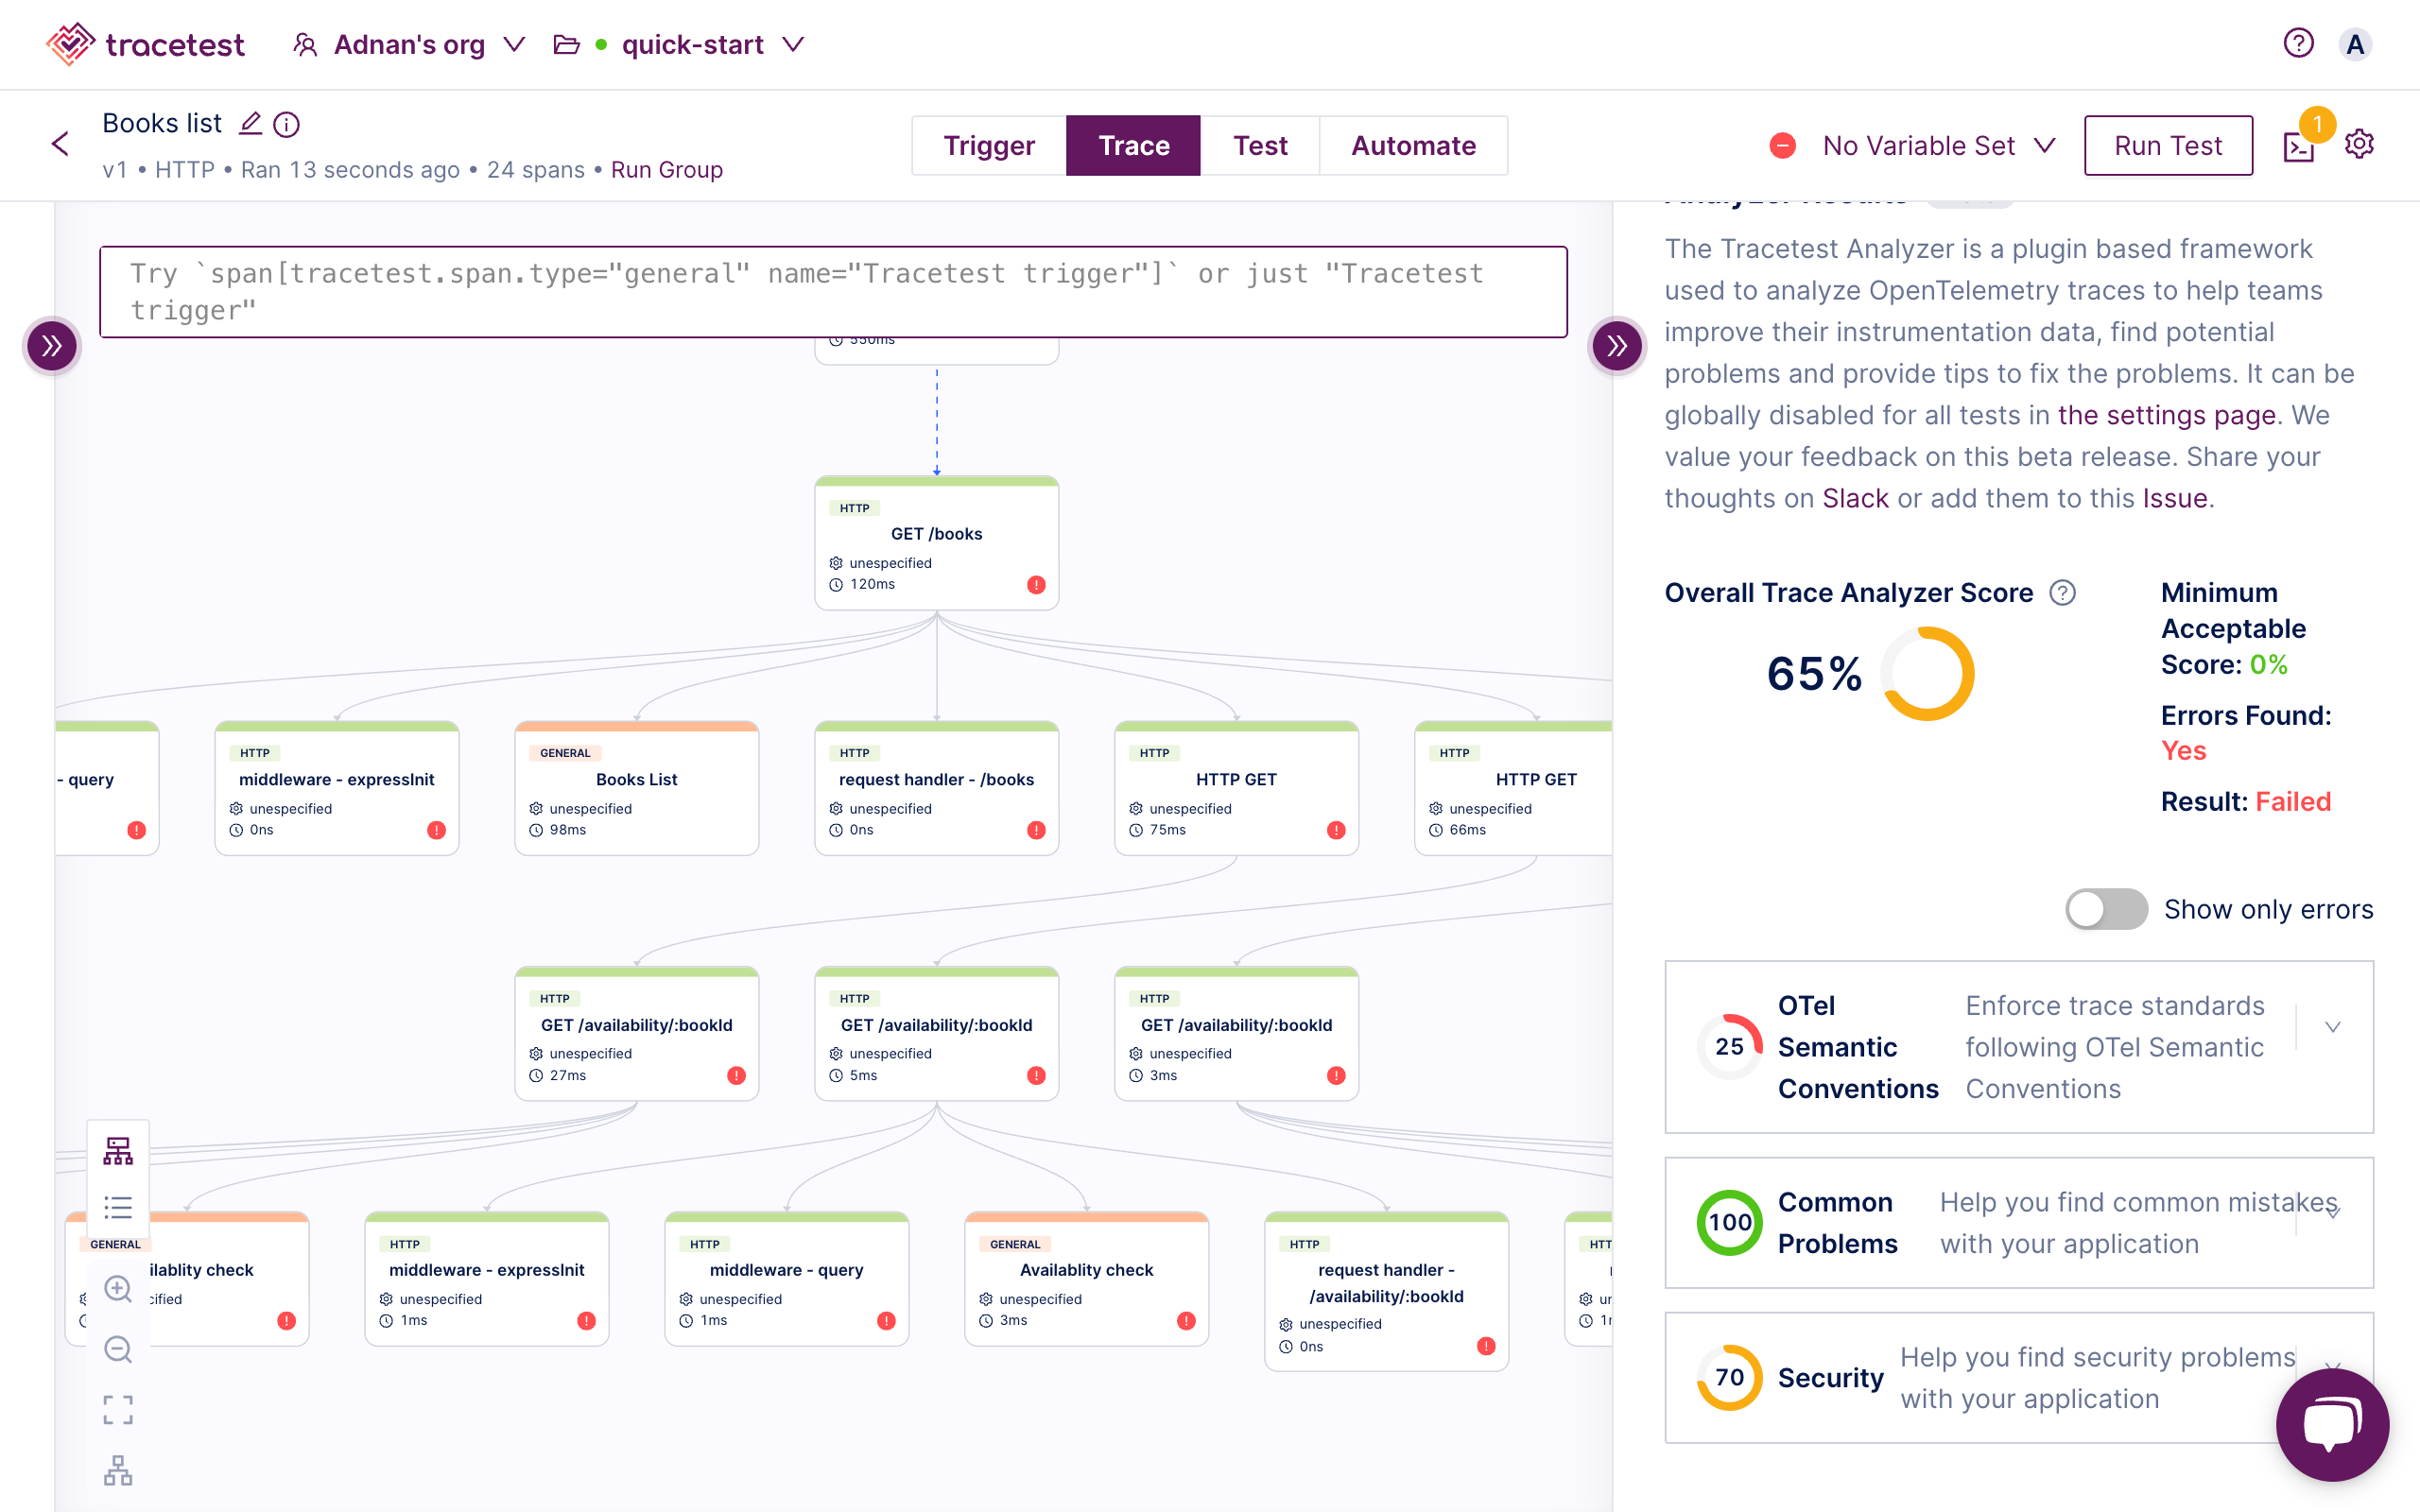
Check out this example in a code sample, [here on GitHub](https://github.com/kubeshop/tracetest/blob/main/examples/quick-start-nodejs-manual-instrumentation/tracing.otel.grpc.js). There’s a runnable sample app you can start with Docker Compose to see it for yourself. Here’s what the trace will look like without the noisy `fs` and `net` events.
> *For more info you can also refer to the [OpenTelemetry docs](https://opentelemetry.io/docs/zero-code/js/configuration/#excluding-instrumentation-libraries). It includes a section on excluding certain instrumentation libraries.*
## Key Takeaways
When using Node.js with OpenTelemetry auto instrumentation, you need to understand which auto instrumentations are most useful for your application. This might include HTTP events, database events, or other types of events that you need to make your app reliable.
You can enable specific instrumentations from environment variables, but also configure them programmatically. Other options you get by default include setting the OTLP endpoint, headers, and much more. See the list below.
```javascript
export OTEL_TRACES_EXPORTER="otlp"
export OTEL_EXPORTER_OTLP_PROTOCOL="http/protobuf"
export OTEL_EXPORTER_OTLP_COMPRESSION="gzip"
export OTEL_EXPORTER_OTLP_TRACES_ENDPOINT="https://your-endpoint"
export OTEL_EXPORTER_OTLP_HEADERS="x-api-key=your-api-key"
export OTEL_EXPORTER_OTLP_TRACES_HEADERS="x-api-key=your-api-key"
export OTEL_RESOURCE_ATTRIBUTES="service.namespace=my-namespace"
export OTEL_NODE_RESOURCE_DETECTORS="env,host,os,serviceinstance"
export OTEL_NODE_ENABLED_INSTRUMENTATIONS="http,express"
export OTEL_SERVICE_NAME="client"
export NODE_OPTIONS="--require @opentelemetry/auto-instrumentations-node/register"
node app.js
```
In conclusion, the Node.js OpenTelemetry auto instrumentation is a lifesaver and includes a lot of useful instrumentations by default. However, it’s up to you to customize the instrumentations to suit your application. By enabling only relevant instrumentations, you can reduce the noise in your tracing, making it easier to gain valuable insights.
Interested in proactively using traces instead of just reactively troubleshooting in production? Check out the Tracetest [docs](https://docs.tracetest.io/getting-started/installation) and give it a try by [signing up today](https://app.tracetest.io/). Tracetest enables you to add test observability to all your existing tests. It integrates with [Playwright](https://docs.tracetest.io/tools-and-integrations/playwright), [Cypress](https://docs.tracetest.io/tools-and-integrations/cypress), [k6](https://docs.tracetest.io/tools-and-integrations/k6), [Artillery](https://docs.tracetest.io/tools-and-integrations/artillery-plugin), and can run tests against [APIs (HTTP/gRPC)](https://docs.tracetest.io/examples-tutorials/recipes/running-tracetest-without-a-trace-data-store), [message queues like Kafka](https://docs.tracetest.io/examples-tutorials/recipes/testing-kafka-go-api-with-opentelemetry-tracetest), and much more!
Also, please feel free to join our [Slack Community](https://dub.sh/tracetest-community), give [Tracetest a star on GitHub](https://github.com/kubeshop/tracetest), or schedule a [time to chat 1:1](https://calendly.com/ken-kubeshop/45min).
.jpg)
.avif)
.avif)