Announcing the Tracetest integration with Lightstep


Today, we're happily announcing that Tracetest now works with Lightstep, the cloud-native reliability platform.
Table of Contents
Today, we're happily announcing that Tracetest now works with Lightstep, the cloud-native reliability platform.
> Check out [this hands-on OpenTelemetry Demo example](https://github.com/kubeshop/tracetest/tree/main/examples/tracetest-lightstep-otel-demo) how Tracetest works with Lightstep, or [check out the recipe in the docs](https://docs.tracetest.io/examples-tutorials/recipes/running-tracetest-with-lightstep)!
## What is Lightstep?
Lightstep is the cloud-native reliability platform. It provides monitoring and observability for the world’s most reliable systems. Lightstep provides unified observability at scale.
Lightstep was founded by pioneers in the OpenTelemetry community and is involved in actively maintaining and supporting the growth of OpenTelemetry. They co-founded OpenTelemetry (and OpenTracing) to give developers access to portable, vendor-neutral telemetry data.
With Lightstep, you can understand and resolve complex issues across any number of services, platforms, languages, or teams. Reveal hidden dependencies, including 3rd-party APIs and cloud services, and pinpoint exactly where, why, and how incidents occur.
## What is Tracetest?
Tracetest is an open-source CNCF project. It allows you to quickly build integration and end-to-end tests, powered by your OpenTelemetry traces.
Tracetest uses your existing OpenTelemetry traces to power trace-based testing with assertions against your trace data at every point of the request transaction. You only need to point Tracetest to your existing trace data source, or send traces to Tracetest directly!
We make it possible to:
* Define tests and assertions against every single microservice that a request goes through.
* Works with your existing distributed tracing solution, allowing you to build tests based on your already instrumented system.
* Define multiple transaction triggers, such as a GET against an API endpoint, a GRPC request, etc.
* Return both the response data and a full trace.
* Define assertions against both the response and trace data, ensuring both your response and the underlying processes worked correctly, quickly, and without errors.
* Save tests.
* Run the tests manually or via CI build jobs with the Tracetest CLI.
## Tracetest Now Works with Lightstep!
Tracetest now works with Lightstep, allowing you to have the power of Lightstep for your observability solution, and leverage your distributed traces to run trace-based tests with Tracetest.
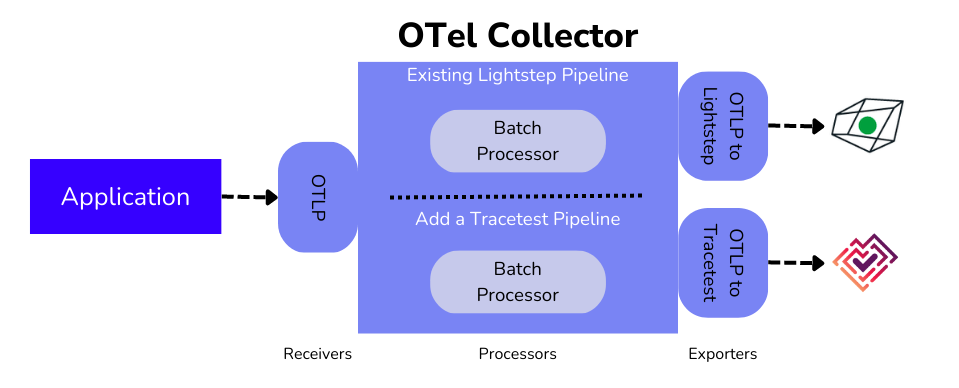
In your existing observability setup, you have OpenTelemetry instrumentation configured in your code with OpenTelemetry Collector and using Lightstep as a trace data store. Adding Tracetest to the infrastructure lets you write detailed trace-based tests using existing tracing infrastructure.
**Why is it important?**
When running integration tests, you have no way of knowing precisely at which point, in a network of microservices, an HTTP transaction goes wrong! With tracing enabled, Tracetest can run tests with assertions against existing trace data throughout every service in the entire transaction. You can utilize these tests as part of your CI/CD process to ensure system functionality, and to catch regressions.
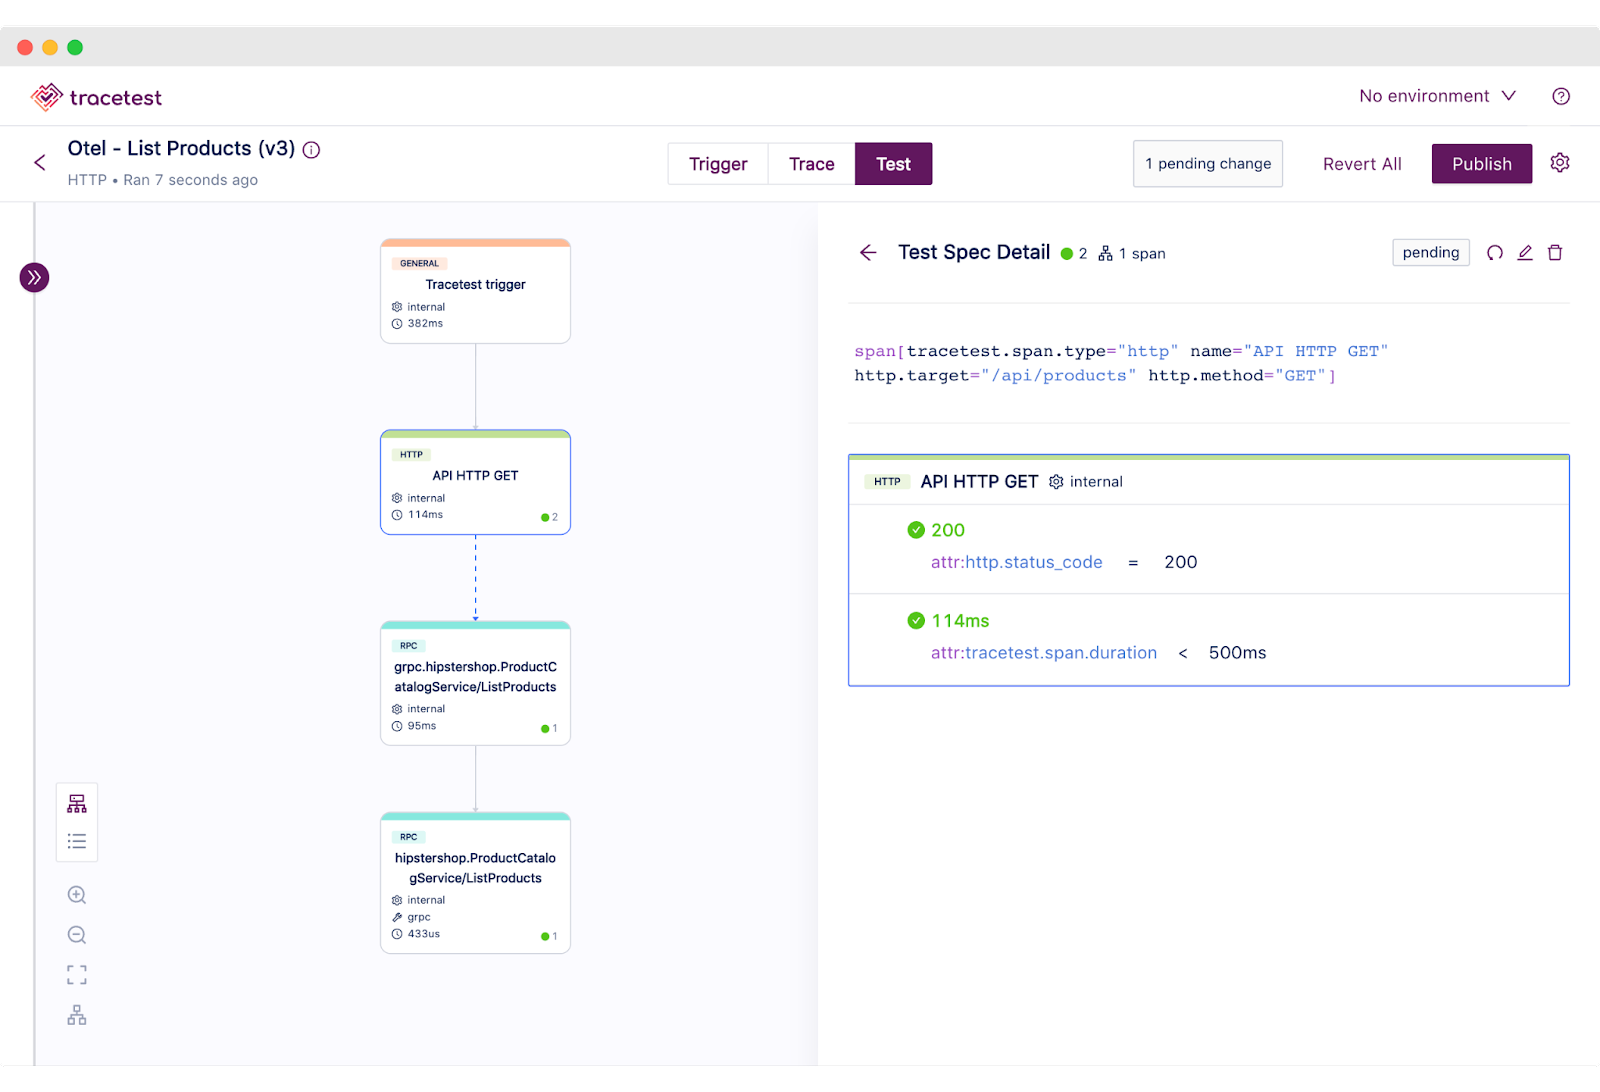
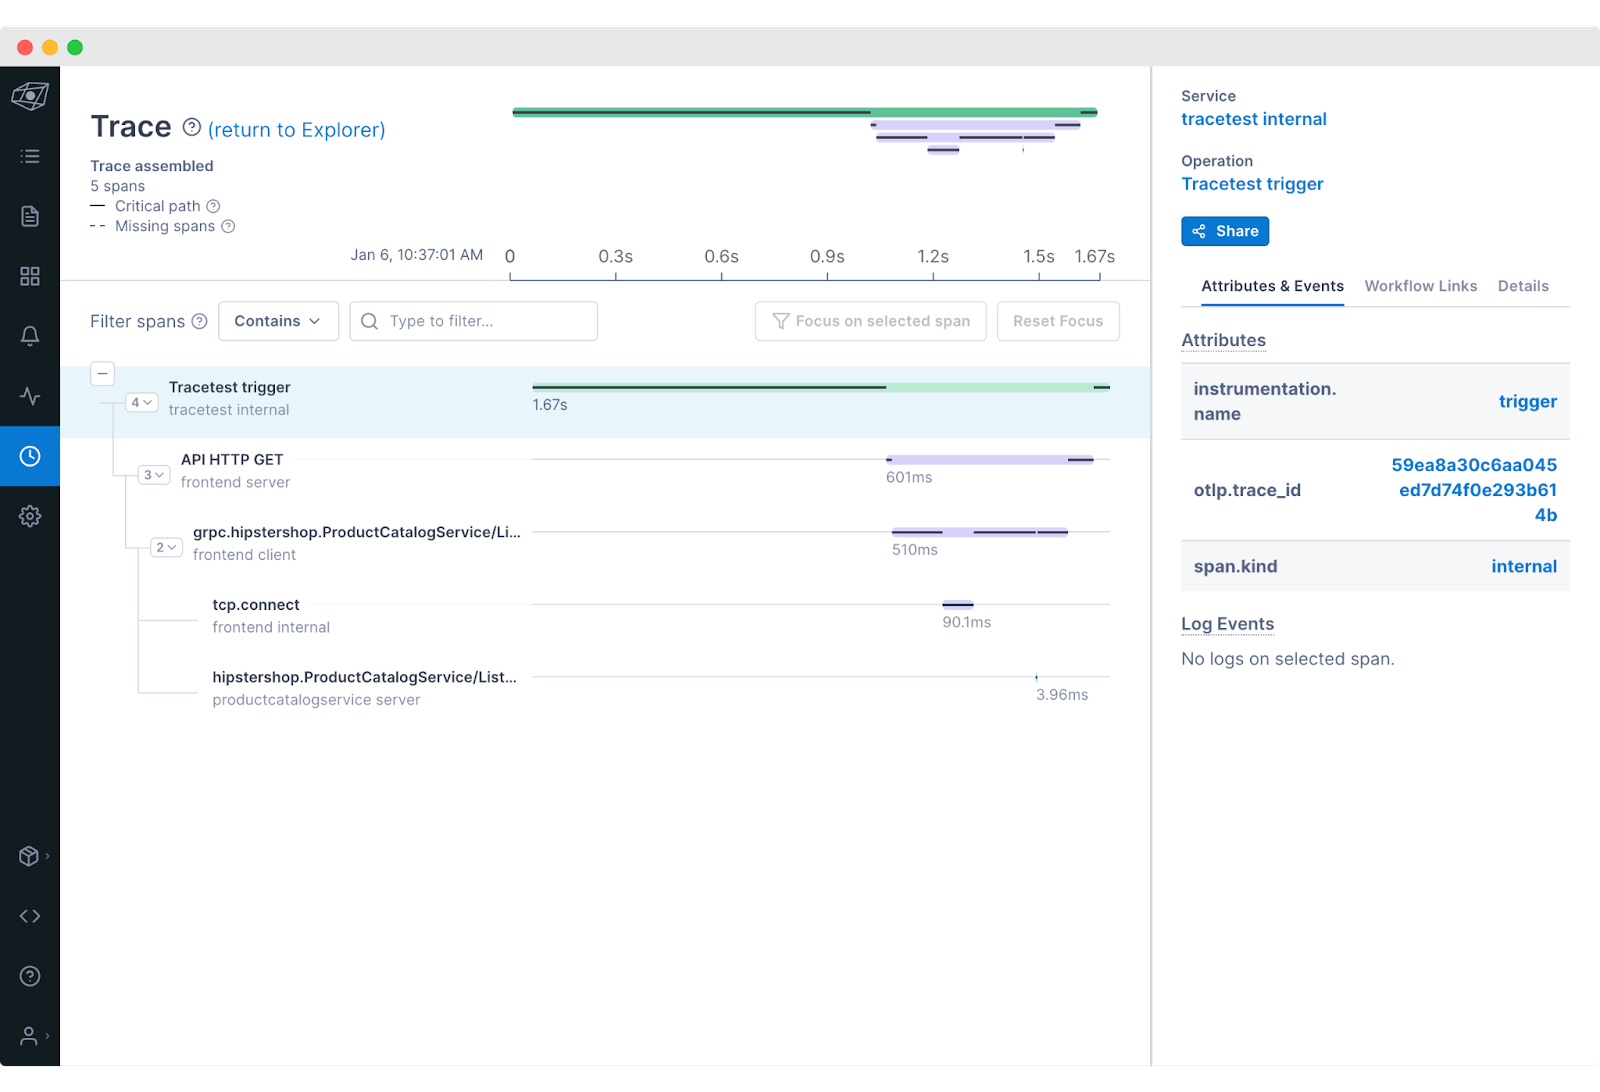
Combining the ability to create tests with Tracetest with the analytical power of Lightstep provides even more value to your testing process. Use Lightstep to view the test runs and the individual services involved over time. This provides you with a view into system performance, and shows you what changes to what systems have positively or negatively impacted performance.
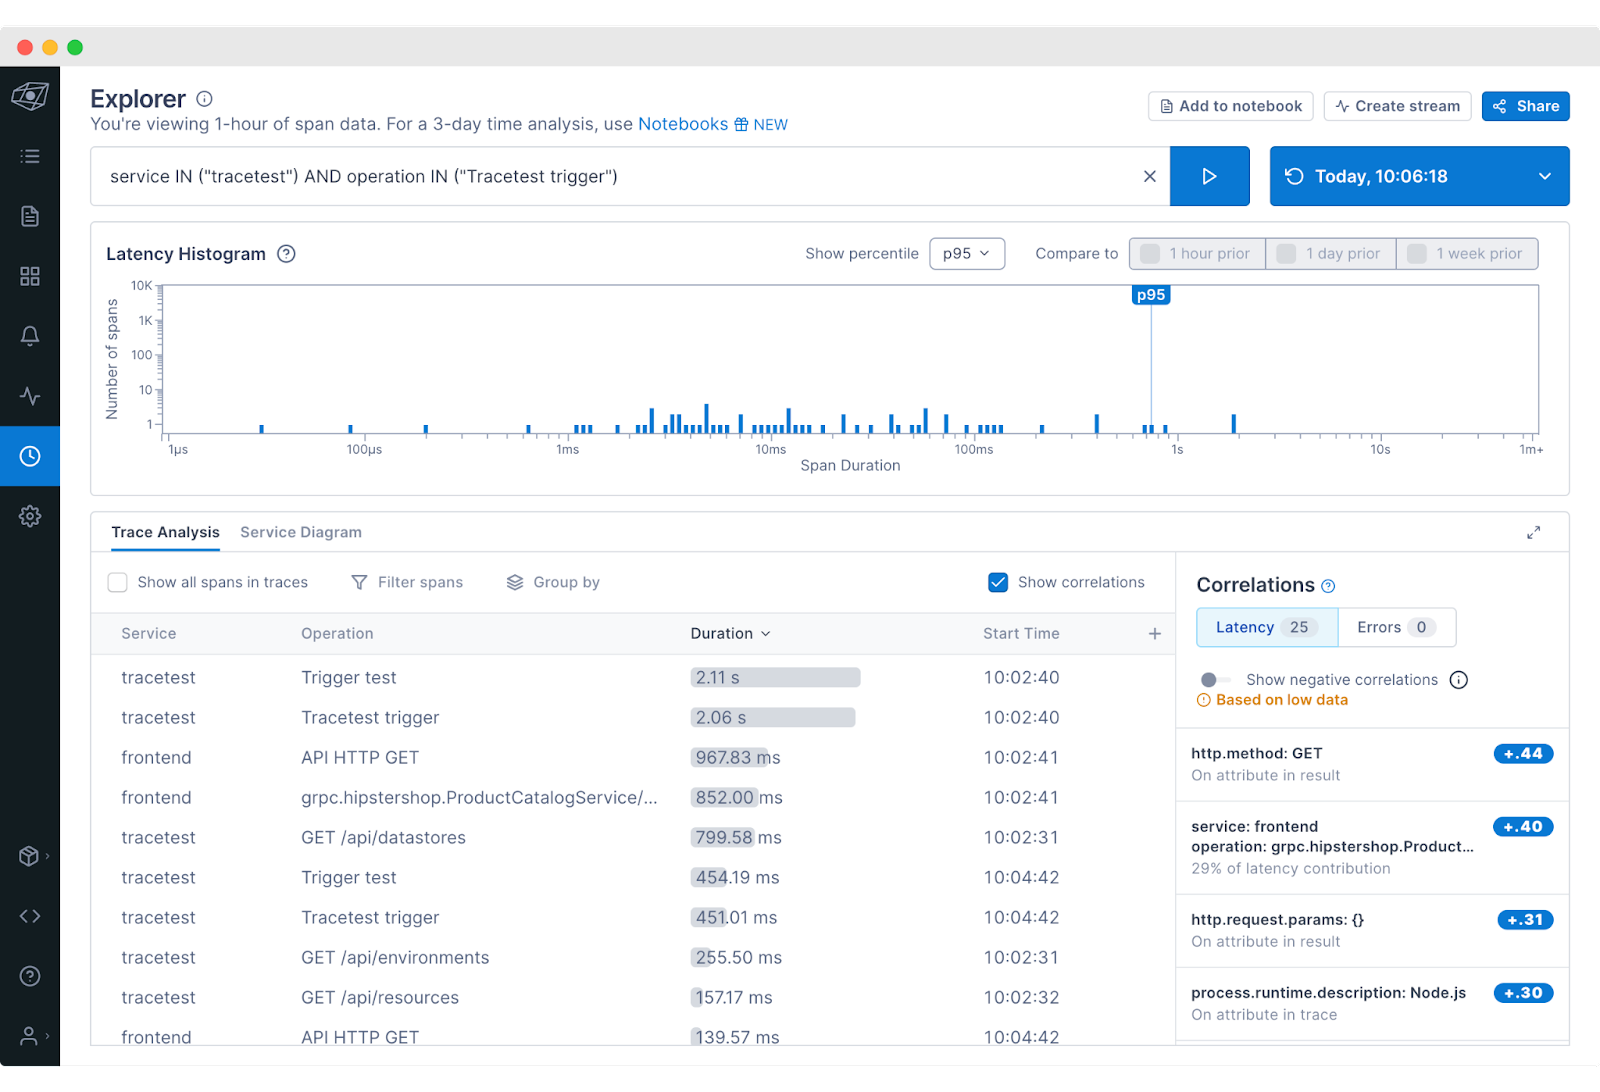
Issues noted when exploring the trace data via Lightstep are then identified as a good candidate for new tests or assertions within Tracetest, creating a cycle of continuous improvement.
## Try Tracetest with Lightstep
First, you need to have a Lightstep account. Create [your free account here](https://app.lightstep.com/signup/developer?signup_source=docs). Next, you need to have your distributed application instrumented with OpenTelemetry, and configured to [send trace data to Lightstep](https://docs.lightstep.com/otel/quick-start-instrumentation). For more on getting started with Lightstep and OpenTelemetry, check out [the official docs](https://docs.lightstep.com/otel/otel-quick-start). Once you have your system sending trace data to Lightstep, you are ready to set up Tracetest!
Tracetest is open-source and easy to install. Start by installing the Tracetest CLI:
```bash
brew install kubeshop/tracetest/tracetest
```
Note: Check out the [download page](https://tracetest.io/download) for more info.
From here, follow the [official documentation](https://docs.tracetest.io/getting-started/installation) to install the Tracetest server. Once the server is installed, open up Tracetest Web UI in the browser and follow the instructions for connecting the [OpenTelemetry Collector](https://opentelemetry.io/docs/collector/) with both Tracetest and Lightstep.
The [Collector](https://opentelemetry.io/docs/collector/) is the recommended way to send OpenTelemetry data to an observability back-end, including Lightstep. It is a highly-configurable binary that allows you to ingest, process, and export OpenTelemetry data.
Enabling the Tracetest/Lightstep integration is as simple as selecting Lightstep as your trace data store and adding dedicated pipelines that send traces to both Tracetest and Lightstep in your OpenTelemetry Collector configuration.
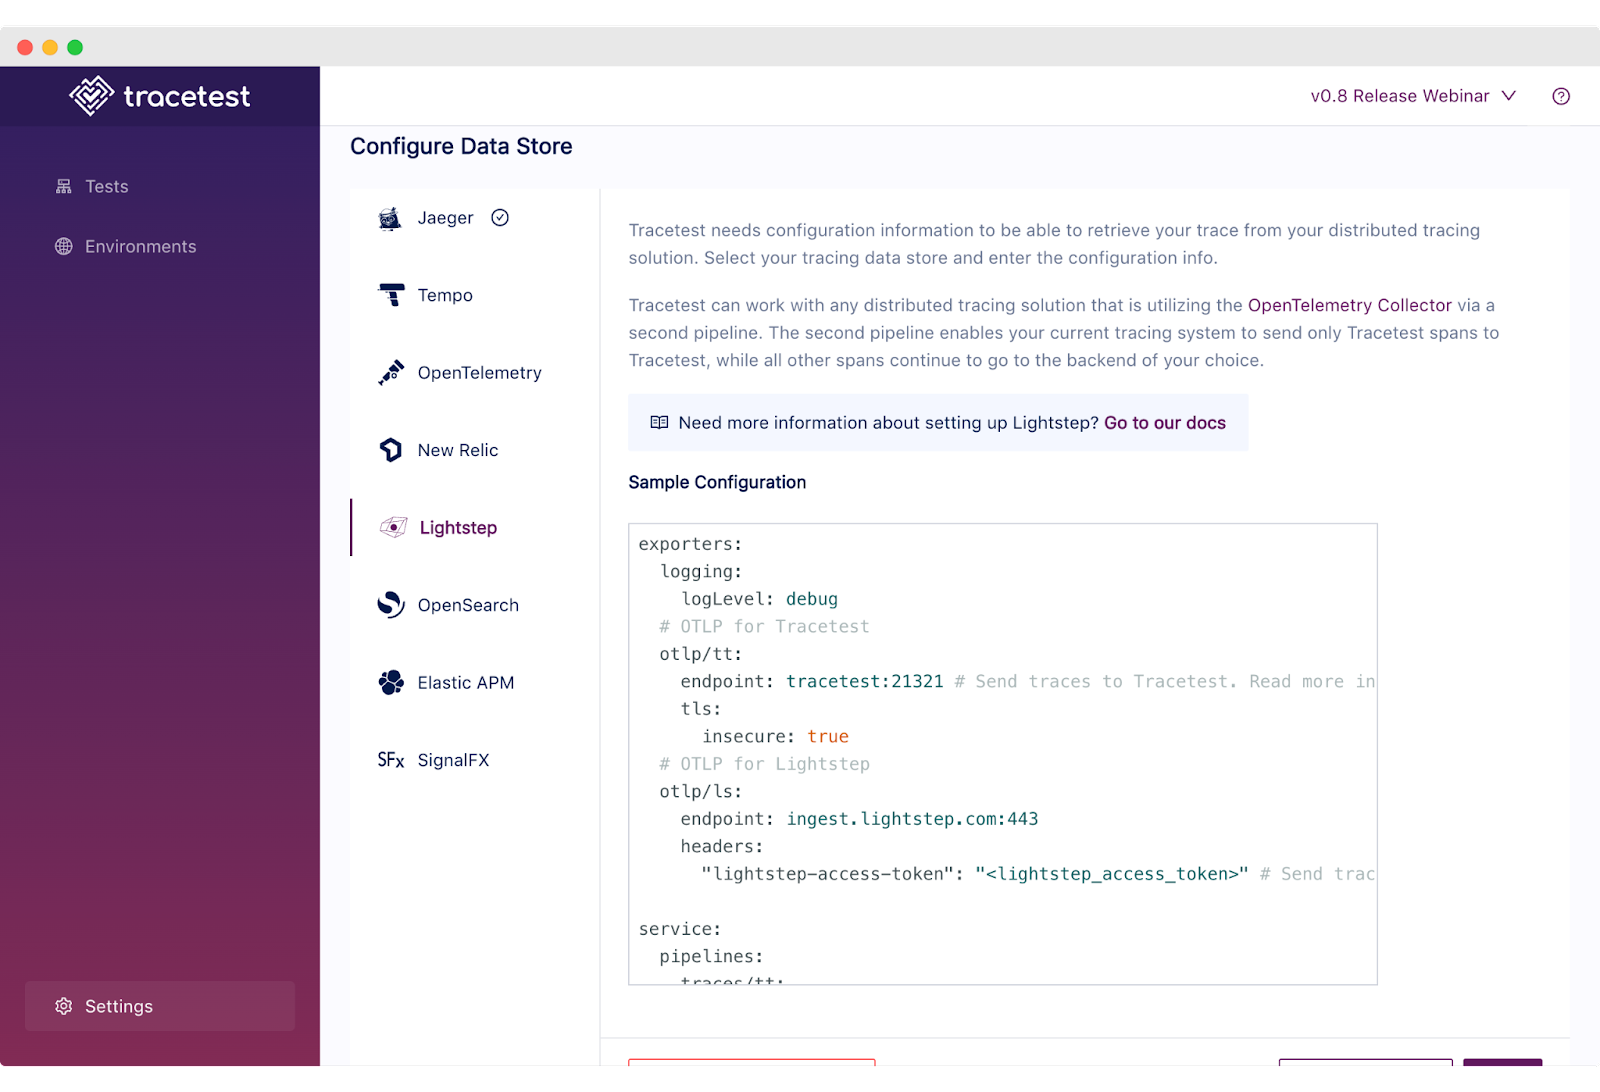
Copy this OpenTelemetry Collector configuration and paste it into your own configuration file.
```yaml
receivers:
otlp:
protocols:
grpc:
http:
processors:
batch:
timeout: 100ms
exporters:
logging:
logLevel: debug
# OTLP for Tracetest
otlp/tt:
endpoint: tracetest:21321
tls:
insecure: true
# OTLP for Lightstep
otlp/ls:
endpoint: ingest.lightstep.com:443
headers:
"lightstep-access-token": "<lightstep_access_token>"
service:
pipelines:
traces/tt:
receivers: [otlp]
processors: [batch]
exporters: [otlp/tt]
traces/ls:
receivers: [otlp]
processors: [batch]
exporters: [logging, otlp/ls]
```
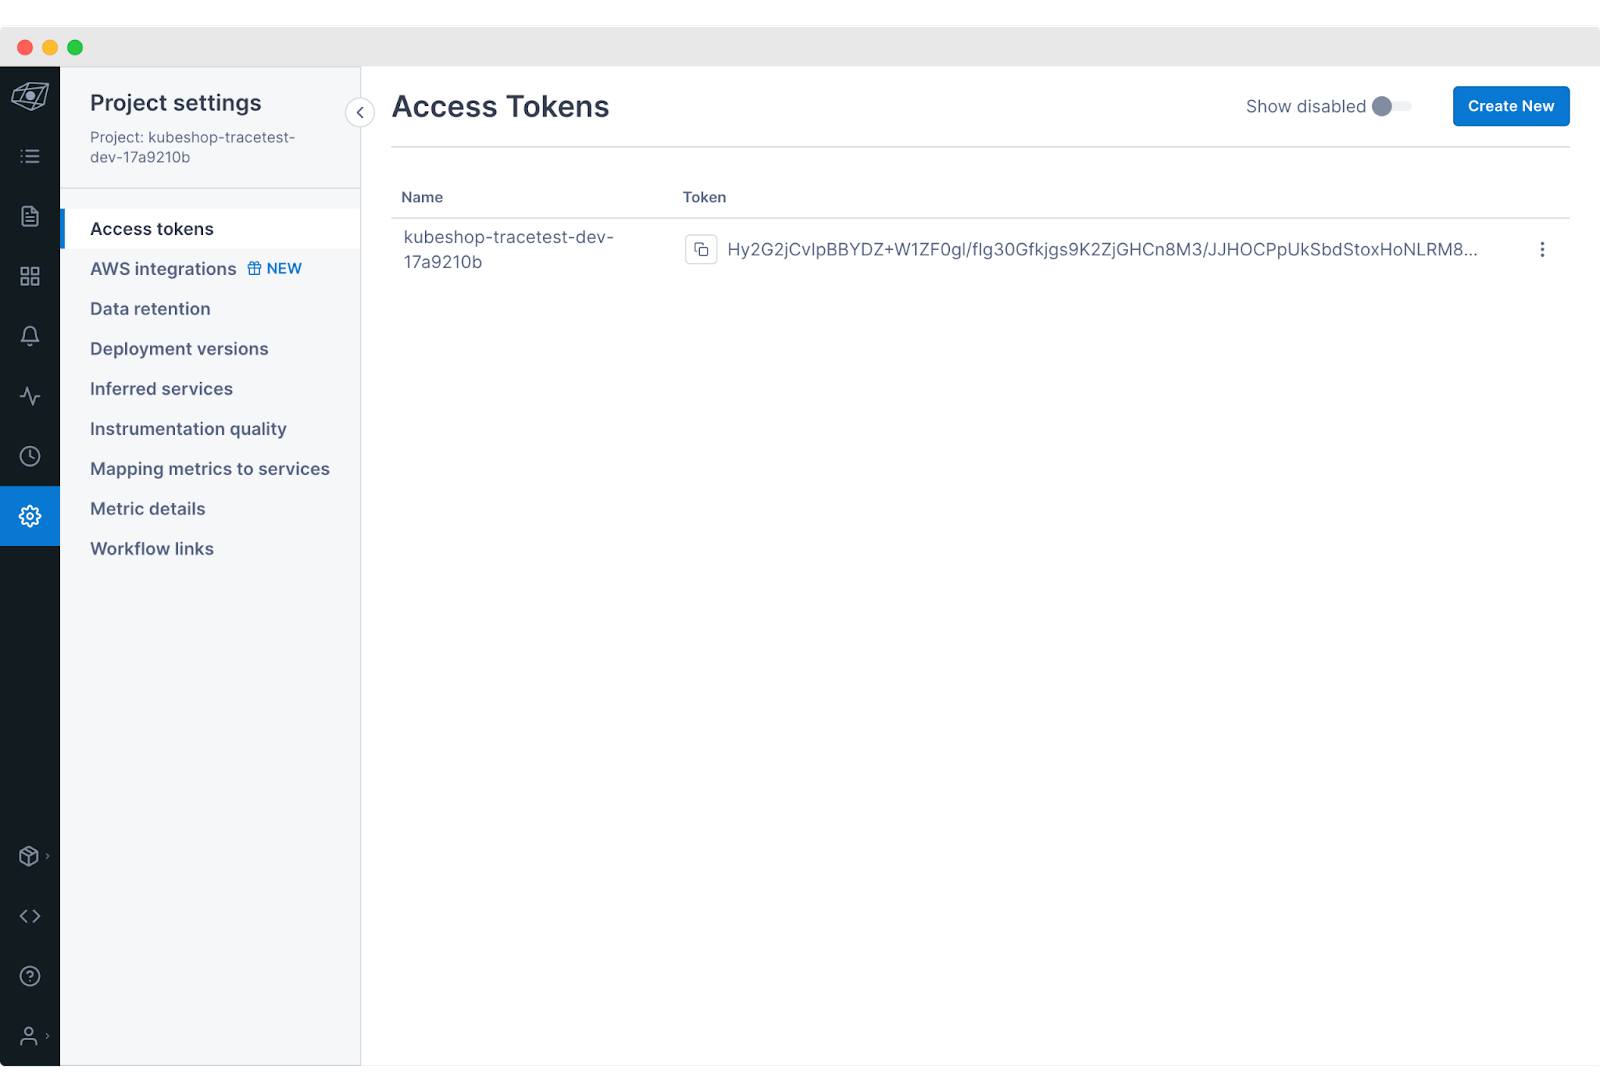
Next, edit the config to include your [Lightstep access token](https://docs.lightstep.com/docs/create-and-manage-access-tokens).
Please see the [official Lightstep docs](https://docs.lightstep.com/otel/quick-start-collector) for more info on how to configure Lightstep to send data to the OpenTelemetry Collector.
## What's next?
Would you like to learn more about Tracetest and what it brings to the table? Check the [docs](https://docs.tracetest.io/examples-tutorials/recipes/running-tracetest-with-lightstep/) and try it out today by [downloading](https://tracetest.io/download) it today!
Also, please feel free to join our [Slack community](https://dub.sh/tracetest-community), give [Tracetest a star on GitHub](https://github.com/kubeshop/tracetest), or schedule a [time to chat 1:1](https://calendly.com/ken-kubeshop/tracetest-demo).


.jpg)
.avif)
.avif)