
Tracetest + Elastic: Trace-based testing meets APM


Tracetest now integrates with Elastic Observability Application Performance Monitoring to provide both testing & monitoring of your cloud native application.
Table of Contents
Want to run trace-based tests with Elastic APM? Today is your lucky day. We're happy to announce that Tracetest now integrates with Elastic Observability APM.
Check out this [hands-on example](https://github.com/kubeshop/tracetest/tree/main/examples/tracetest-elasticapm-with-elastic-agent) of how Tracetest works with Elastic Observability APM and OpenTelemetry.
[Tracetest](https://tracetest.io/) is a [CNCF](https://www.cncf.io/) project aiming to provide a solution for deep integration and system testing by leveraging the rich data in distributed system traces. In this blog, we intend to provide an introduction to Tracetest and its capabilities, including how it can be integrated with [Elastic Application Performance Monitoring](https://www.elastic.co/observability/application-performance-monitoring) and [OpenTelemetry](https://opentelemetry.io/) to enhance the testing process.
## Your good friend distributed tracing
Distributed tracing is a way to understand how a distributed system works by tracking the flow of requests through the system. It can be used for a variety of purposes, such as identifying and fixing performance issues, figuring out what went wrong when an error occurs, and making sure that the system is running smoothly. Here are a few examples of how distributed tracing can be used:
- Monitoring performance: Distributed tracing can help you keep an eye on how your distributed system is performing by showing you what's happening in real-time. This can help you spot and fix problems like bottlenecks or slow response times that can make the system less reliable.
- Finding the source of problems: When something goes wrong, distributed tracing can help you figure out what happened by showing you the sequence of events that led up to the problem. This can help you pinpoint the specific service or component that's causing the issue and fix it.
- Debugging: Distributed tracing can help you find and fix bugs by giving you detailed information about what's happening in the system. This can help you understand why certain requests are behaving in unexpected ways and how to fix them.
- Security: Distributed tracing can help you keep an eye on security by showing you who is making requests to the system, where they are coming from and what services are being accessed.
- Optimisation: Distributed tracing can help you optimise the performance of the system by providing insight into how requests are flowing through the system, which can help you identify areas that can be made more efficient and reduce the number of requests that need to be handled.
## Distributed tracing. Now also for testing.
Observability, previously only used in operations, is now being applied in other areas of development, such as testing. This shift has led to the emergence of ["Observability-driven development"](https://www.infoq.com/articles/observability-driven-development/) and "trace-based testing" as new methods for using distributed tracing to test distributed applications. Instead of just checking that certain parts of the code are working, trace-driven testing follows the path that a request takes as it goes through the system. This way, you can make sure that the entire system is working properly and that the right output is produced for a given input. By using distributed tracing, developers can record what happens during the test and then use that information to check that everything is working as it should. This method of testing can help to find problems that may be hard to detect with other types of testing and can better validate that the new code is working as expected. Additionally, distributed tracing provides information about what is happening during the test, such as how long it takes for a request to be processed and which services are being used, which can help developers understand how the code behaves in a real-world scenario.
## Enters Tracetest
[Tracetest](https://tracetest.io/) is a CNCF project that can run tests by verifying new traces against previously created assertions against other traces captured from the real systems. This way, you can make sure that the entire system is working properly and that the right output is produced for a given input. Here's how you can use Tracetest:
- Capture the baseline good known trace. This will be the golden standard that you will write your tests and assertions. Trace-driven development is a better way to test how different parts of the system work together because it allows developers to test the entire process from start to finish, making sure that everything is working as it should and giving a more complete view of how the system is functioning instead of trying to create disjointed assertions validating the request execution.
- Now you can start validating your code changes against good known behaviour captured previously.
- Tracetest can validate the resulting traces from the test and see if the system is working as it should. This can help you find problems that traditional testing methods might not catch.
- Create reports: Tracetest can also create reports that summarise the results of the test so that you can share the information with your team.
- Help you validate in production that the new requests follow the known path and run the predefined assertions against them.
The APM tool in Kibana, which is a familiar UI for many developers, can provide extra information when used with Tracetest. The APM tool can show you how the system is performing during the test and help you find issues using the familiar user interface. For example, the APM tool can show you how requests are moving through the system, how long requests take to be processed, and which parts of the system are being used. This information can help you identify and fix problems during testing. Furthermore, the APM tool can be set to show you all the data in real-time, which allows you to monitor the system's behaviour during the test or even in production and helps you make sense of what Tracetest is showing.
## How Tracetest works with Elastic APM to test the application
The components work together to provide a complete solution for testing distributed systems. The telemetry captured by the OpenTelemetry agent is sent to the Elastic APM Server, which processes and formats the data for indexing in Elasticsearch. The data can then be queried and analysed using Kibana APM UI, and Tracetest can be used to conduct deep integration and system tests by utilising the rich data contained in the distributed system trace.
For more details on Elastic's support for OpenTelelemetry please check out [https://www.elastic.co/blog/opentelemetry-observability](https://www.elastic.co/blog/opentelemetry-observability)
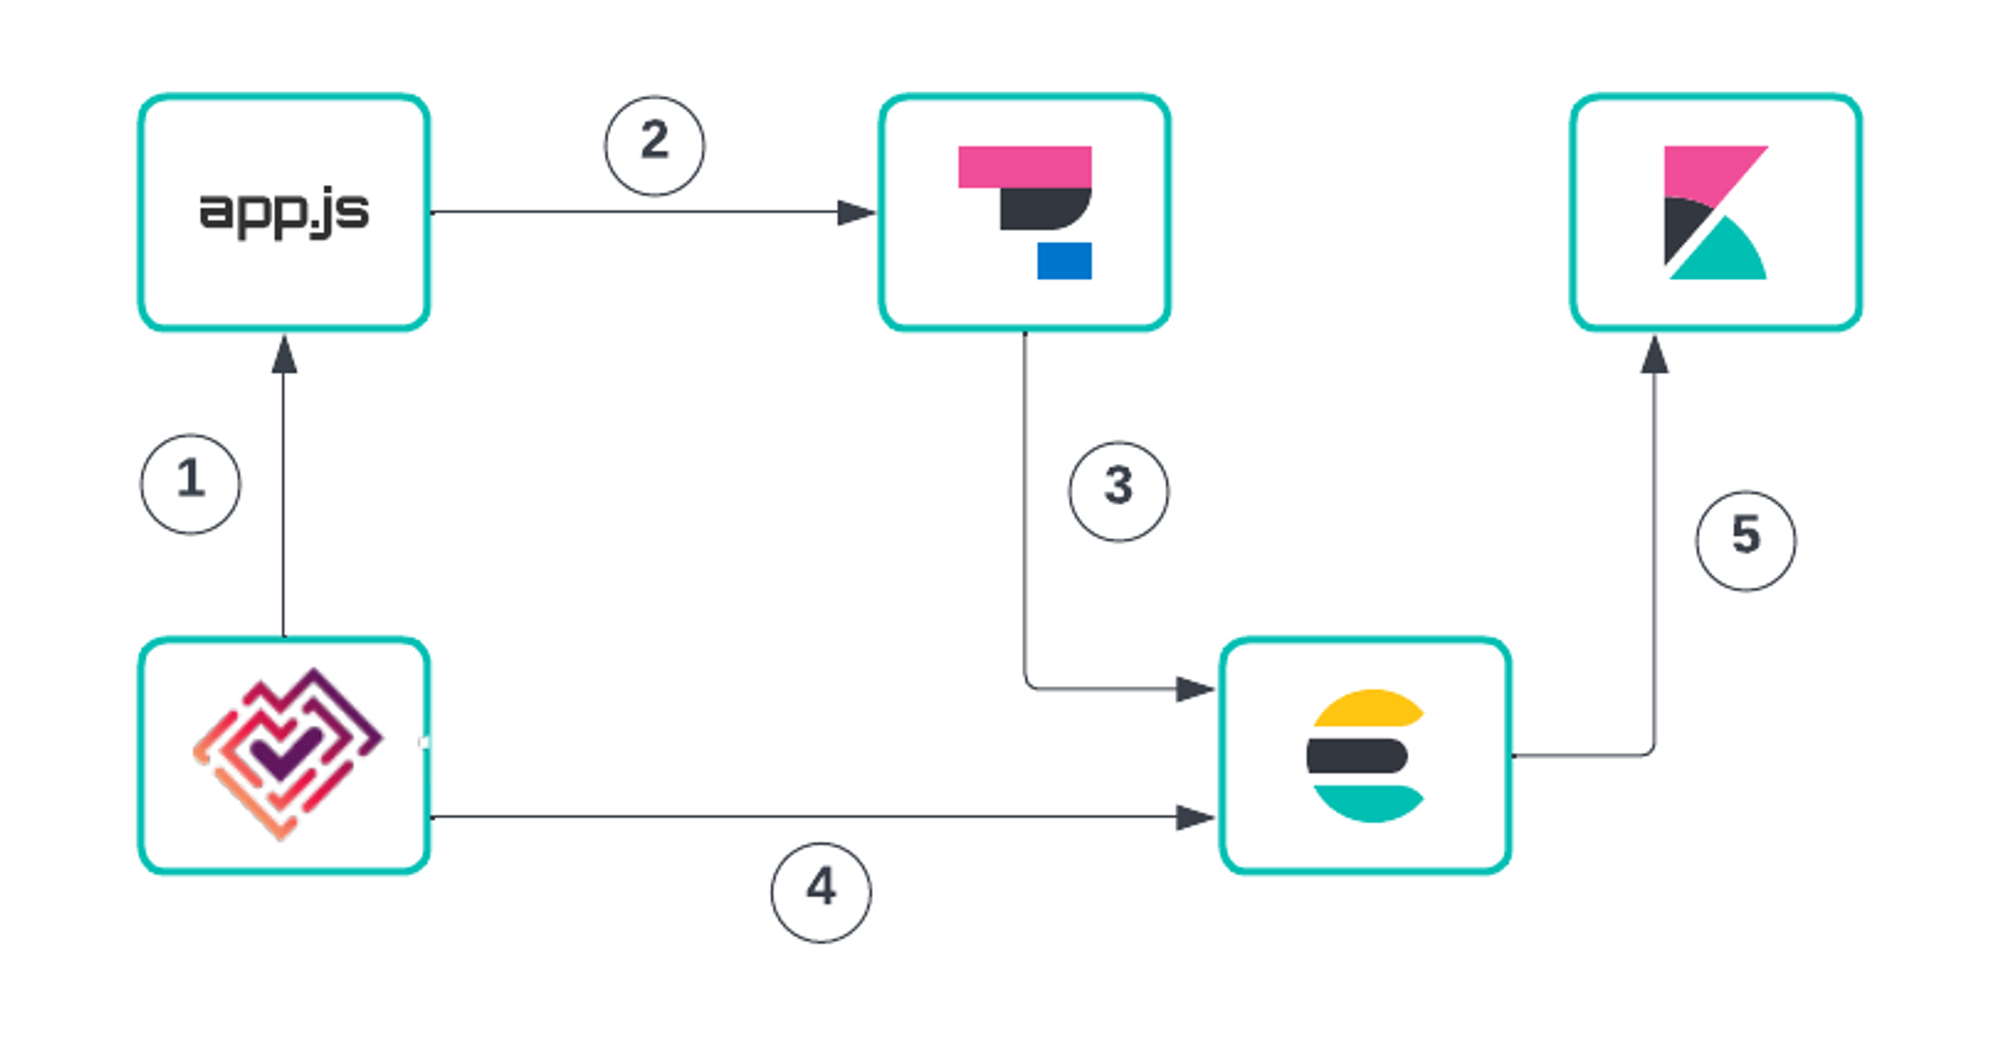
1. Tracetest initiates the test by sending a request to the application under test.
2. The application processes the request and the built-in OpenTelemetry agent captures the telemetry data of the request. This data includes information such as request and response payloads, request and response headers, and any errors that occurred during the request processing. The agent then sends the captured telemetry data to the Elastic APM Server.
3. Elastic APM server consumes OpenTelemetry or Elastic APM spans and sends the data to be stored and indexed in Elasticsearch.
4. Tracetest polls Elasticsearch to retrieve the captured trace data. It makes use of Elasticsearch query to fetch the trace data. Tracetest compares the received trace data with the expected trace data and runs the assertions. This step is used to check whether the data received from the application matches the expected data and to check for any errors or issues that may have occurred during the request processing. Based on the results of the comparison, Tracetest will report any errors or issues found and will provide detailed information about the root cause of the problem. If the test passes, Tracetest will report that the test passed, and the test execution process will be completed.
5. The trace data is visible and can be analysed in Kibana APM UI as well.
## Running your first Tracetest environment with Elastic APM and Docker compose
In your existing observability setup, you have the [OpenTelemetry Nodejs agent](https://opentelemetry.io/docs/instrumentation/js/getting-started/nodejs/) configured in your code and [sending OpenTelemetry traces to the Elastic APM server that then stores](https://www.elastic.co/blog/opentelemetry-observability) them in Elasticsearch. Adding Tracetest to the infrastructure lets you write detailed trace-based tests based on the existing tracing infrastructure. Tracetest runs tests against endpoints and uses trace data to run assertions.
The example that we are going to run is from the Tracetest Github repository. It contains a docker-compose setup, which is a convenient way to run multiple services together in a defined environment. The example includes a sample application that has been instrumented with an OpenTelemetry agent. The example also includes the Tracetest server with its Postgres database, which is responsible for invoking the test, polling Elasticsearch to retrieve the captured trace data, comparing the received trace data with the expected trace data and running the assertions. Finally, the example includes the Elastic stack which includes Elasticsearch, Kibana and the Elastic APM server.
To quickly access the example you can run the following:
```bash
git clone https://github.com/kubeshop/tracetest.git
cd tracetest/examples/tracetest-elasticapm-with-otel
docker-compose up -d
```
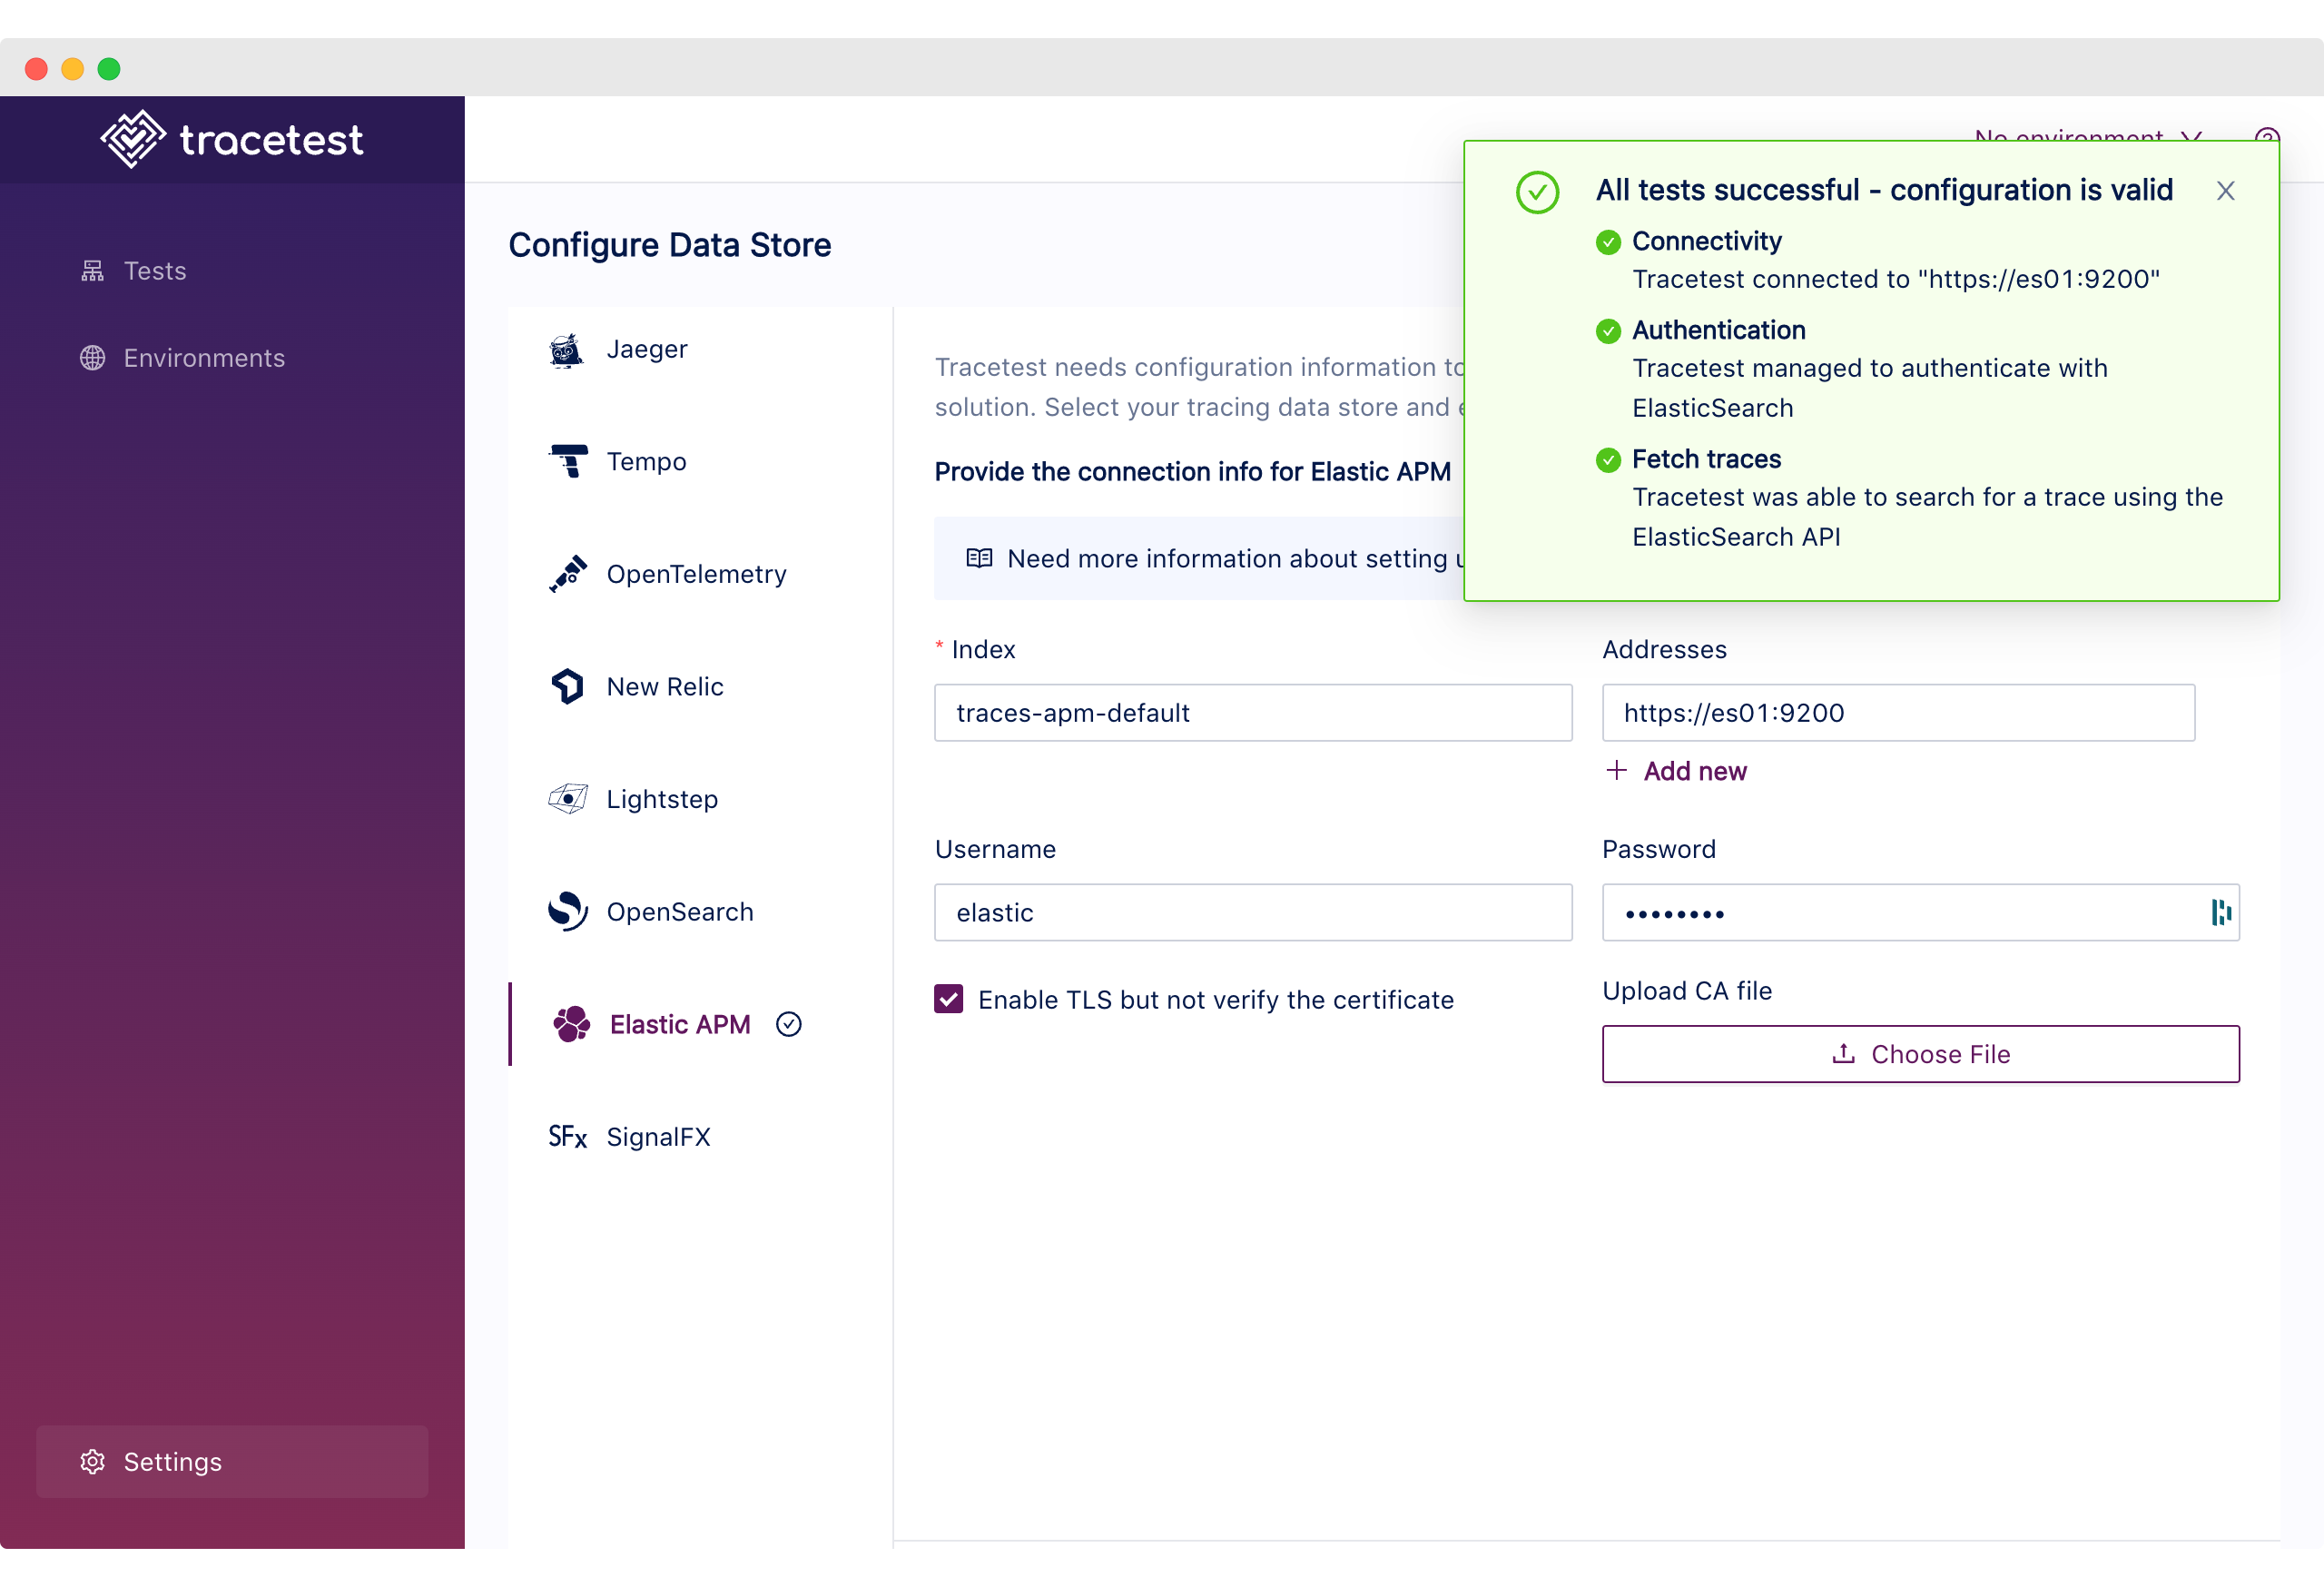
Once you have Tracetest set up, open `http://localhost:11633` in your browser to check out the Web UI.
Navigate to the Settings menu and ensure the connection to Elasticsearch is working by pressing Test Connection:
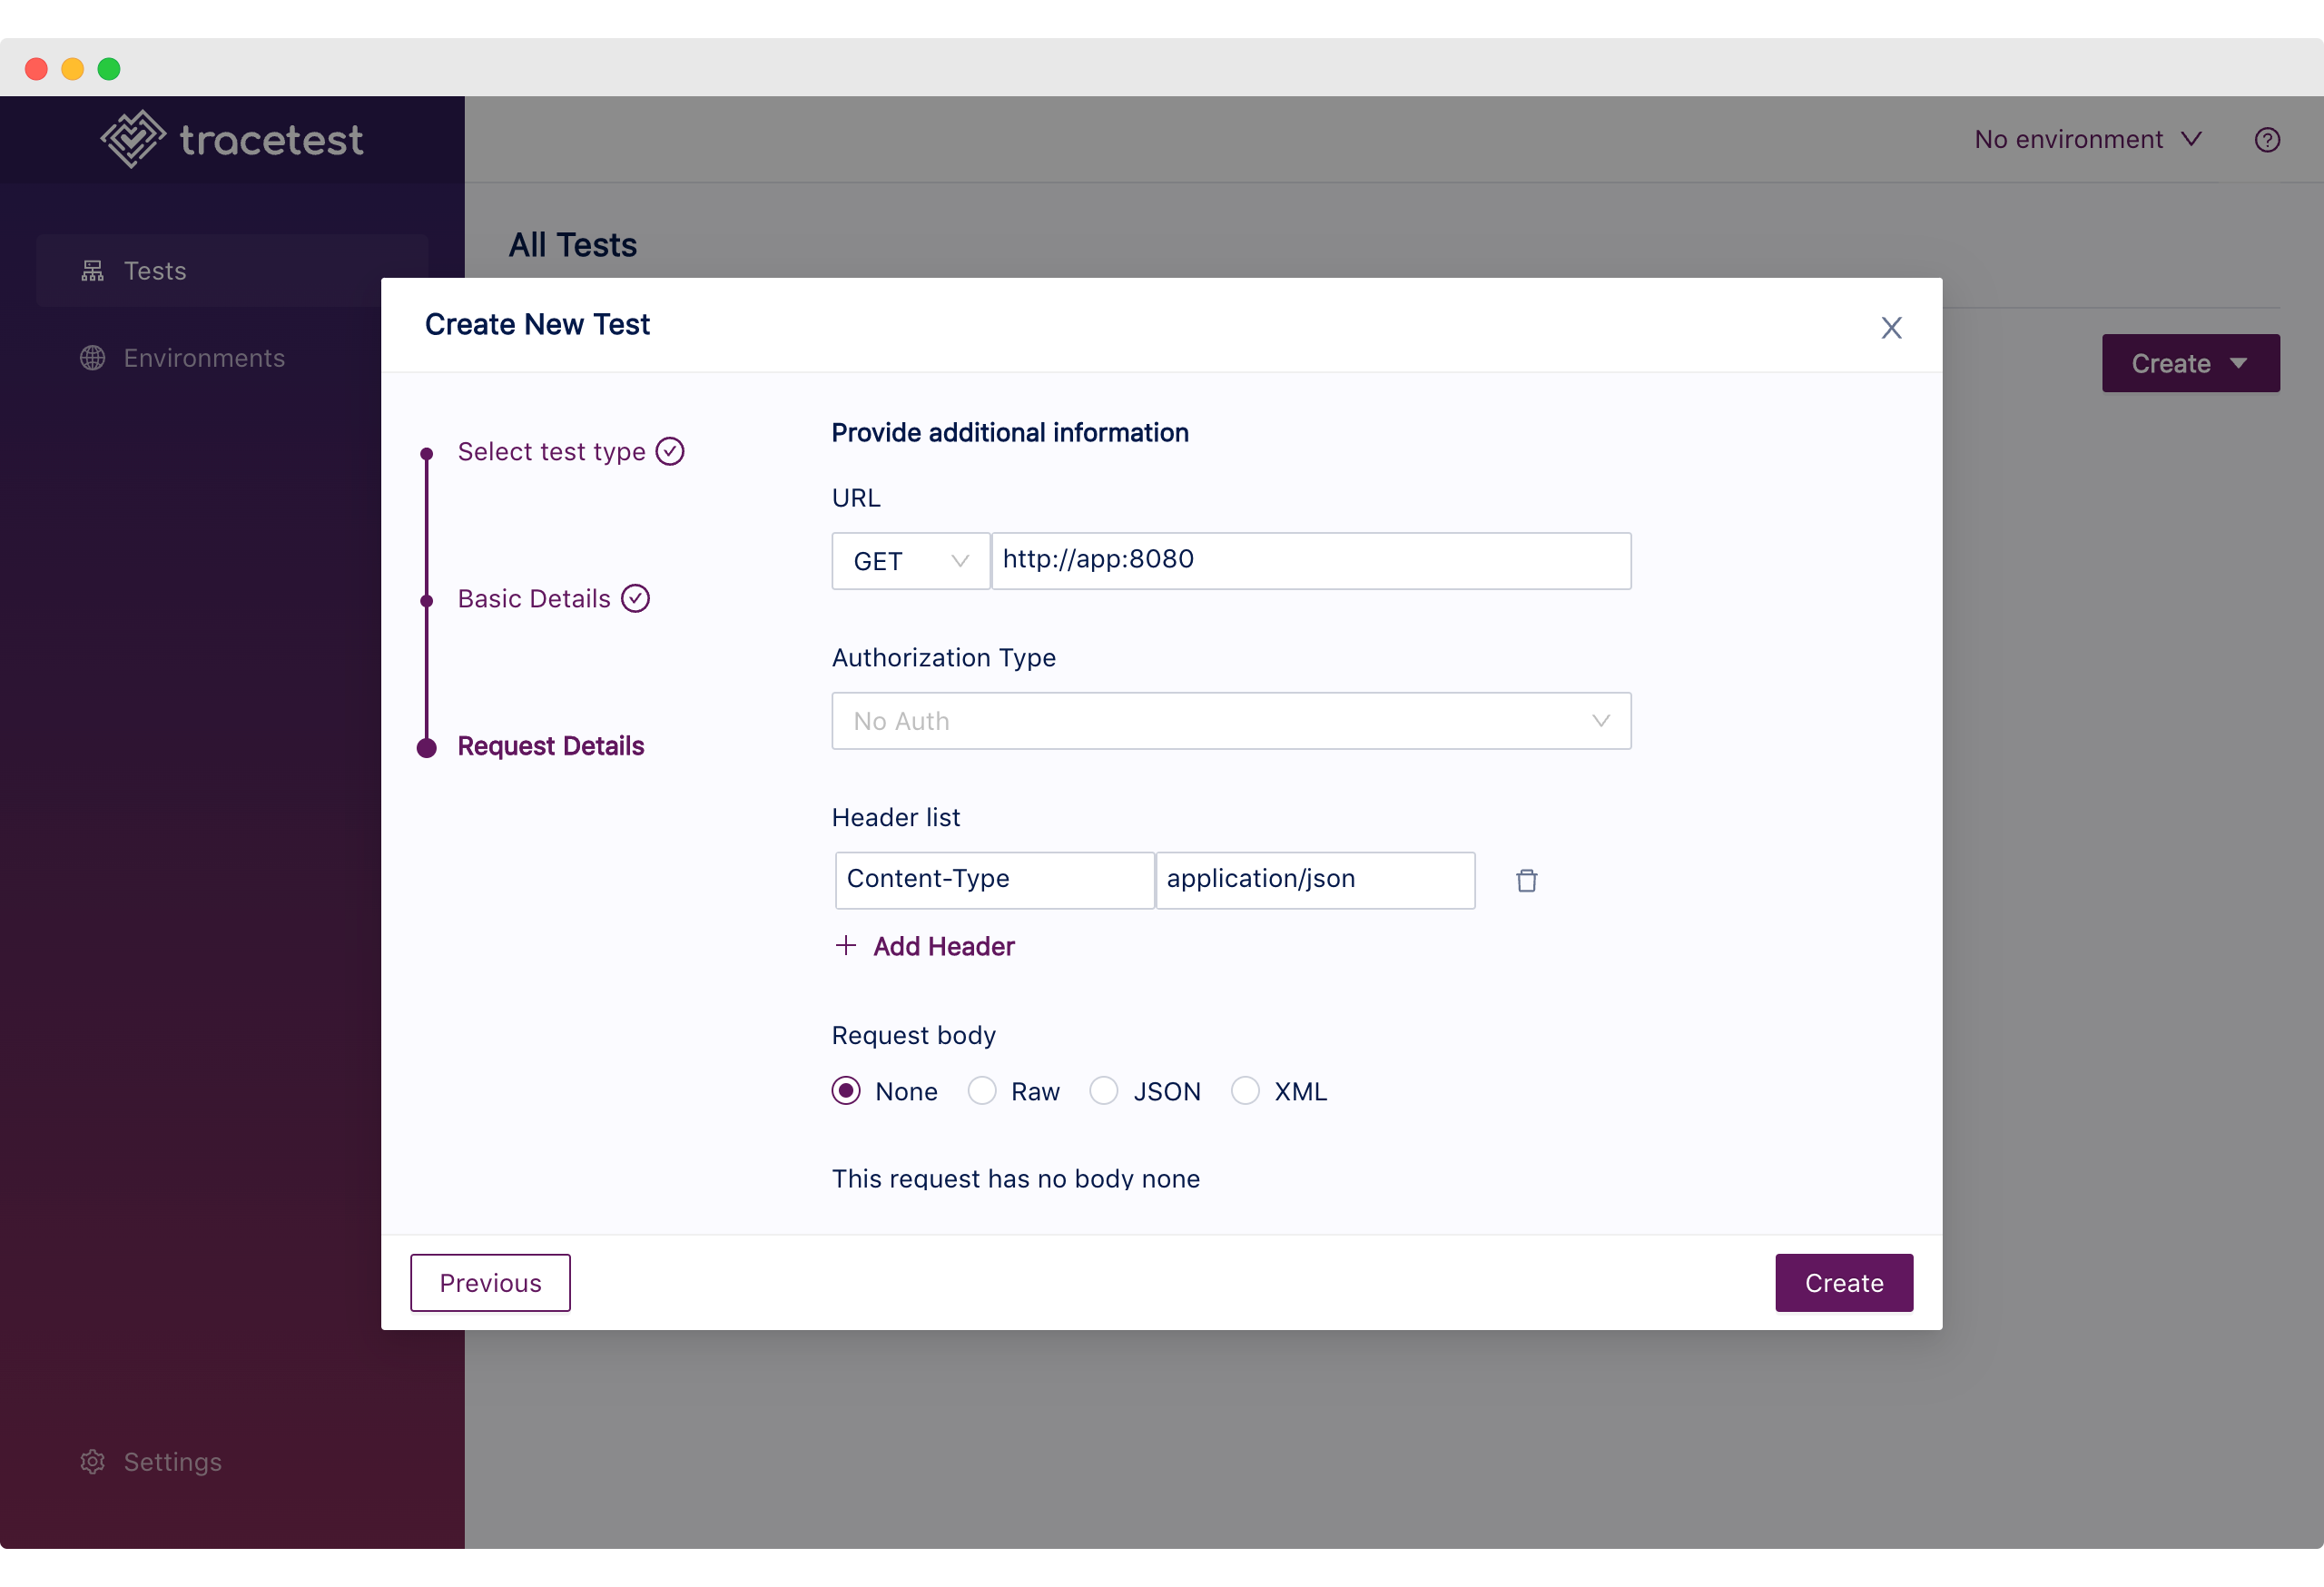
To create a test, click the Create dropdown and choose Create New Test. Select the HTTP Request and give it a name and description.

For this simple example, GET the Node.js app, which runs at `http://app:8080`.
With the test created, you can click the Trace tab to see the distributed trace. It’s simple, but you can start to see how it delivers immediate visibility into every transaction your HTTP request generates.
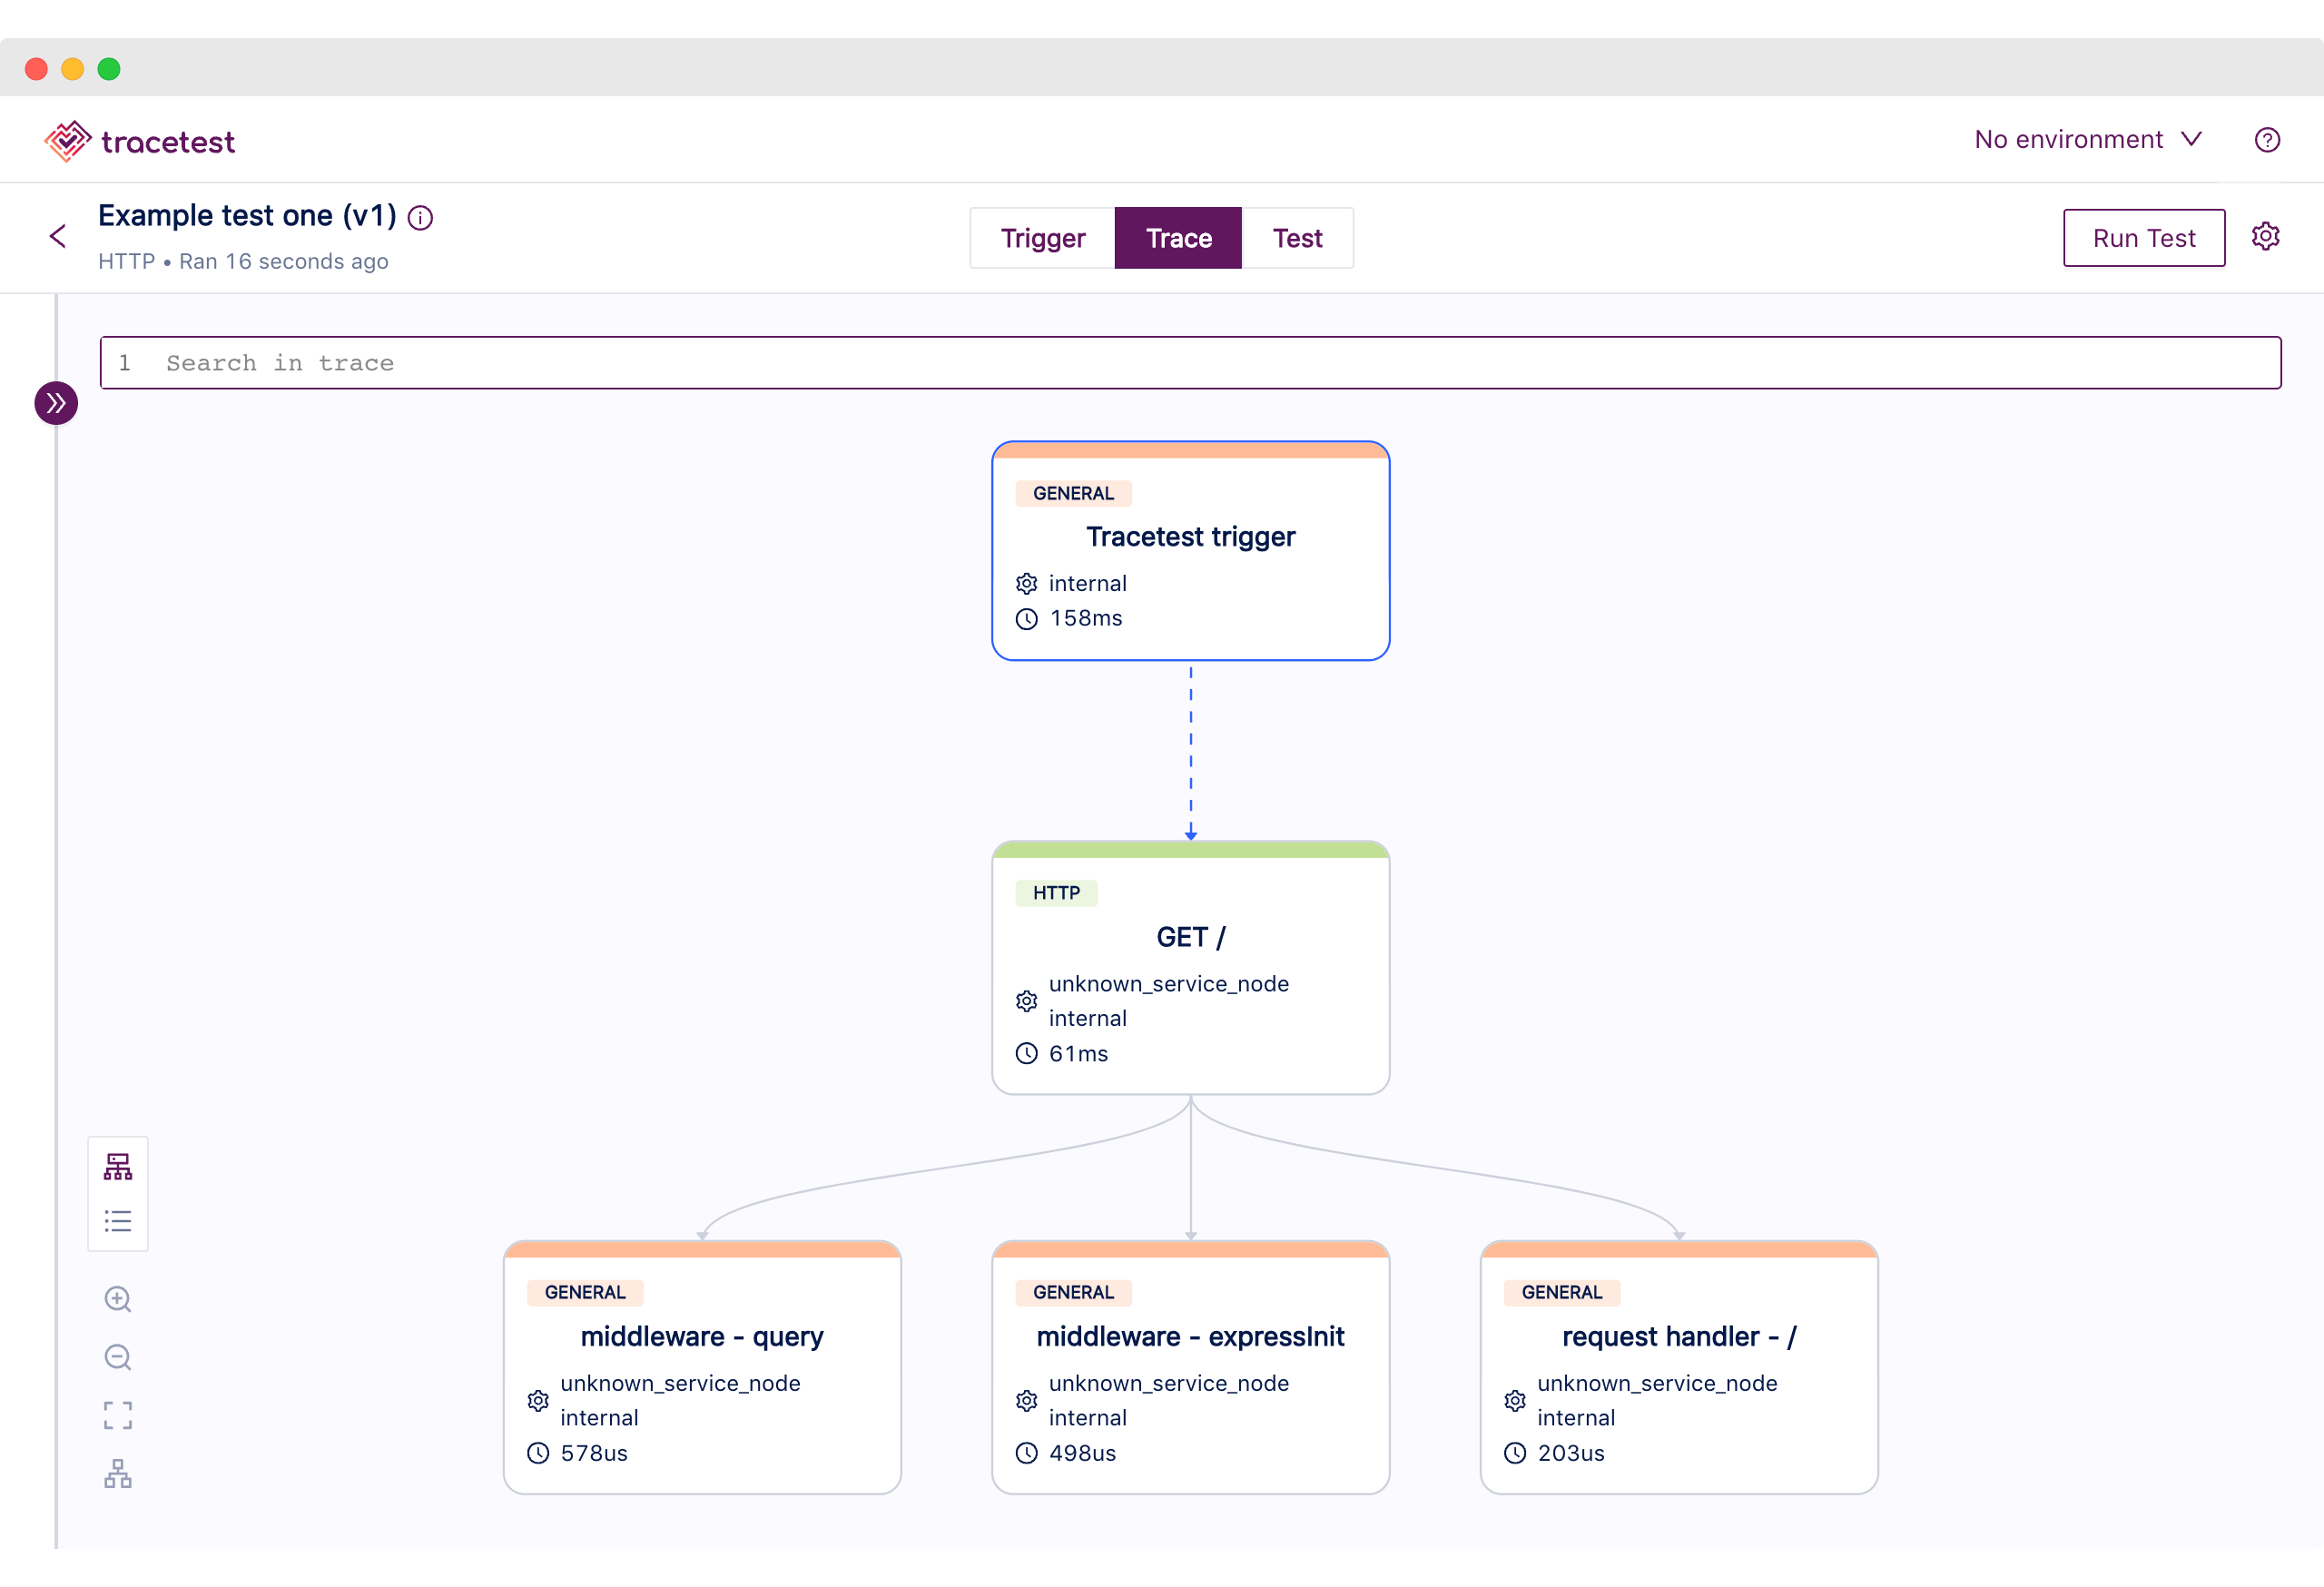
From here, you can continue by adding assertions.
To make an assertion based on the `GET /` span of our trace, select that span in the graph view and click **Current span** in the Test Spec modal. Or, copy this span selector directly, using the [Tracetest Selector Language](https://docs.tracetest.io/concepts/selectors/):
```bash
span[tracetest.span.type="http" name="GET /" http.target="/" http.method="GET"]
```
Below, add the `attr:http.status_code` attribute and the expected value, which is `200`. You can add more complex assertions as well, like testing whether the span executes in less than 500ms. Add a new assertion for `attr:http.status_code`, choose `<` and add `500ms` as the expected value.
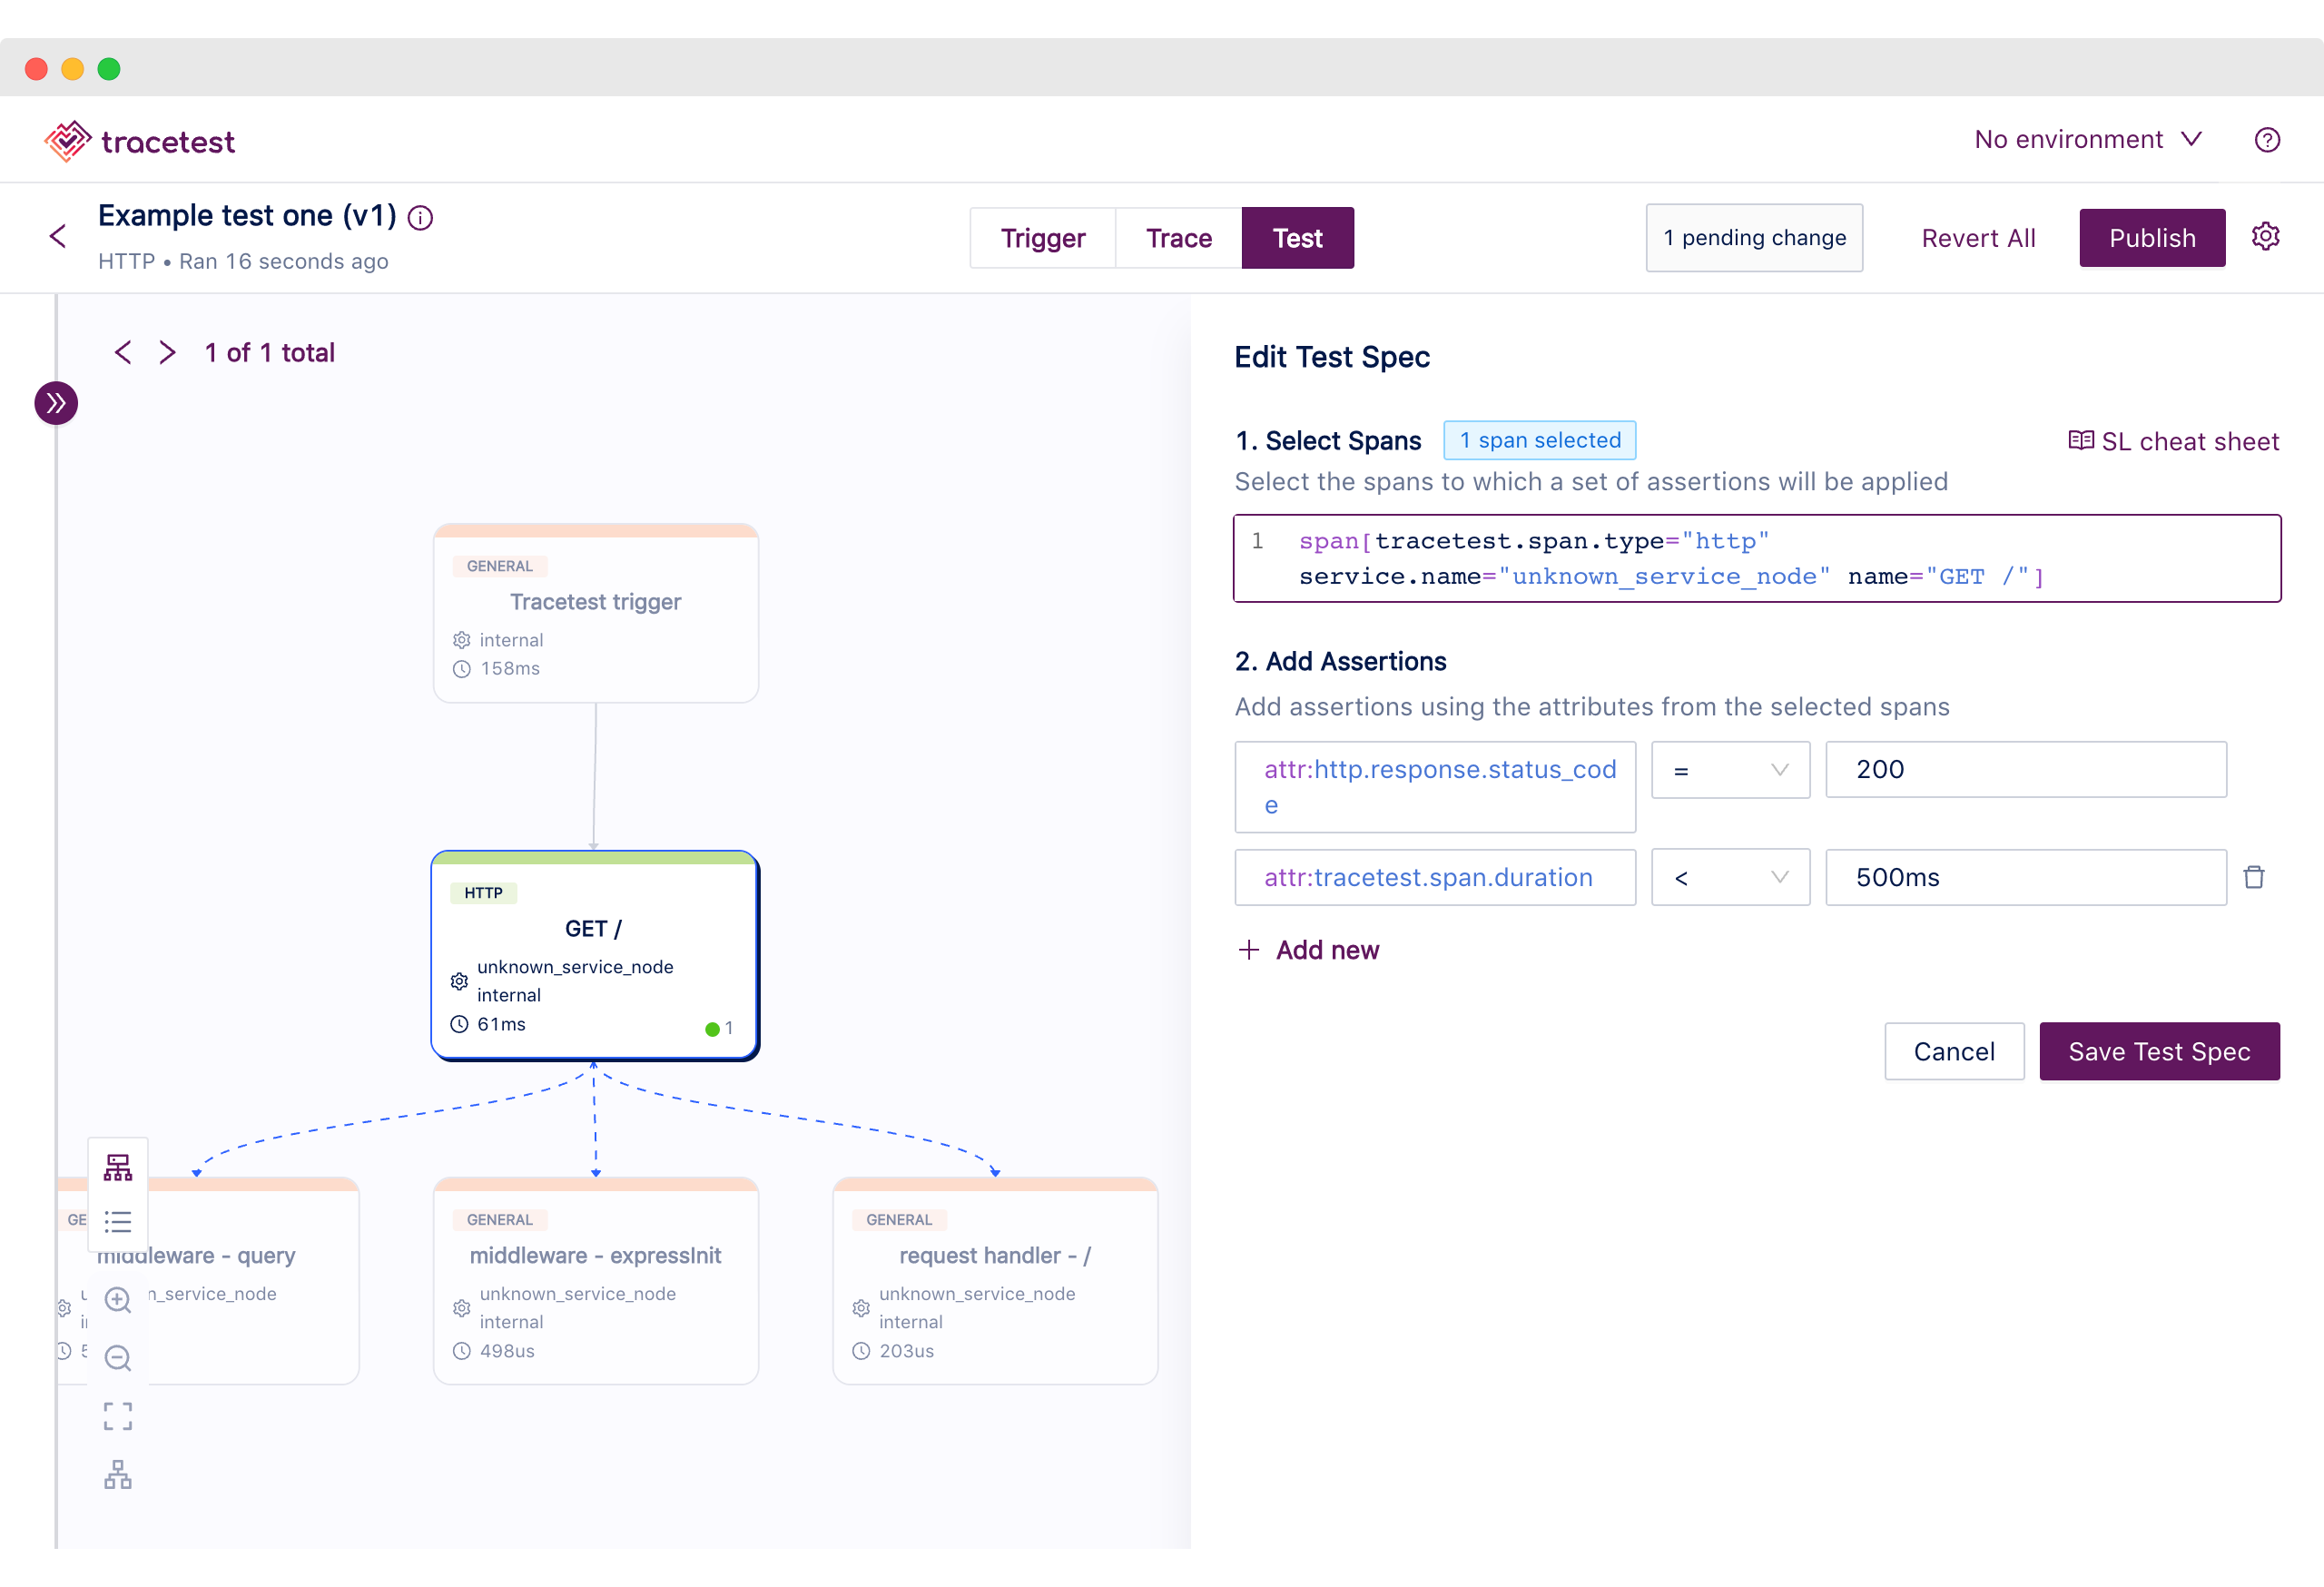
You can check against other properties, return statuses, timing, and much more, but we’ll keep it simple for now.
Then click **Save Test Spec**, followed by **Publish**, and you’ve created your first assertion.
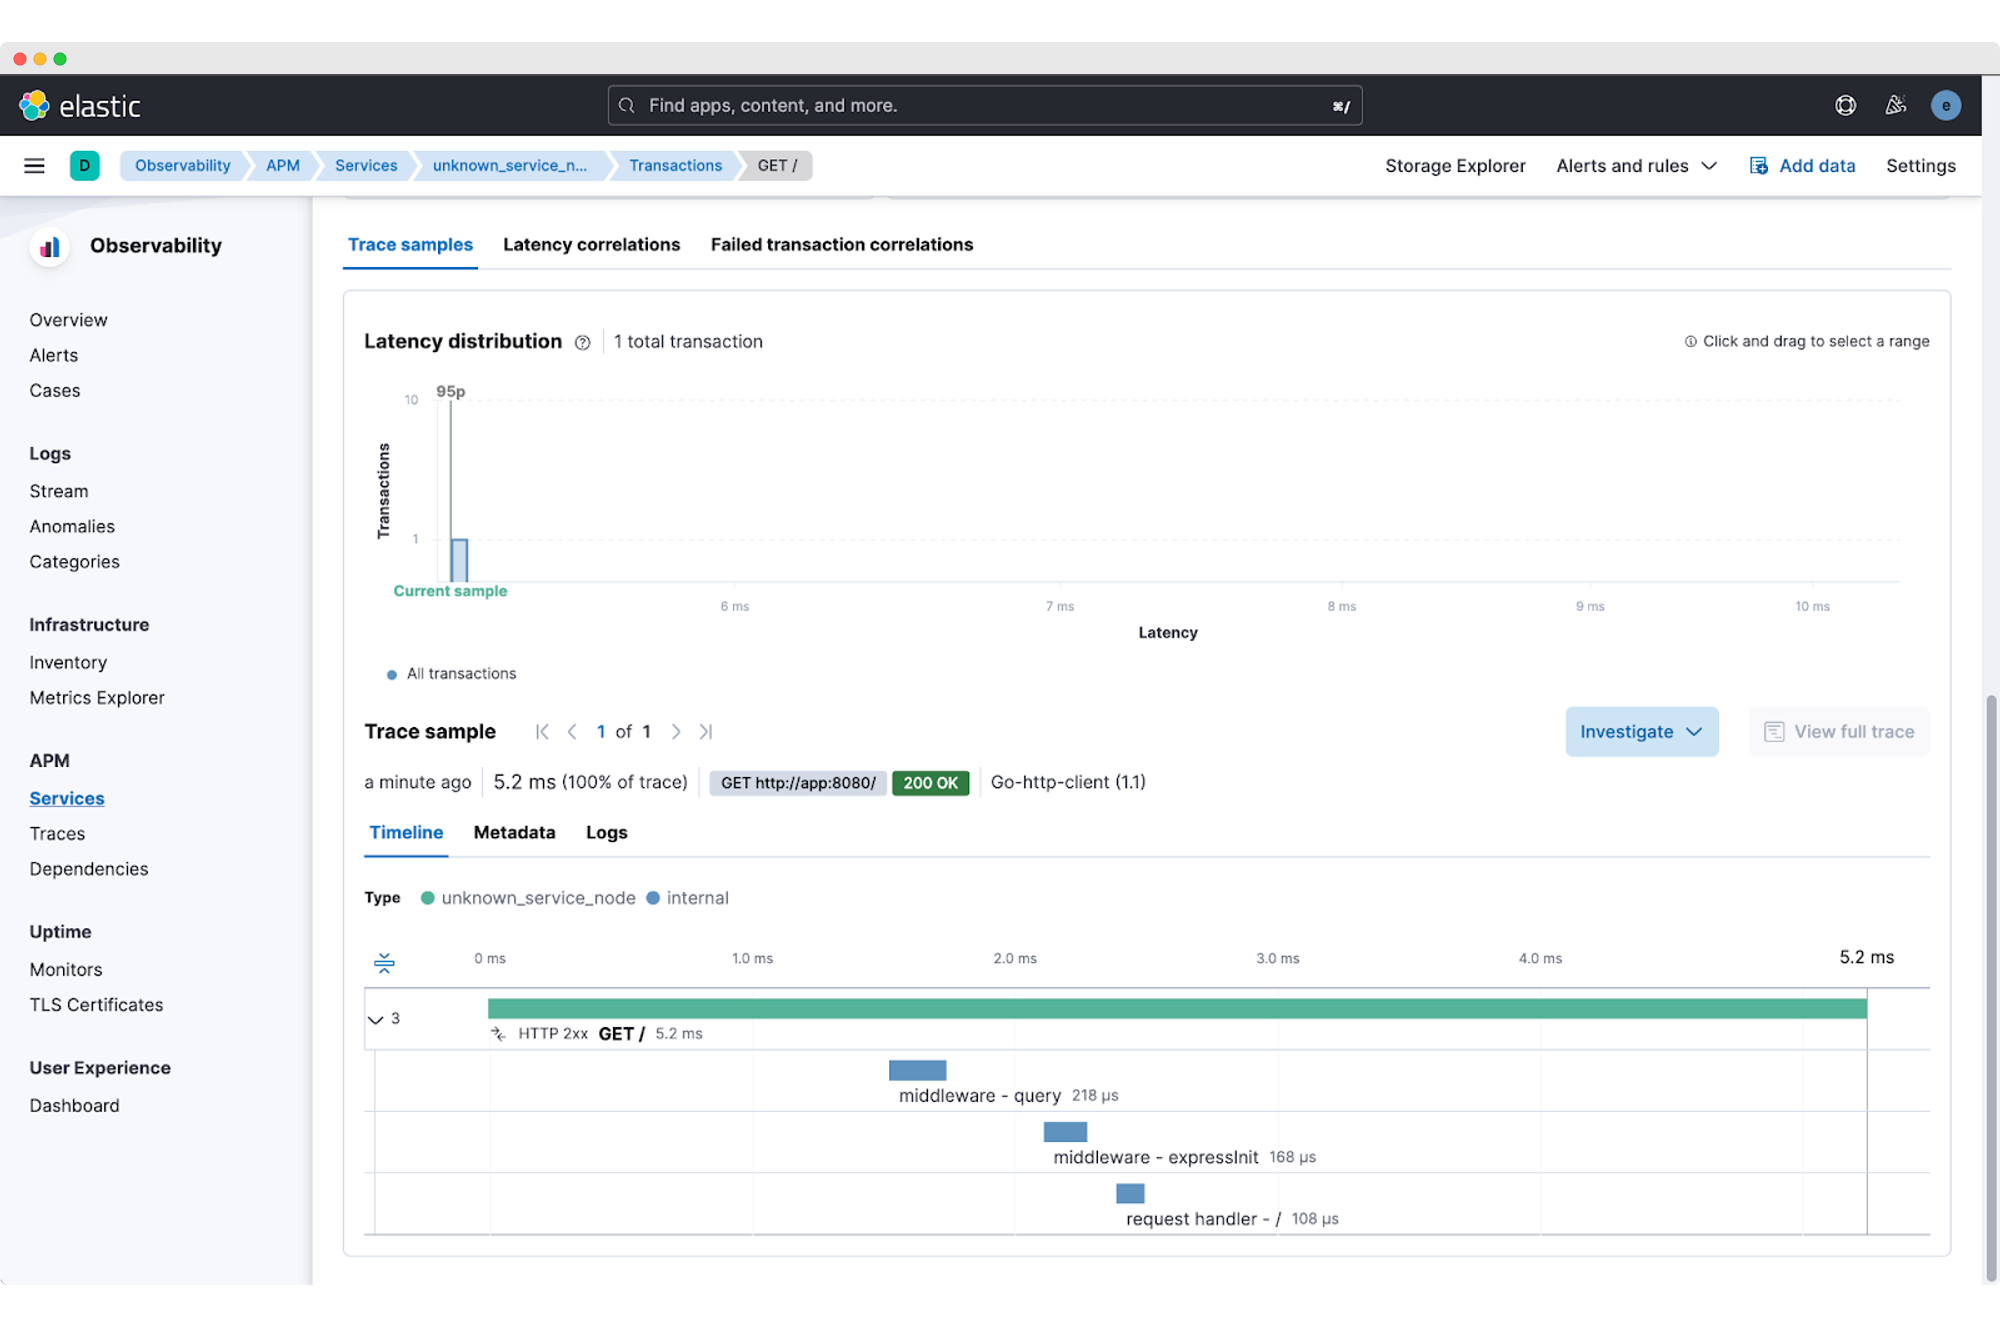
If you open the APM app in Kibana at [https://localhost:5601](https://localhost:5601/) (find the username and password from the `examples/tracetest-elasticapm-with-otel/.env` file in the [examples](https://github.com/kubeshop/tracetest/blob/main/examples/tracetest-elasticapm-with-otel/.env)), you will be able to navigate to the transaction generated by the test representing the overall application call with three underlying spans:
## Summary
Elastic APM and Tracetest are tools that can help make testing distributed applications easier by providing a more comprehensive view of the system's behaviour and allowing developers to identify and diagnose performance issues more efficiently. Tracetest allows you to test the entire process from start to finish, making sure that everything is working as it should, by following the path that a request takes. Elastic APM provides detailed information about the performance of a system, including how requests are flowing through the system, how long requests take to be processed, and which services are being called. Together, these tools can help developers to identify and fix issues more quickly, improve collaboration and communication among the team and ultimately improve the overall quality of the system.
Some helpful links for you to learn more about Elastic APM and Tracetest:
- Elastic APM documentation: [https://www.elastic.co/guide/en/apm/guide/current/index.html](https://www.elastic.co/guide/en/apm/guide/current/index.html)
- Tracetest documentation: [https://tracetest.io/docs/](https://tracetest.io/docs/)
- Tracetest Github page: [https://github.com/kubeshop/tracetest](https://github.com/kubeshop/tracetest)
- Elastic blog: [https://www.elastic.co/blog/category/technical-topics](https://www.elastic.co/blog/category/technical-topics)
- Elastic APM community forum: [https://discuss.elastic.co/c/apm](https://discuss.elastic.co/c/apm)
- Tracetest support: [Slack channel](https://dub.sh/tracetest-community)
.jpg)
.avif)
.avif)