
Identify patterns and issues with code instrumentation
.avif)
%20(1).avif)
The Tracetest Analyzer can analyze traces, identify patterns & fix issues with code instrumentation, making it easy adhere to OpenTelemetry rules and standards.
Table of Contents
Are you ready!? I’m thrilled to announce a new feature that has been in the works for the past few weeks.
[The Tracetest Analyzer!](https://docs.tracetest.io/configuration/tracetest-analyzer)
The Tracetest Analyzer is a plugin-based framework used to analyze [OpenTelemetry](https://opentelemetry.io/) traces to help teams improve instrumentation data, find potential problems and provide tips to fix problems with [code instrumentation](https://opentelemetry.io/docs/instrumentation/). 🔥
We are always looking for ways to help users have the best experience when testing their distributed systems.
Currently, executing a test with Tracetest is composed of three main modes:
- `Trigger`
- `Trace`
- `Test`
Today we have some exciting news to share about improvements to the `Trace` mode. With the release of `v0.11.10` you will now have access to the Tracetest Analyzer. Let’s dive into what this means.
## Let’s talk about the problem
Instrumenting a distributed system is an overwhelming task.
When deciding to introduce tracing using OpenTelemetry, it is important to follow rules and standards to ensure the quality of the telemetry data. The data should be readable and useful for developers to debug and find potential issues, as well as help SREs sleep better at night.
All of the standards and rules necessary for instrumenting the system can be found spread across various documentation pages and libraries on hosting platforms like Github. This can make the job of instrumenting code much more difficult.
I took a moment to collect them all here for you:
- [OpenTelemetry Docs Common Specs](https://opentelemetry.io/docs/specs/otel/common/)
- [OpenTelemetry Docs Library Guidelines](https://opentelemetry.io/docs/specs/otel/library-guidelines/)
- [OpenTelemetry Docs Error Handling](https://opentelemetry.io/docs/specs/otel/error-handling/)
- [OpenTelemetry Specification GitHub](https://github.com/open-telemetry/opentelemetry-specification/tree/main)
Spreading this knowledge across different resources makes enforcing standards an even bigger hurdle.
It gets exponentially more complex depending on the architecture and team organization. A distributed system can be composed of different sets of programming languages and tools. As well as for some microservice-driven systems, where teams can also be divided into entirely separated cells with little communication between each other.
Most of the time, SREs and QAs end up getting caught in the middle… 😢
## Ideation 💡
From one of the early brainstorming sessions we had as a team, [Matheus](https://www.linkedin.com/in/matheusnogueira/) came up with the idea of being able to analyze traces to find possible problems. This would catch problems by evaluating the metadata in trace spans or finding patterns in the entire distributed trace.
The idea grew based on several community requests. Community members created three different issues.
One by [Mark de Jong](https://www.linkedin.com/in/mfcdejong/), a cloud-native architect at [ING](https://www.ing.com/Home.htm), and two opened by [Adam Gardner](https://www.linkedin.com/in/agardner1/) a CNCF ambassador working at [Dynatrace](https://www.dynatrace.com/).
- [[feature request]Ability to export application behavior as policies for runtime](https://github.com/kubeshop/tracetest/issues/2417)
- [Define common trace "patterns / issues / problems"](https://github.com/kubeshop/tracetest/issues/1470)
- [Standard "trace problem" definition](https://github.com/kubeshop/tracetest/issues/1469)
We got the idea to include a scoring system similar to [Google’s Lighthouse](https://chrome.google.com/webstore/detail/lighthouse/blipmdconlkpinefehnmjammfjpmpbjk?hl=es). It allows users to find potential problems that exist within the representation of a flow within the system. But, also enable them to have a set goal to improve the overall quality of the telemetry data. Plus, it fixes potential problems with the system.
The culmination of our effort is called the Tracetest Analyzer!
## Solution: The Tracetest Analyzer 🐙
The first-ever tool to analyze traces! The Tracetest Analyzer can analyze traces, identify patterns, and fix issues with code instrumentation.
As you already saw from the beginning of the article, we are thrilled to share that we have released the initial version of the Tracetest Analyzer. Currently in `beta`.
This is the culmination of all the planning, conversations and community requests that we have had across several months.
During the first-ever Kubeshop Hackathon held from May 15th to May 18th, 2023, the team decided to work on the initial version of the Analyzer, code-named “The Dream”.
## What is the Tracetest Analyzer?
The Tracetest Analyzer is an evaluation framework composed of plugins. It analyzes [OpenTelemetry](https://opentelemetry.io/) traces to help teams improve instrumentation data, find potential problems and provide tips to fix problems with [code instrumentation](https://opentelemetry.io/docs/instrumentation/).
Each plugin contains a set of rules which can be applied to each of the spans or to the entire trace.
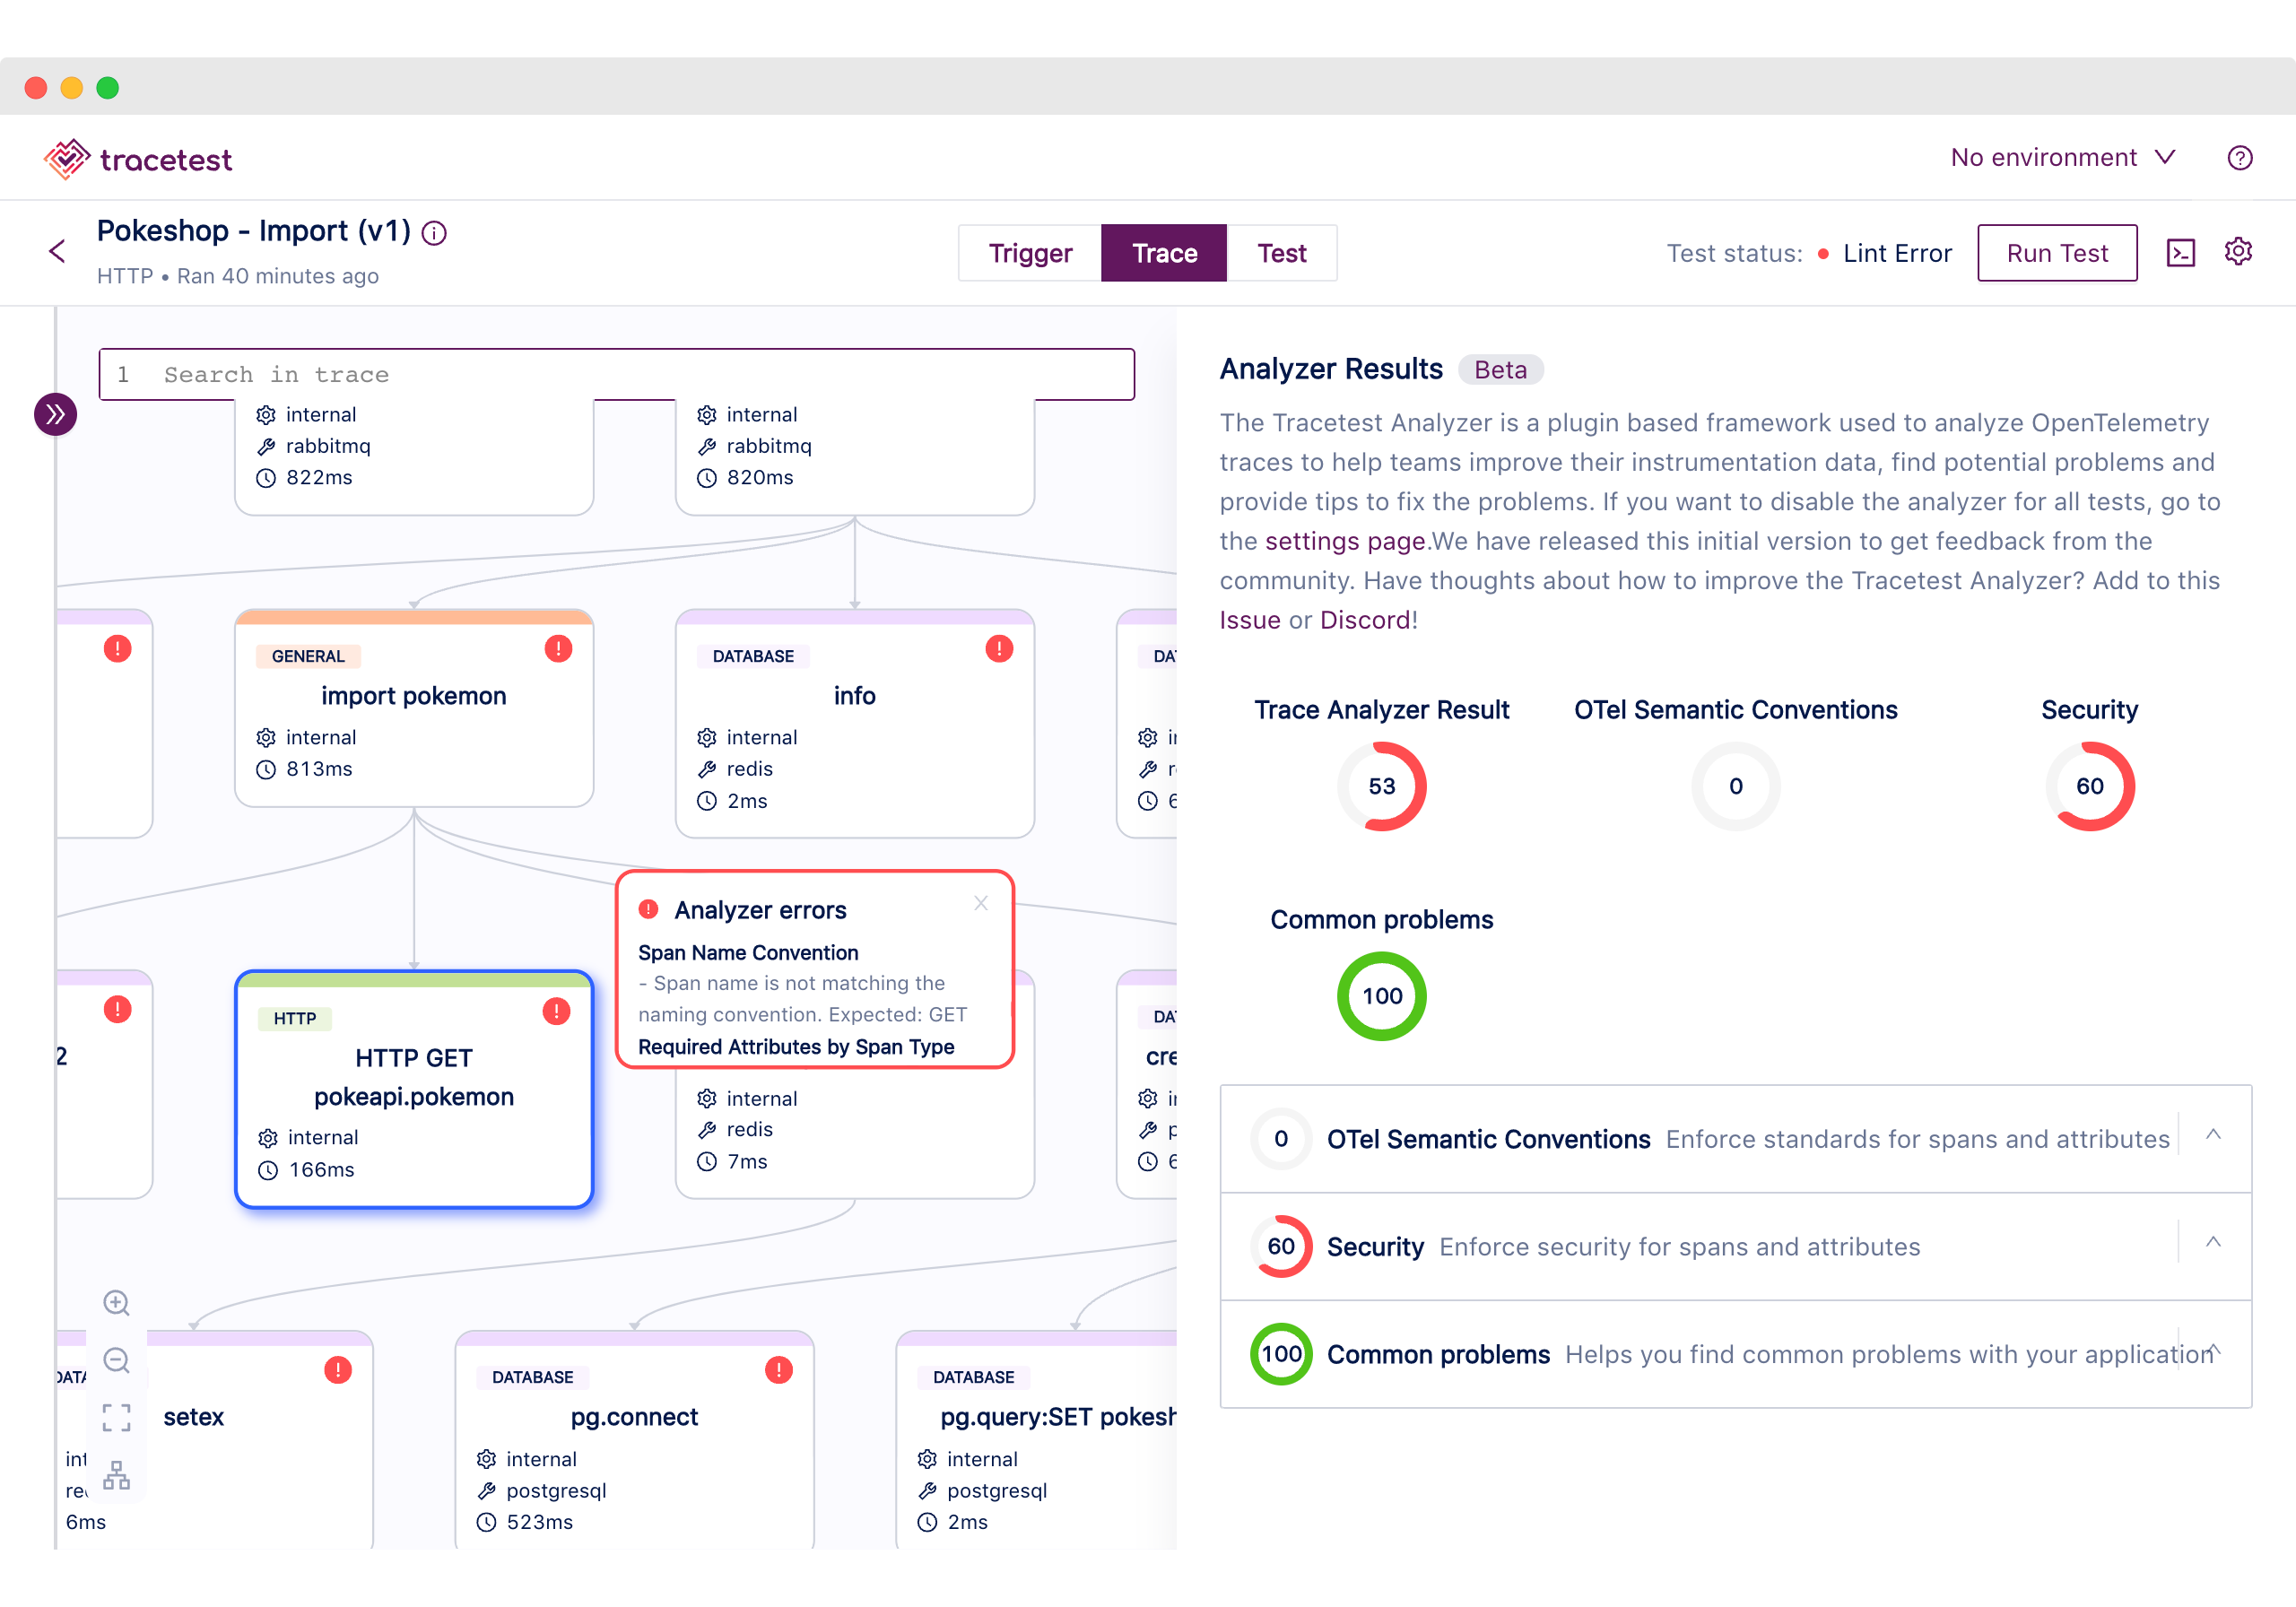
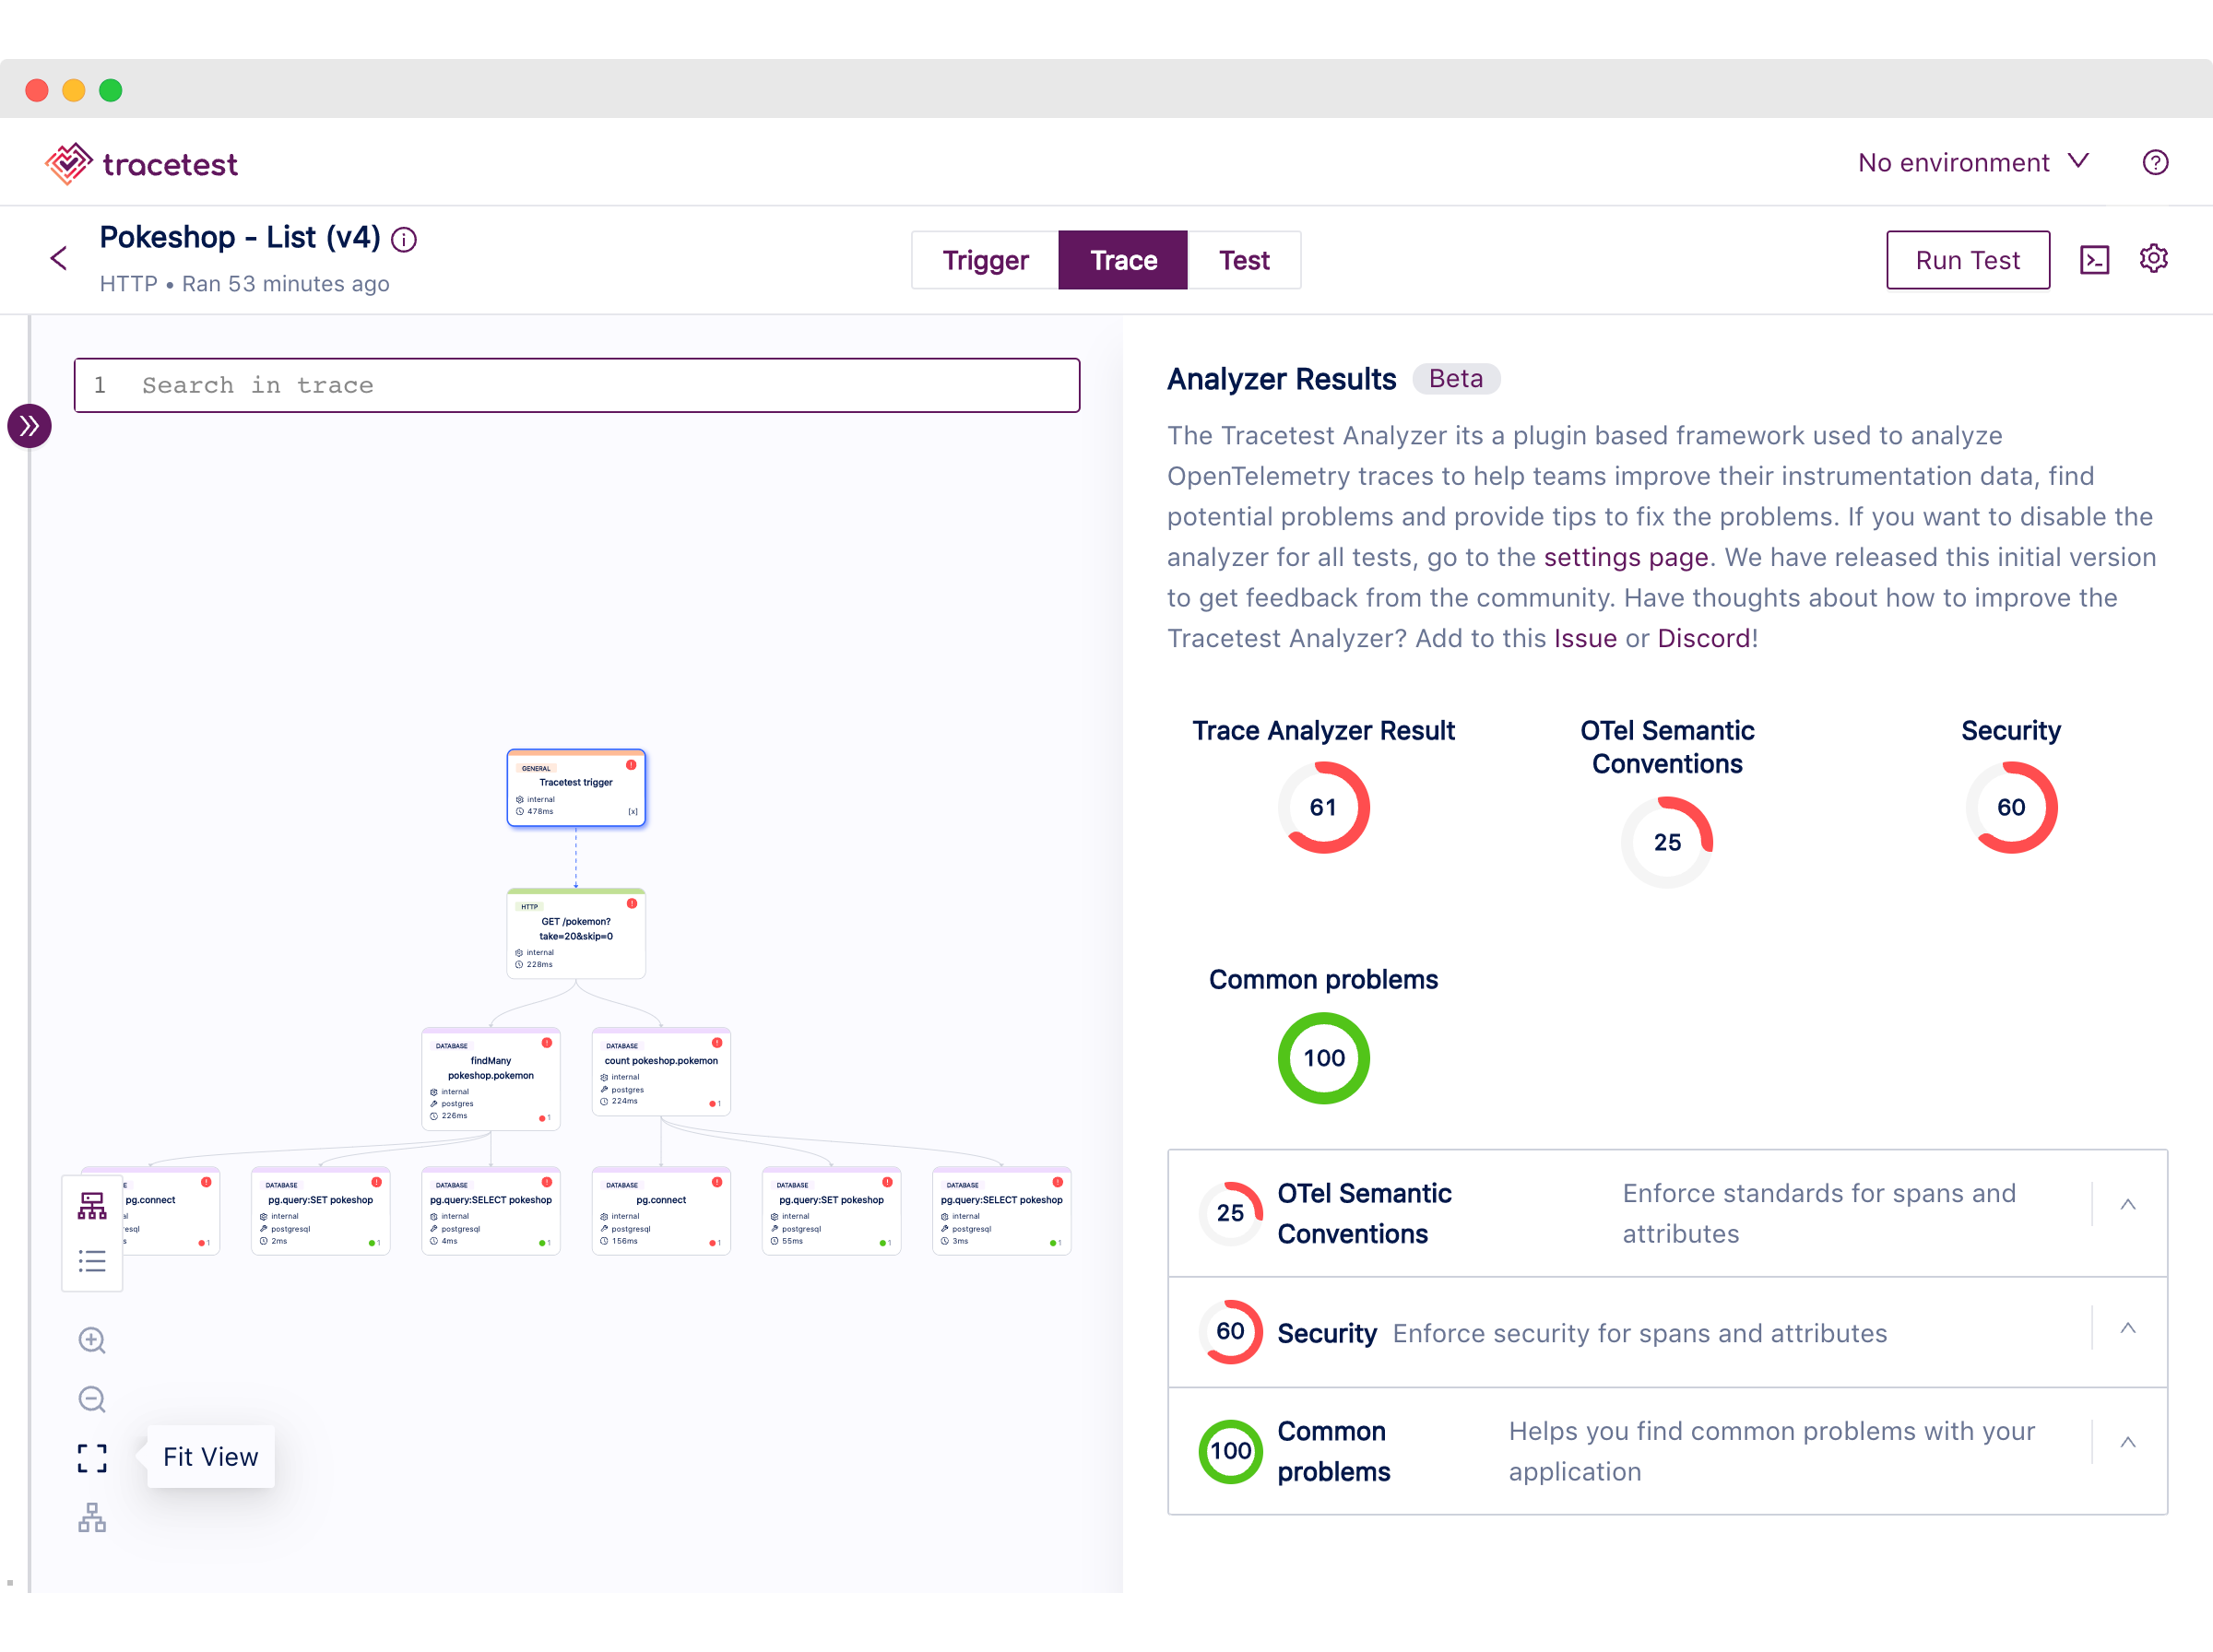
It is included as one of the steps by the Tracetest test runner, which executes the analyzer every time you run a test and allows you to visually see the global score, plugin score and passed/failed results of each of the rules alongside tips on how to fix them.
### Key Concepts
**Plugin.** The encapsulation of the metadata (name, description), the list of rules and the logic on how to evaluate them. Evaluating a plugin will yield a score depending on the weight of each passed and failed rule and each of the individual results.
**Rule**. A unitary validation against any section of the trace. It can be:
- a span
- a set of spans
- the entire trace
Evaluating the result will output a passed or failed status.
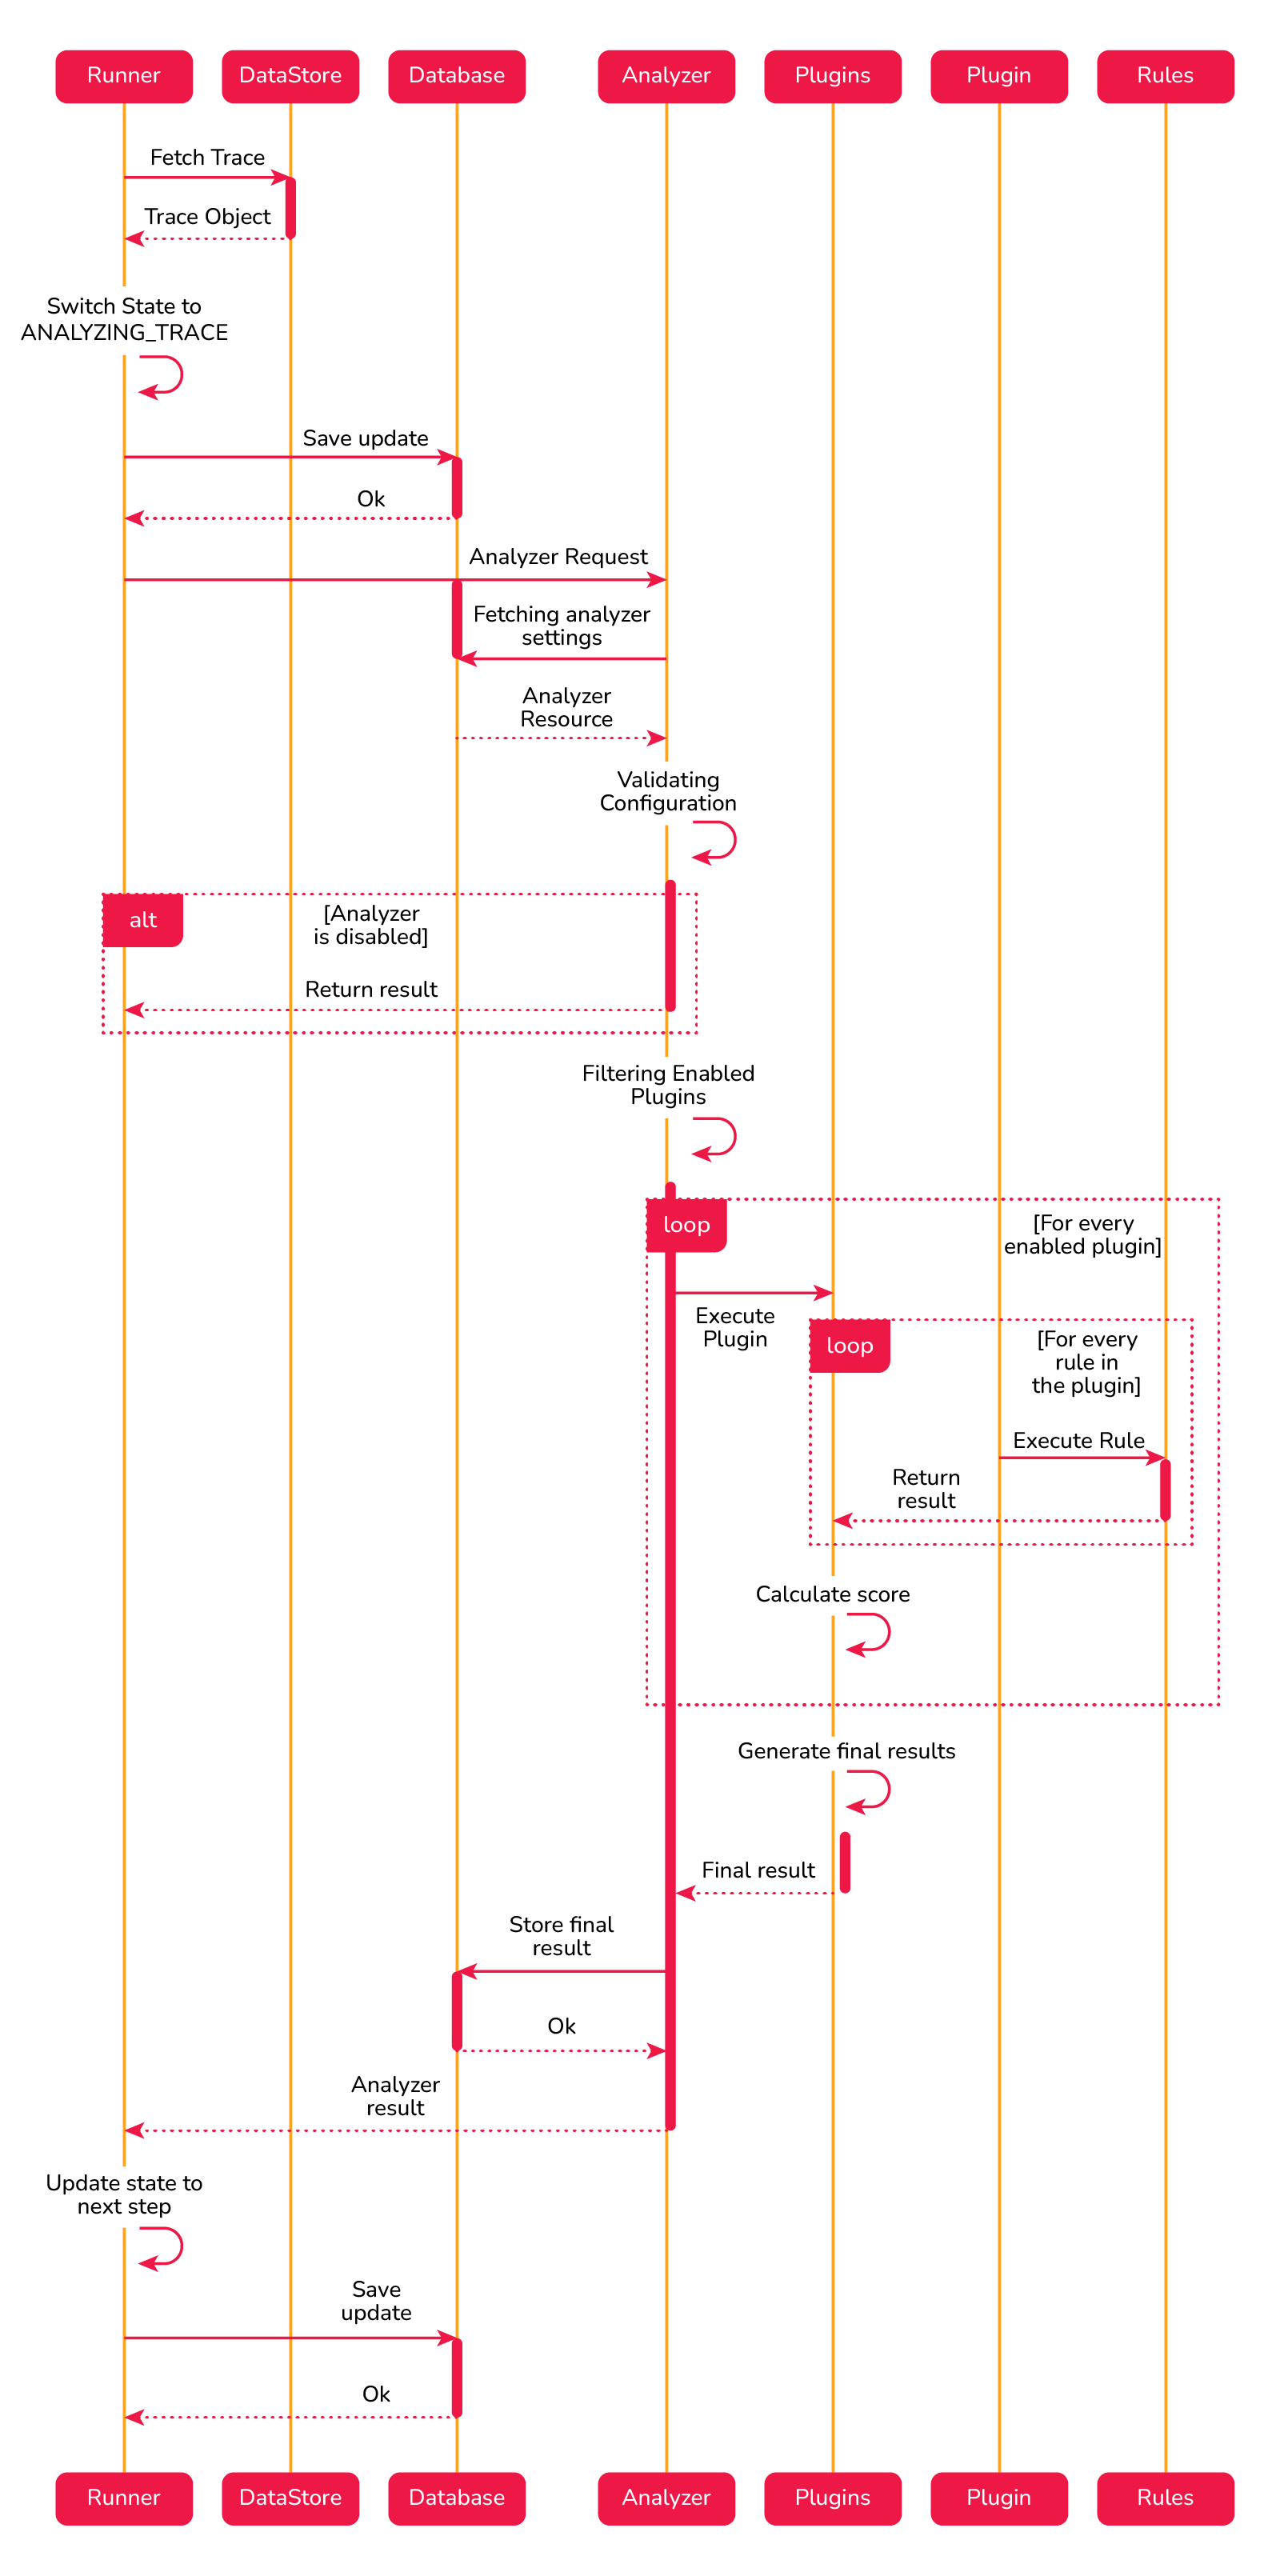
## How does the Tracetest Analyzer work?
After getting the distributed trace from the data store, Tracetest will run the analyzer step to evaluate each of the registered plugins, gather the results and calculate the global score. If the global score is below the minimum you’ve configured, the test run will fail!
## Registered Plugins
For the `beta` version, we have defined three plugins.
**OpenTelemetry Semantic Conventions.** Enforces teams to follow the semantic conventions defined by the Otel community, it includes rules to validate span names and required attributes.
**Security.** Allows teams to identify possible security problems by evaluating the trace. It currently has rules to prefer HTTPS over HTTP and to avoid API Keys Leaks.
**Common Problems.** Helps users catch some of the common problems, the enabled rule evaluates the usage of DNS over IPs endpoints.
The beta list of plugins and rules is not configurable at the moment but it represents a subset of things we will be doing in the near future. We are asking for community feedback on what you’ll want to see added! Add your thoughts to this [Issue](https://github.com/kubeshop/tracetest/issues/2615) or [Slack](https://dub.sh/tracetest-community)!
## How to enable the Tracetest Analyzer?
If you are using Tracetest version `v0.11.10` or above, the Analyzer will be enabled by default. We are not enforcing a minimum score. You can enforce it by heading to the analyzer settings page in the UI and selecting the minimum score. It’s the percentage average of all the plugin scores combined. A test will fail if its global score is below the configured minimum score.
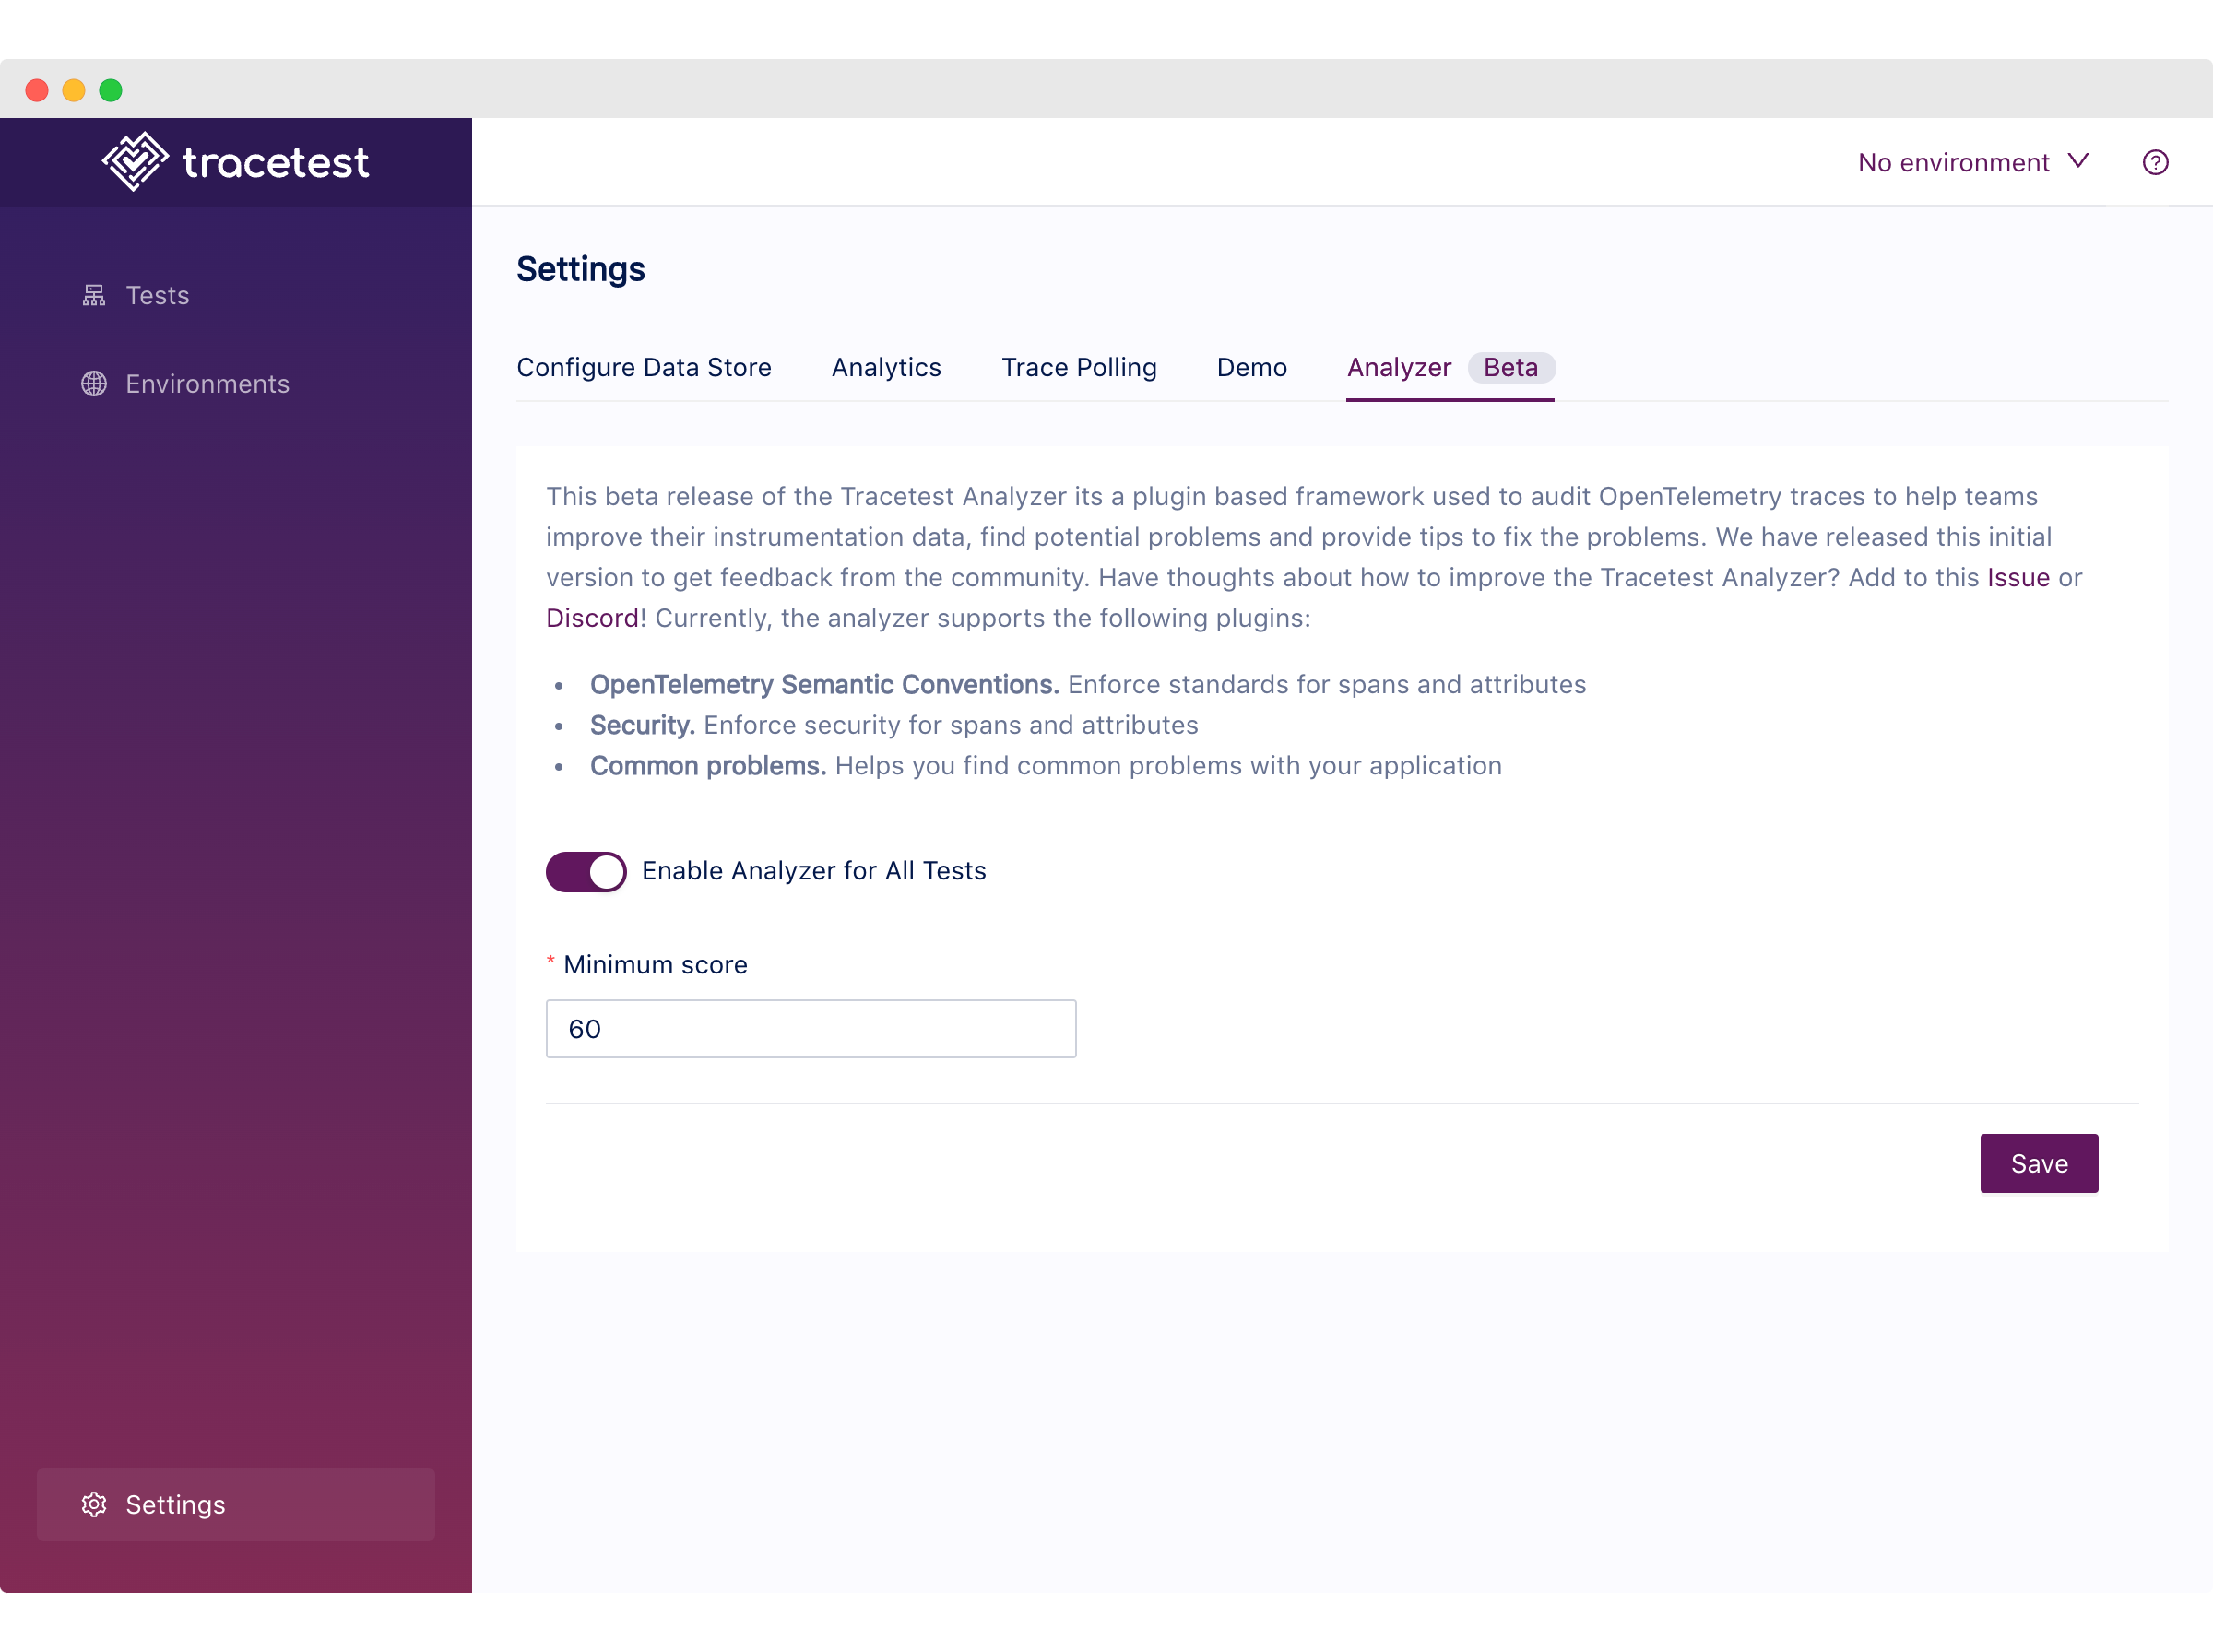
You can also disable the Analyzer entirely on the same page if you would like to do so.
## Tracetest Analyzer Video Guide
I’ve also recorded a 6-minute video guide on how to quickly get started with the Analyzer.
[https://www.loom.com/share/af06e7e0b97947888ced120a48d31961](https://www.loom.com/share/af06e7e0b97947888ced120a48d31961)
## Tracetest Analyzer Webinar
We’re dropping a webinar with Adriana Villela from On-Call Me Maybe Podcast tomorrow! Save the date and tune in.
[https://www.youtube.com/watch?v=AZiEST7EUhU](https://www.youtube.com/watch?v=AZiEST7EUhU)
## What’s Next?
First and foremost, we would love your feedback on the first version of the Tracetest Analyzer!
We understand that there is a lot of room for improvement. We want to make sure the features we’re building are aligned with what the community needs!
Last, but not least, do you want to learn more about Tracetest and what it brings to the table? Check the [docs](https://docs.tracetest.io/examples-tutorials/recipes/running-tracetest-with-lightstep/) and try it out by [downloading](https://tracetest.io/download) it today!
Also, please feel free to join our [Slack community](https://dub.sh/tracetest-community), give [Tracetest a star on GitHub](https://github.com/kubeshop/tracetest), or schedule a [time to chat 1:1](http://calendly.com/ken-kubeshop/otel-user-interview-w-tracetest).
.jpg)
.avif)
.avif)