
Using Tracetest with OpenTelemetry for Trace-based Testing
%20(1).avif)

Learn the basics of distributed tracing, the differences between tracing and logging, an intro to OpenTelemetry (a set of observability tools), and an intro to Tracetest for trace-based testing.
Table of Contents
Working with distributed systems can feel like a circus act. Trying to keep a dozen spinning plates in the air is hard—one slight misstep and everything can come crashing down.
Traditional testing methods are great for catching straightforward issues, but they often miss the nuanced problems that pop up when microservices start interacting with each other in unexpected ways. This is where trace-based testing comes in. By using distributed tracing in your observability tool, you’re not just checking if the end result is correct—you’re ensuring that every step in your application’s workflow is valid, from start to end.
This tutorial covers four things:
- Basics of distributed tracing.
- Differences between tracing and logging.
- Introduction to OpenTelemetry, a set of observability APIs, SDKs, and tools used to instrument, generate, collect, and export telemetry data.
- Introduction to Tracetest, a tool for trace-based testing.
Whether you work with microservices, cloud-native applications, mobile apps, serverless, or monolithic architectures, you’ll learn how to level up your testing strategy and ensure your systems perform at their best.
## What is Distributed Tracing?
Distributed tracing maps how a single request moves through your application’s services.
Here’s a real-life example. When you request a product on an e-commerce platform, distributed tracing shows each step of the transaction, from the server’s HTTP request to database queries to the final page render. It’s crucial for understanding the system in real time, helping you spot bottlenecks or issues.
You might wonder—how is this different from logging? They both show what your system is doing. Their differences are key to effective monitoring and debugging.
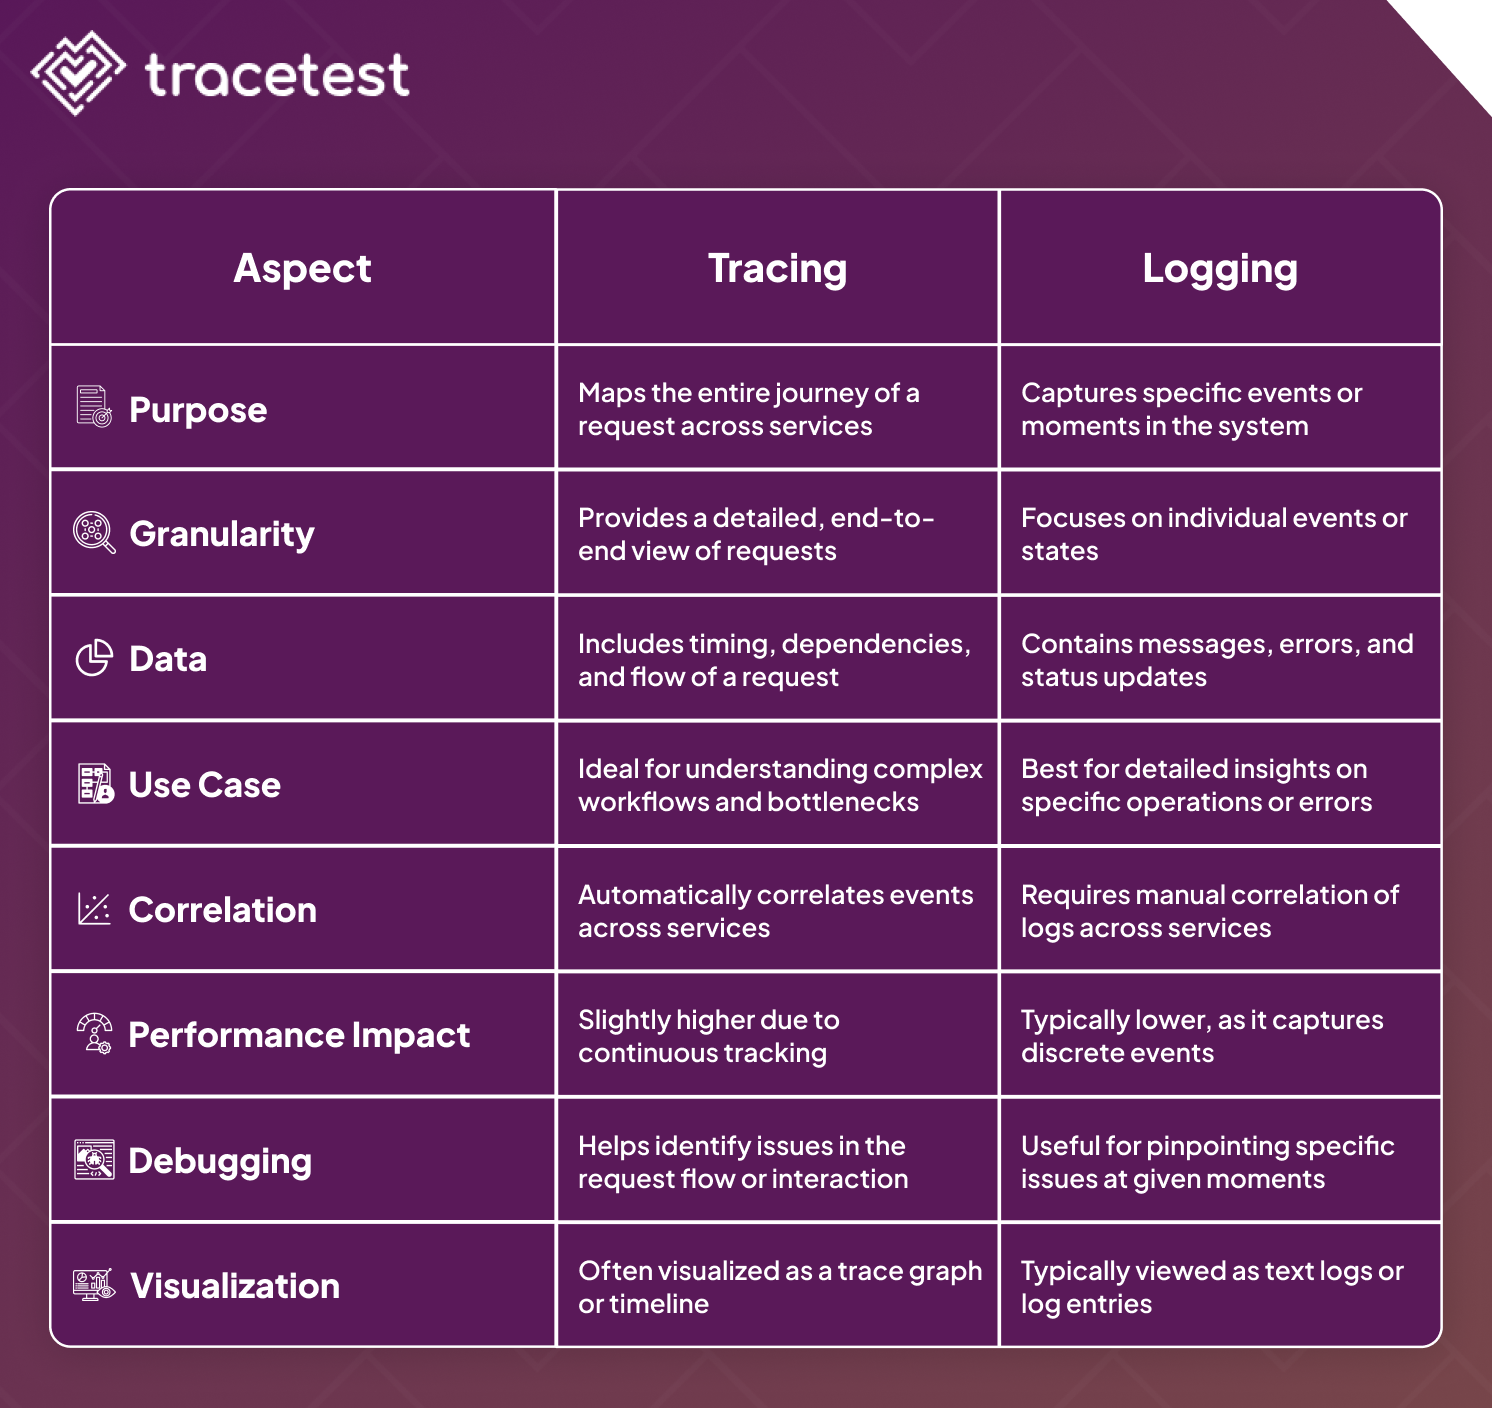
## Tracing vs Logging
Tracing provides a detailed journey of a request while logging captures specific moments. Logs are essential for debugging but don’t offer the whole picture. Tracing ties these moments together, creating a complete story that makes pinpointing the root cause of issues easier without sifting through scattered logs.
This detailed visibility offered by tracing naturally extends into testing strategies. Just as tracing connects the dots in monitoring, it also plays a critical role in testing workflows. This leads us to the comparison between traditional and trace-based testing, where the ability to see the entire process becomes invaluable.
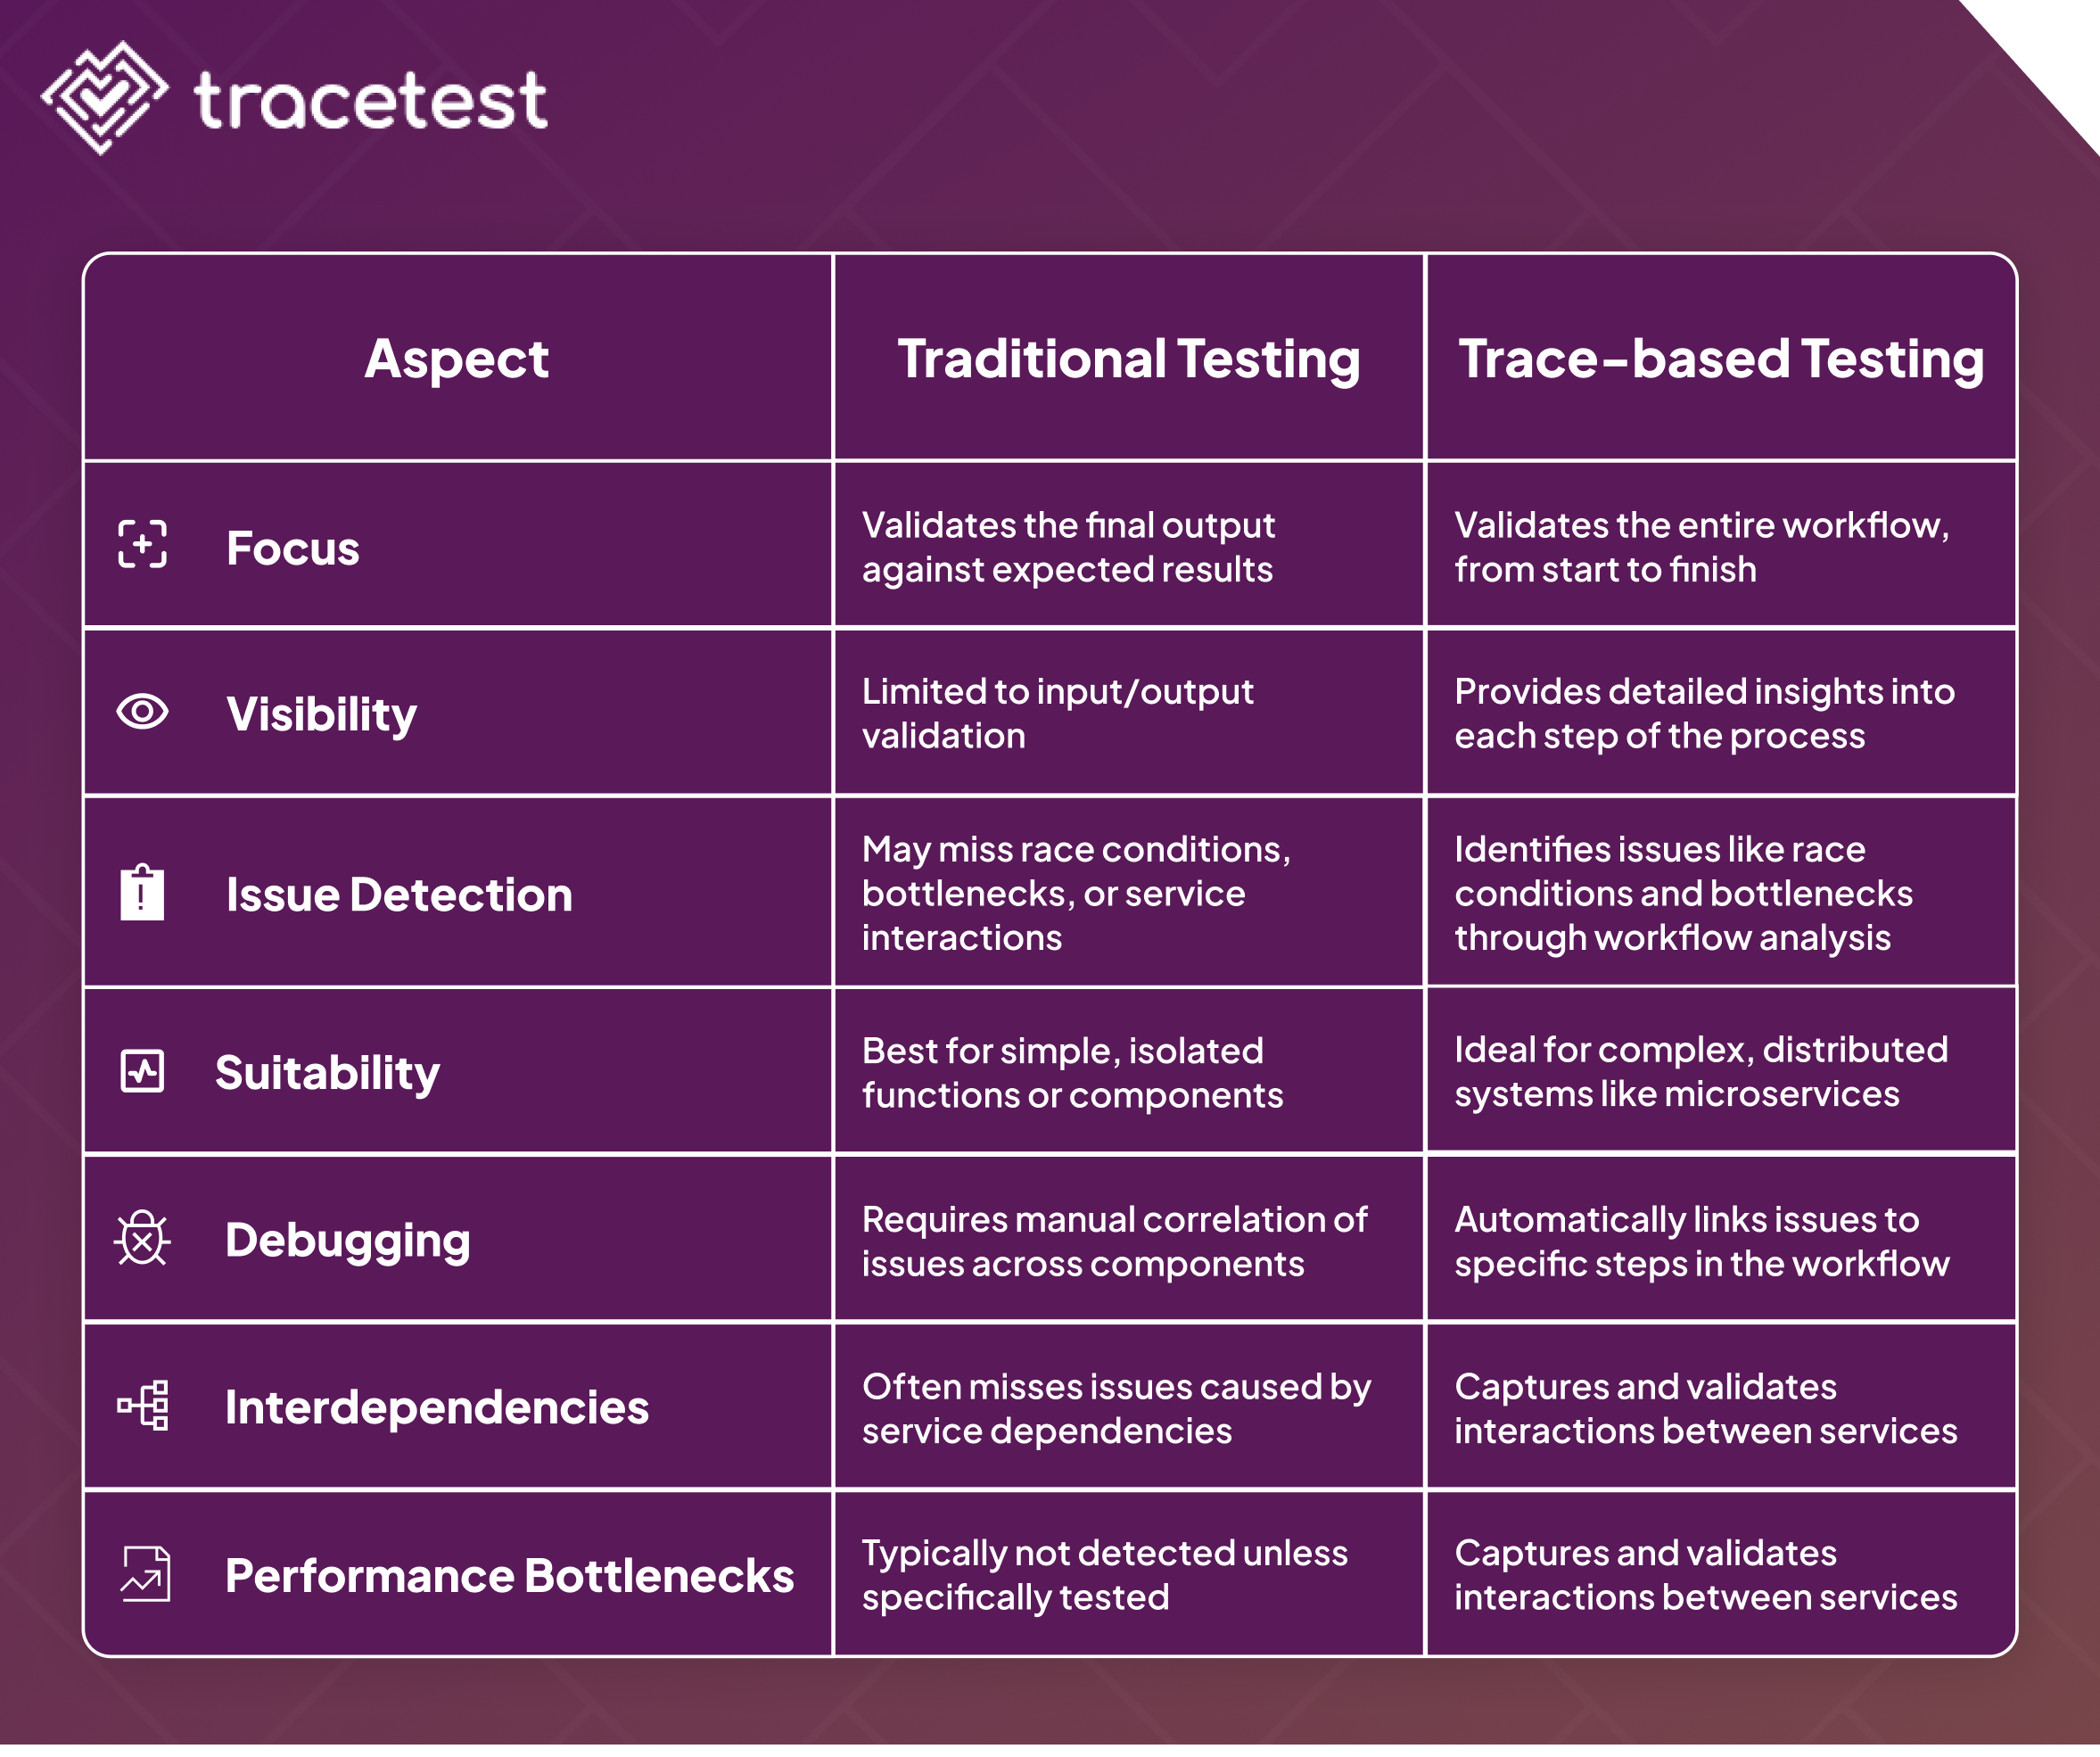
## Traditional Testing vs. Trace-based Testing
In traditional testing, you check if the output of a function or microservice matches the expected result. However, this can often miss issues like race conditions, performance bottlenecks, or incorrect service interactions.
Trace-based testing thoroughly validates workflows, ensuring not only the accuracy of the final output but also that each step is executed as intended. This is especially crucial in microservices environments, where interdependencies can make issues more difficult to detect.
Before we dive into how to leverage trace-based testing in your own systems, having the right tools at your disposal is crucial. That’s where OpenTelemetry comes into play. As one of the most widely adopted open-source projects, it provides a unified framework and software development kit (SDK) for collecting, processing, and exporting traces, metrics, and logs from your applications. With OpenTelemetry, you can easily instrument your code to generate the telemetry data you need to see how every core component of your system is performing and interacting.
## Introduction to OpenTelemetry
OpenTelemetry is the open-source Swiss army knife for observability, providing tools to collect and export the three pillars of observability—traces, logs, and metrics from your applications. Whether you’re dealing with a sprawling microservices architecture or a monolithic app, OpenTelemetry integrates seamlessly, allowing you to monitor and troubleshoot easily.
### Instrumentation in OpenTelemetry
Instrumentation is adding code to your application to generate telemetry data. With OpenTelemetry, you can instrument your services to automatically generate traces and metrics. This can be done manually by adding specific code or automatically by using OpenTelemetry's auto-instrumentation libraries, which inject the necessary tracing libraries into your application.
Let’s look at how to generate this telemetry data with OpenTelemetry using auto-instrumentation. We’ll be using a basic E-commerce application in Node.js for this tutorial. Create an Express server in `app.js`. Refer to this [Express Guide](https://expressjs.com/en/starter/hello-world.html) to get started.
```javascript
const express = require('express');
const { Pool } = require('pg');
const app = express();
const port = 5000;
const pool = new Pool({
user: 'postgres',
host: 'localhost,'
database: 'ecommerce',
password: 'root',
port: 5432,
});
// Routes
app.get('/', (req, res) => {
res.send('Welcome to the E-commerce App!');
});
app.get('/products', async (req, res) => {
try {
const result = await pool.query('SELECT * FROM products');
res.json(result.rows);
} catch (err) {
res.status(500).send(err.message);
}
});
// Start the server
app.listen(port, () => {
console.log(`Server running on http://localhost:${port}`);
});
```
Run the server on your machine:
```bash
node app.js
```
The server will start running on port 5000:
```bash
Server running on http://localhost:5000
```
For this tutorial, I’ll showcase a basic Node.js server, but in your case, it can be a complex application in Java or a Kubernetes cluster with multiple microservices. It does not matter which tech stack you use since OpenTelemetry supports all the major programming languages like Java, .Net, Ruby, Python, Go, Rust, C++, and JavaScript.
Let’s enable the instrumentation in the server by creating the file `instrumentation.js` and adding the auto-instrumentation code to the server:
```javascript
const { NodeSDK } = require('@opentelemetry/sdk-node');
const { ConsoleSpanExporter } = require('@opentelemetry/sdk-trace-node');
const {
getNodeAutoInstrumentations,
} = require('@opentelemetry/auto-instrumentations-node');
const {
PeriodicExportingMetricReader,
ConsoleMetricExporter,
} = require('@opentelemetry/sdk-metrics');
const sdk = new NodeSDK({
traceExporter: new ConsoleSpanExporter(),
metricReader: new PeriodicExportingMetricReader({
exporter: new ConsoleMetricExporter(),
}),
instrumentations: [getNodeAutoInstrumentations()],
});
sdk.start();
```
Here’s a concise breakdown of the code above:
- Import the necessary OpenTelemetry components for tracing and metrics.
- Configure `traceExporter`, which uses `ConsoleSpanExporter` to print trace data to the console.
- Configure `metricReader`, which uses `PeriodicExportingMetricReader` with `ConsoleMetricExporter` to print metrics to the console periodically.
- Enable automatic instrumentation for standard Node.js modules for tracing.
- Start the SDK using `sdk.start()` function, which initializes and begins collecting and exporting traces and metrics based on the configuration.
Install the required dependencies:
```bash
npm install express \
@opentelemetry/sdk-node \
@opentelemetry/api \
@opentelemetry/auto-instrumentations-node \
@opentelemetry/sdk-metrics \
@opentelemetry/sdk-trace-node \
dotenv
```
Finally, run your application as you normally would, but use the `--require` flag to load the instrumentation before the application code.
```bash
node --require ./instrumentation.js app.js
```
After a while, you should see the spans and metrics printed in the console by `ConsoleSpanExporter` and `ConsoleMetricExporter`.
```JSON
{
resource: {
attributes: {
'service.name': 'unknown_service:C:/Program Files/nodejs/node.exe',
'telemetry.sdk.language': 'nodejs',
'telemetry.sdk.name': 'opentelemetry',
'telemetry.sdk.version': '1.25.1',
'process.pid': 17668,
'process.executable.name': ' ',
'process.executable.path': 'C:\\Program Files\\nodejs\\node.exe',
'process.command_args': [
'C:\\Program Files\\nodejs\\node.exe',
'--require',
'./instrumentation.js',
'C:\\Users\\Public\\Infrasity\\Tracetest\\e-commerce-app\\server\\app.js'
],
'process.runtime.version': '20.10.0',
'process.runtime.name': 'nodejs',
'process.runtime.description': 'Node.js',
'process.command': 'C:\\Users\\Public\\Infrasity\\Tracetest\\e-commerce-app\\server\\app.js',
'process.owner': 'user',
'host.name': 'MSI',
'host.arch': 'amd64'
}
},
traceId: '97975dbd81381c8b7bae28dafbff2bf8',
parentId: undefined,
traceState: undefined,
name: 'fs statSync',
id: '1a5eab1d5343483d',
kind: 0,
timestamp: 1724234720014000,
duration: 128.8,
attributes: {},
status: { code: 0 },
events: [],
links: []
}
```
Now that we’ve set up tracing with OpenTelemetry, you’ve got a solid tool for capturing how your system operates, like seeing where requests slow down or fail. However, while OpenTelemetry shows you the data, it falls short in the following cases:
- **No Built-In Testing** - OpenTelemetry provides traces but doesn’t test if your app functions as expected. It might show a slow request but won’t check its impact on the user experience.
- **Lack of Workflow Validation** - It logs individual steps but doesn’t confirm if the entire process is correct, like logging an API call without verifying the follow-up actions.
- **No Assertion Validation** - It records data but doesn’t check it against specific criteria. For example, it logs a database query but won’t validate the result.
- **Misses Workflow Impact** - It identifies issues but doesn’t assess their impact on the overall system, such as detecting a delay without evaluating downstream effects.
- **No Automated Trace-based Testing** - It captures trace data but doesn’t automate testing to verify if each trace meets expectations.
That’s where Tracetest steps in. It allows you to create tests based on the traces collected, validating not just the final outcomes but every step in the workflow. This helps you catch issues like incorrect service interactions or performance bottlenecks that might not be obvious with OpenTelemetry alone. By integrating Tracetest, you ensure your application operates smoothly in production, addressing potential problems before they impact users.
## Using Tracetest for Trace-based Testing
Tracetest is a testing tool based on OpenTelemetry that allows you to test your distributed application. It will enable you to use data from distributed traces generated by OpenTelemetry to validate and assert if your application has the desired behavior defined by your test definitions.
### How does Tracetest work?
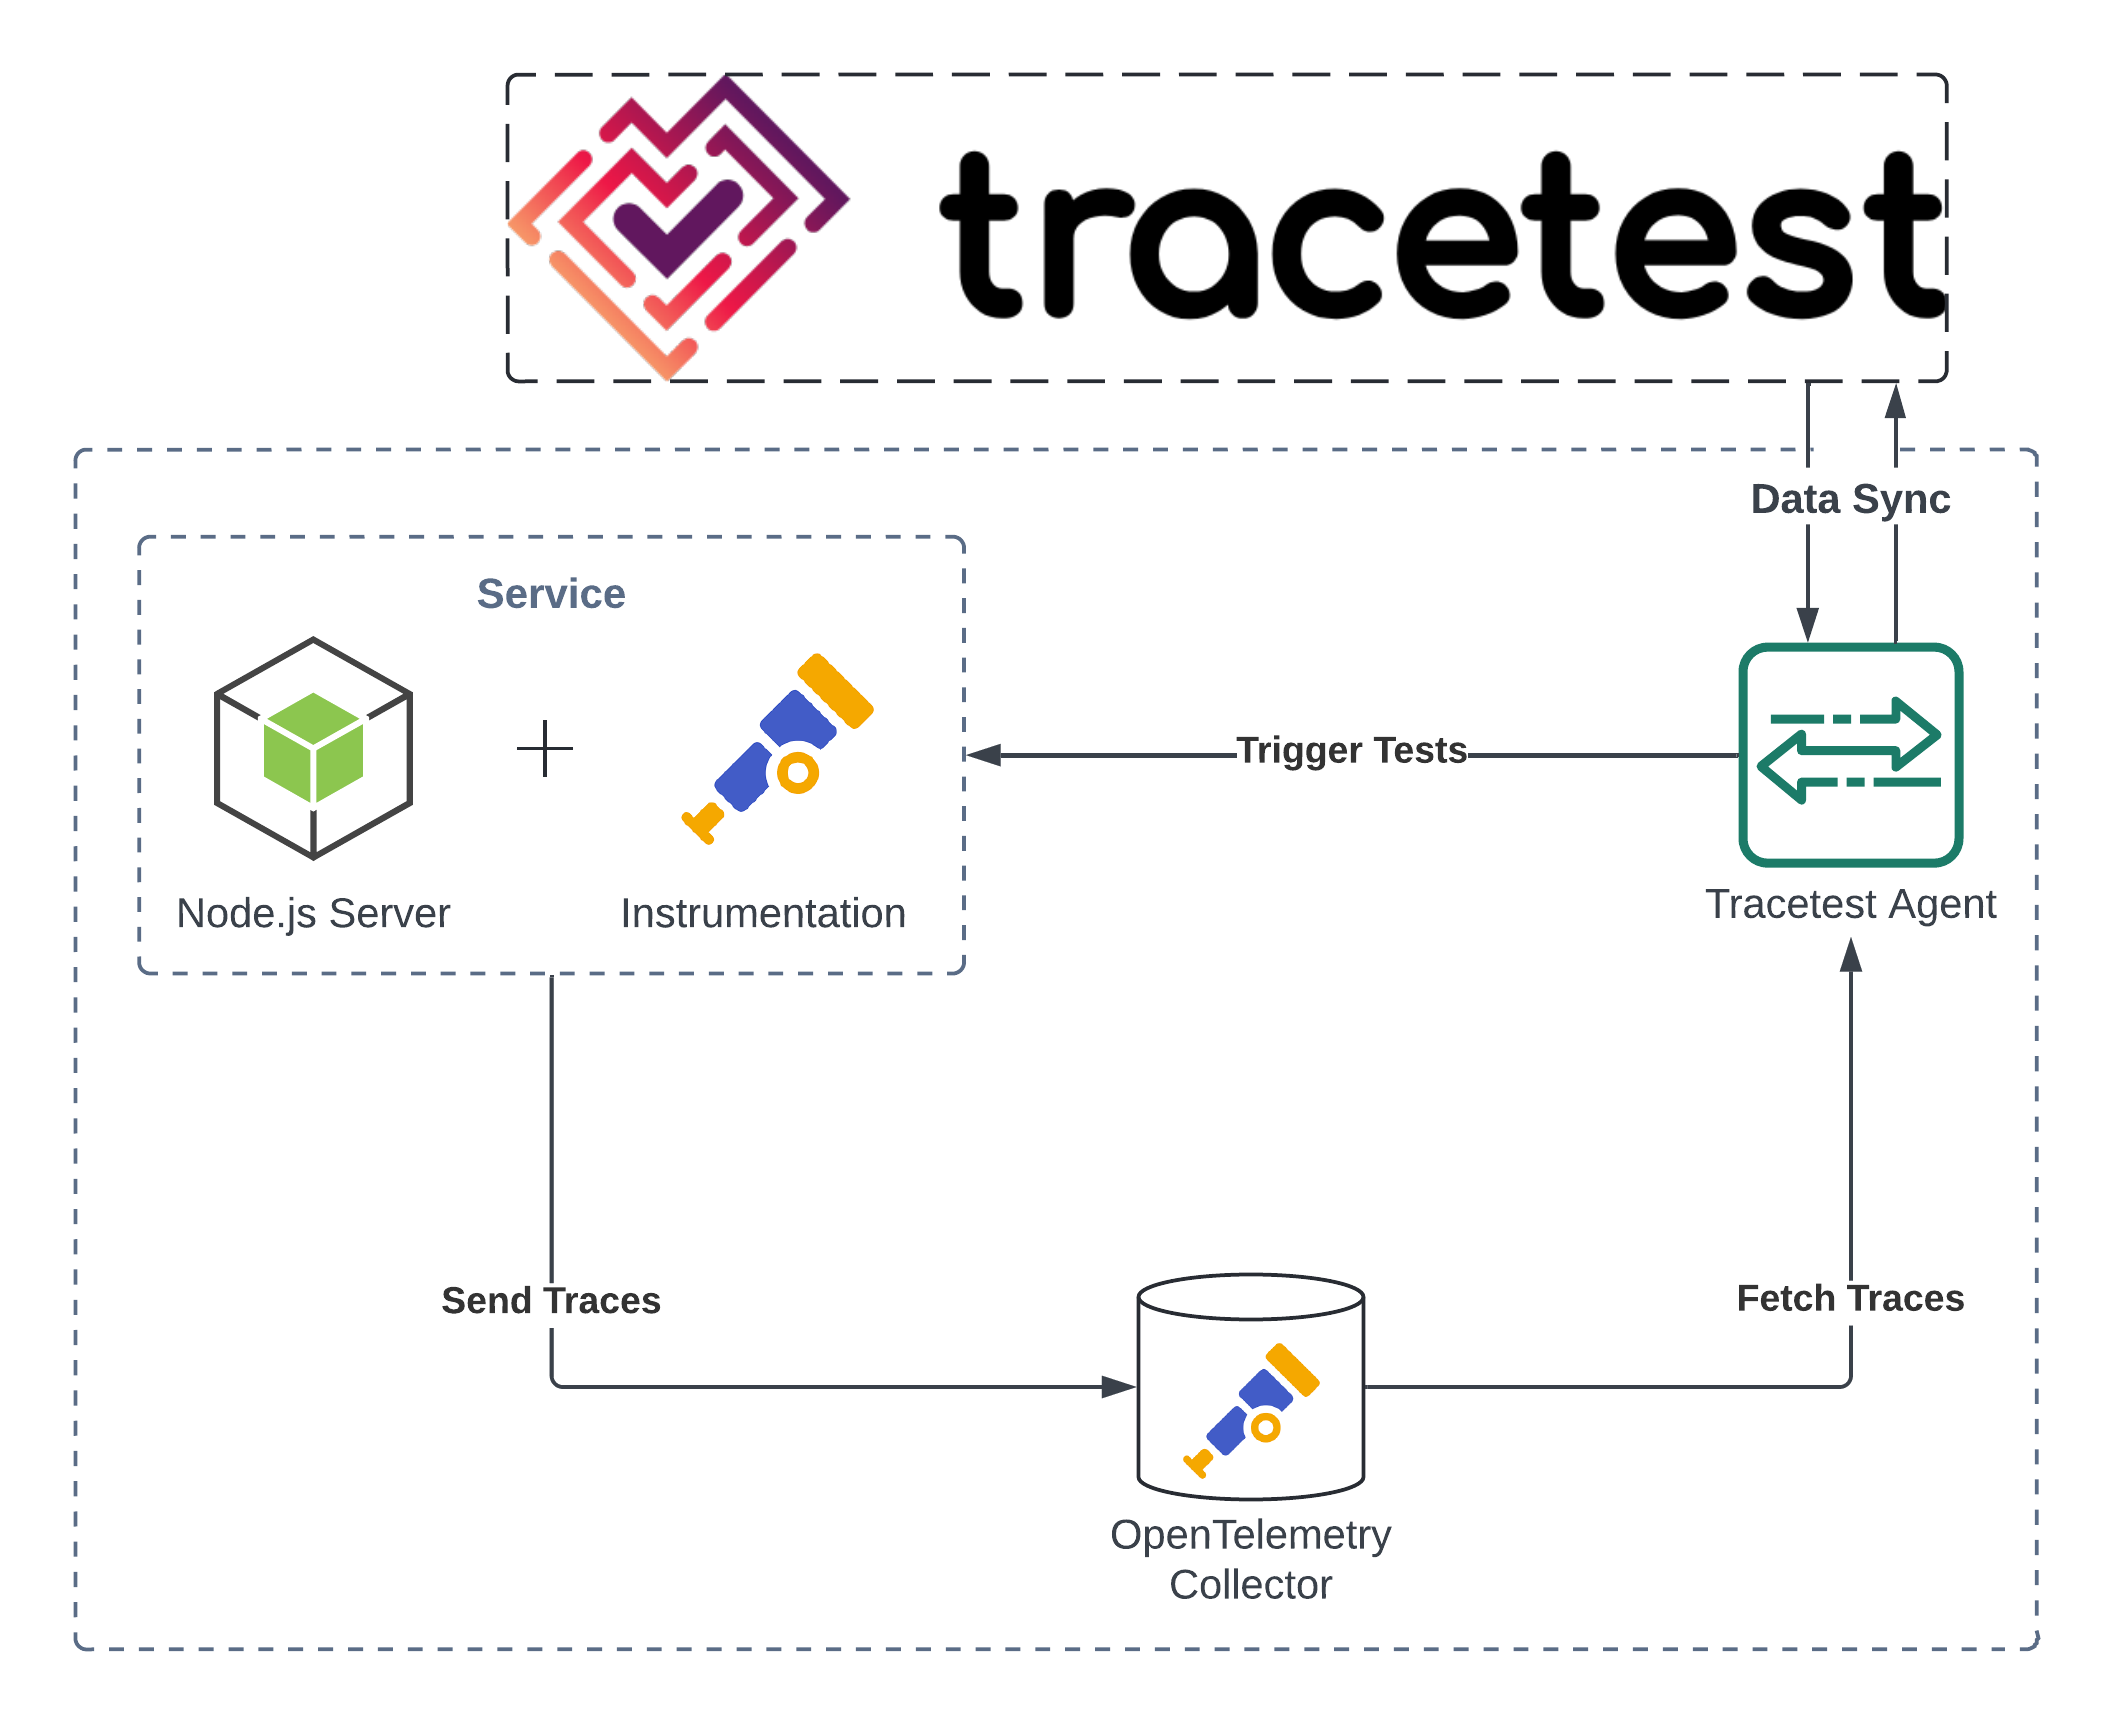
In the architecture diagram above:
- The Node.js server is instrumented to send traces to the OpenTelemetry Collector.
- The Tracetest agent triggers tests and fetches the traces from the collector.
- Finally, the agent synchronizes the test data back with Tracetest for analysis and validation.
This process enables continuous monitoring and testing of distributed systems using tracing data.
With a clear understanding of how Tracetest works, let's proceed to set it up in your system.
### Setting up Tracetest
1. Sign up to [app.tracetest.io](https://app.tracetest.io) and follow the get started docs to set up the Tracetest agent.
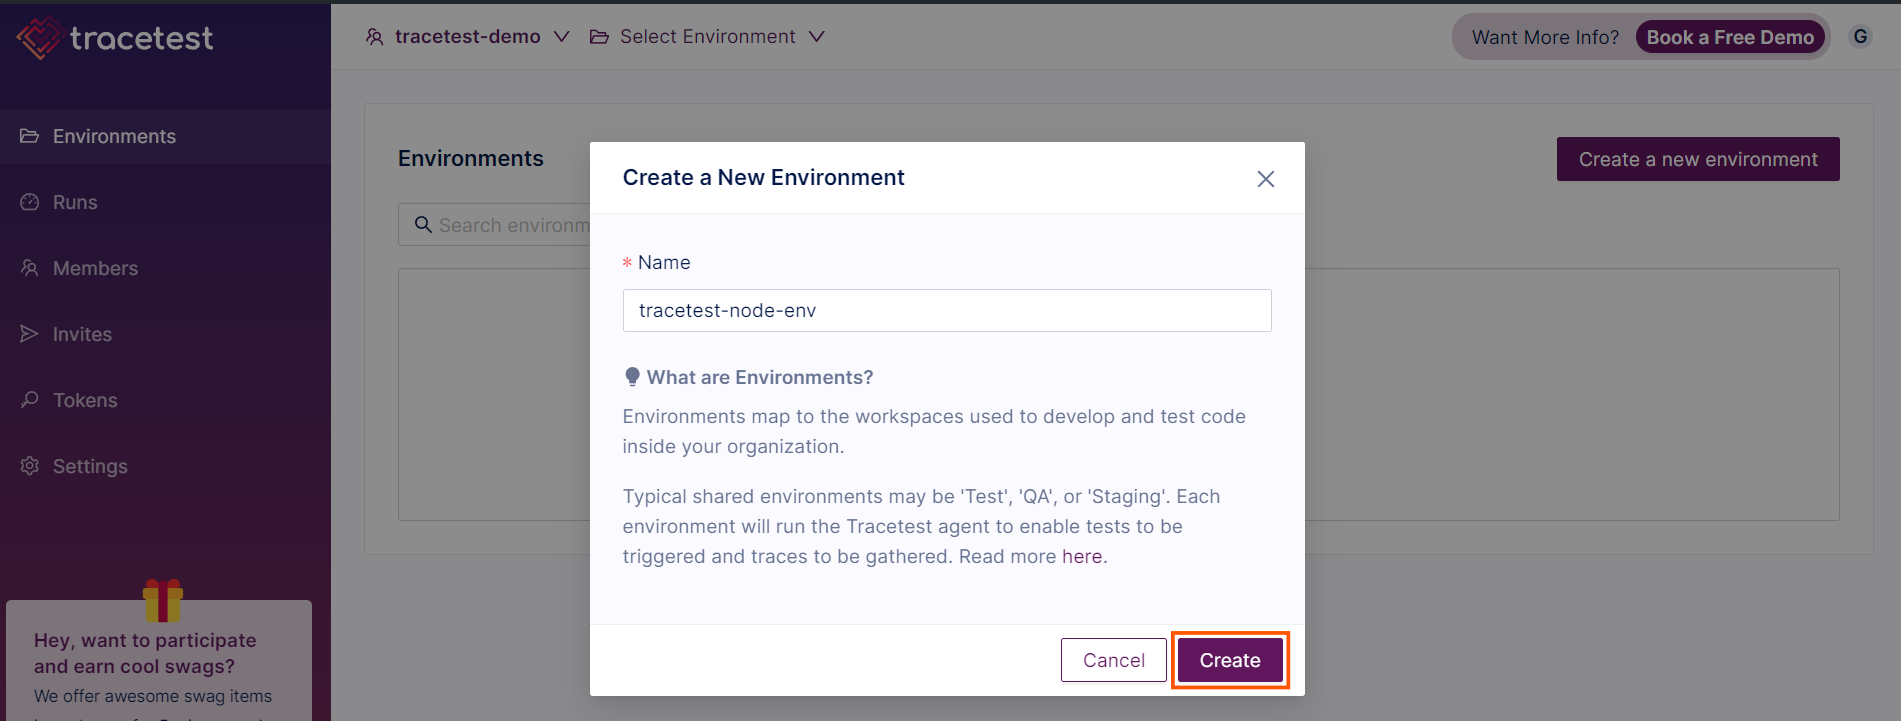
2. Create a new environment on the platform in the **Environment** tab.
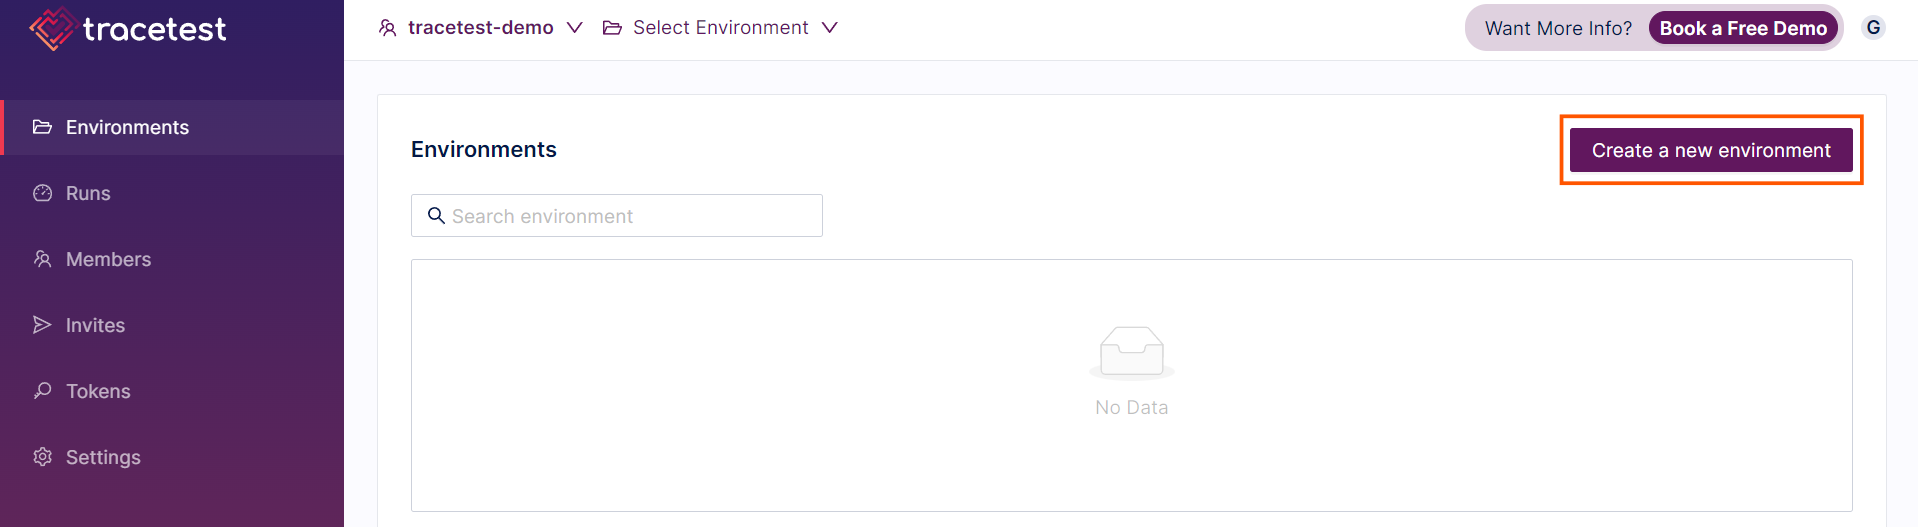
3. Name your Environment and click on "Create."
4. After creating the environment, go to the **Settings** tab and follow the steps on the page to run the Tracetest Agent in your local environment.
```bash
tracetest start --api-key <your-api-key> --environment <your-env>
```
```bash
Version: v1.4.3
Tracetest start launches a lightweight agent. It enables you to run tests and collect traces with Tracetest.
Once started, Tracetest Agent exposes OTLP ports 4317 and 4318 to ingest traces via gRCP and HTTP.
INFO Running in desktop mode...
INFO Starting Agent with name MSI...
Agent is started! Leave the terminal open so tests can be run and traces gathered from this environment.
You can:
> Open Tracetest in a browser to this environment
(Experimental) Open Dashboard
Stop this agent
```
Now that your Tracetest Agent is successfully running, it can fetch all the traces generated by your services and sync them with Tracetest. Let’s start creating actual tests on Tracetest using these traces!
### Trace-based Testing in a Node.js application using Tracetest
Let us use the same `app.js` we created when learning instrumentation in OpenTelemetry.
```javascript
const express = require('express');
const { Pool } = require('pg');
const app = express();
const port = 5000;
const pool = new Pool({
user: 'postgres',
host: 'localhost',
database: 'ecommerce',
password: 'root',
port: 5432,
});
// Routes
app.get('/', (req, res) => {
res.send('Welcome to the E-commerce App!');
});
app.get('/products', async (req, res) => {
try {
const result = await pool.query('SELECT * FROM products');
res.json(result.rows);
} catch (err) {
res.status(500).send(err.message);
}
});
// Start the server
app.listen(port, () => {
console.log(`Server running on http://localhost:${port}`);
});
```
Change `instrumentation.js` with the following code:
```javascript
const opentelemetry = require('@opentelemetry/sdk-node')
const { getNodeAutoInstrumentations } = require('@opentelemetry/auto-instrumentations-node')
const { OTLPTraceExporter } = require('@opentelemetry/exporter-trace-otlp-grpc');
const dotenv = require("dotenv")
dotenv.config()
const sdk = new opentelemetry.NodeSDK({
// OTEL_EXPORTER_OTLP_TRACES_ENDPOINT is passed into "new OTLPTraceExporter" automatically
traceExporter: new OTLPTraceExporter(),
instrumentations: [getNodeAutoInstrumentations()],
serviceName: 'quick-start-nodejs',
})
sdk.start()
```
Create a `.env` file. Get your Tracetest token and environment ID and add the following environment variables:
```bash
# Get the required information here: https://app.tracetest.io/retrieve-token
TRACETEST_TOKEN="<your-tracetest-token>"
TRACETEST_ENVIRONMENT_ID="<your-tracetest-env-id>"
# GRPC
OTEL_EXPORTER_OTLP_TRACES_ENDPOINT="http://localhost:4317/"
# or, use HTTP
# OTEL_EXPORTER_OTLP_TRACES_ENDPOINT="http://tracetest-agent:4318/v1/traces"
```
Finally, run your application as you normally would, but use the `--require` flag to load the instrumentation before the application code.
```bash
node --require ./instrumentation.js app.js
```
The code above will automatically push the traces generated by OpenTelemetry auto-instrumentation to `http://localhost:4317/`, where the Tracetest Agent is running.
Ensure you run the Node.js application and the Tracetest Agent in the same network so the Tracetest Agent can ingest traces successfully.
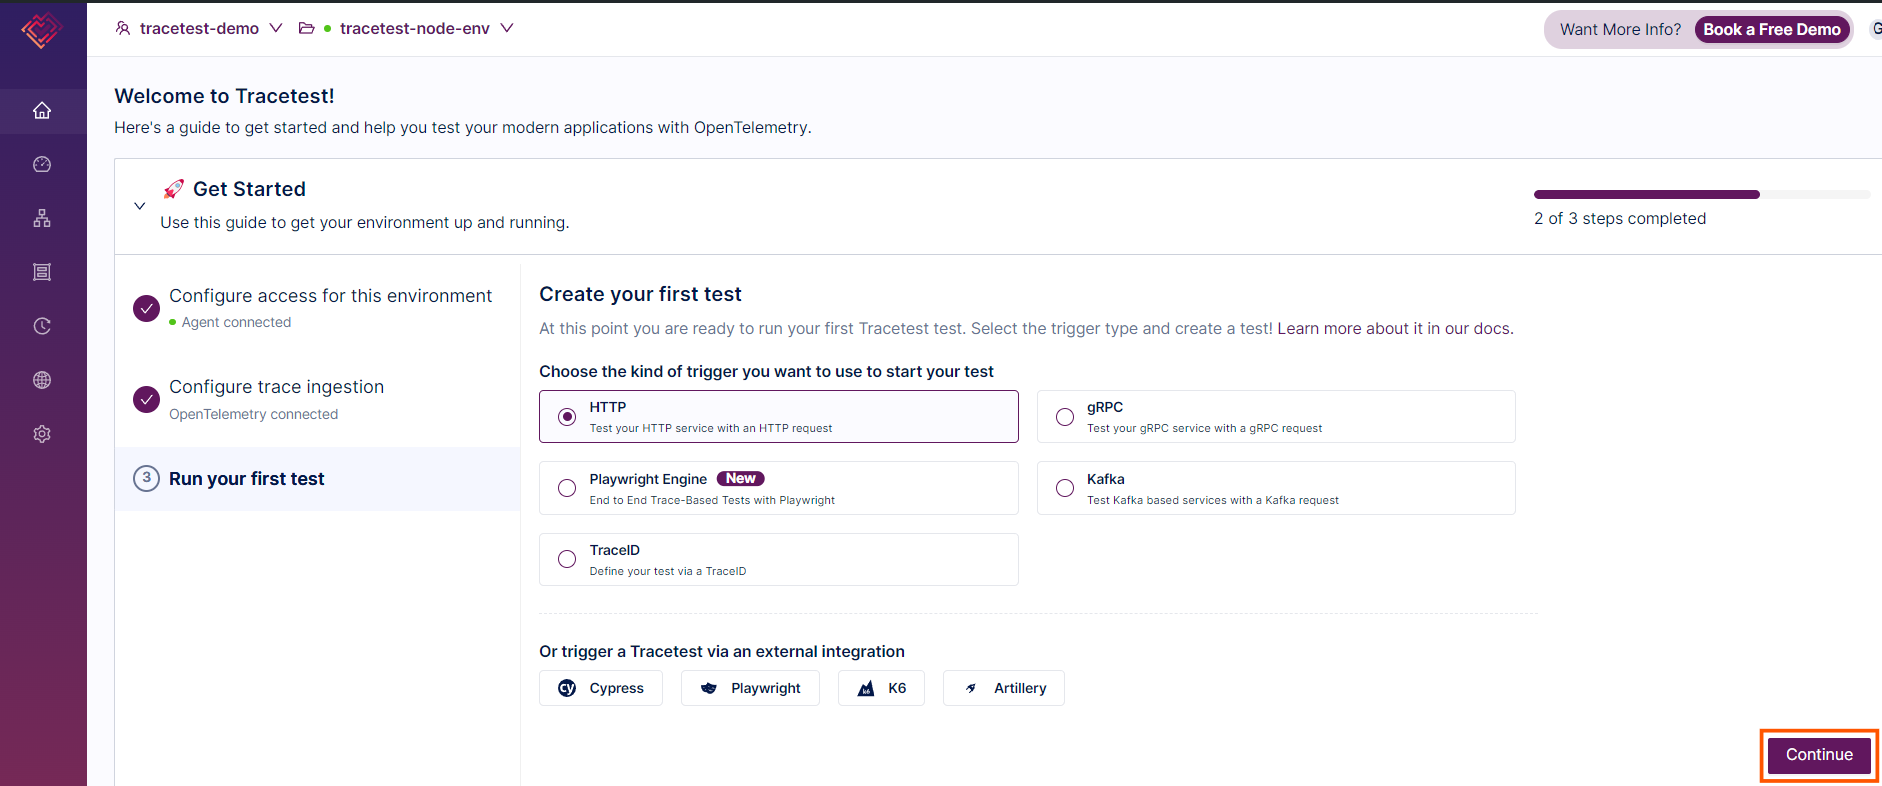
Now, return to Tracetest to validate and test the application with distributed traces. In the “Run your first test” section, choose the trigger as HTTP and click on continue.
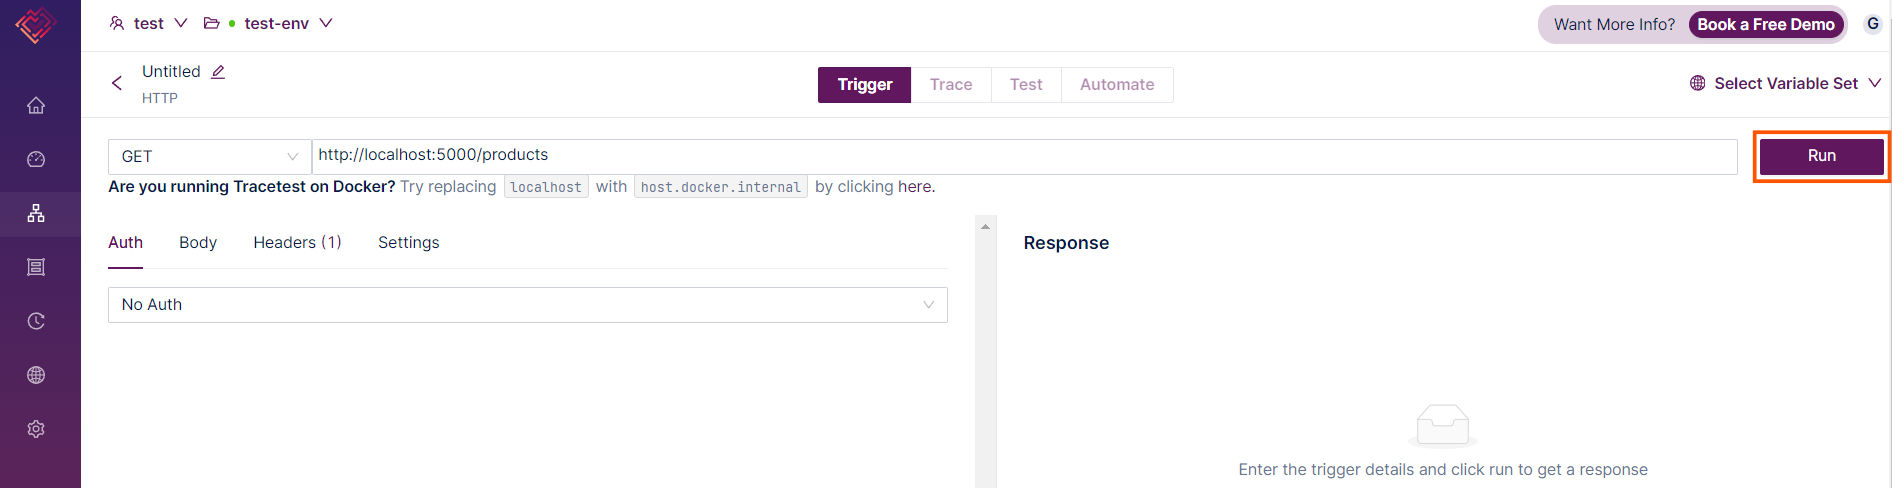
In the next screen, enter the URL of your server and click on “Run.”
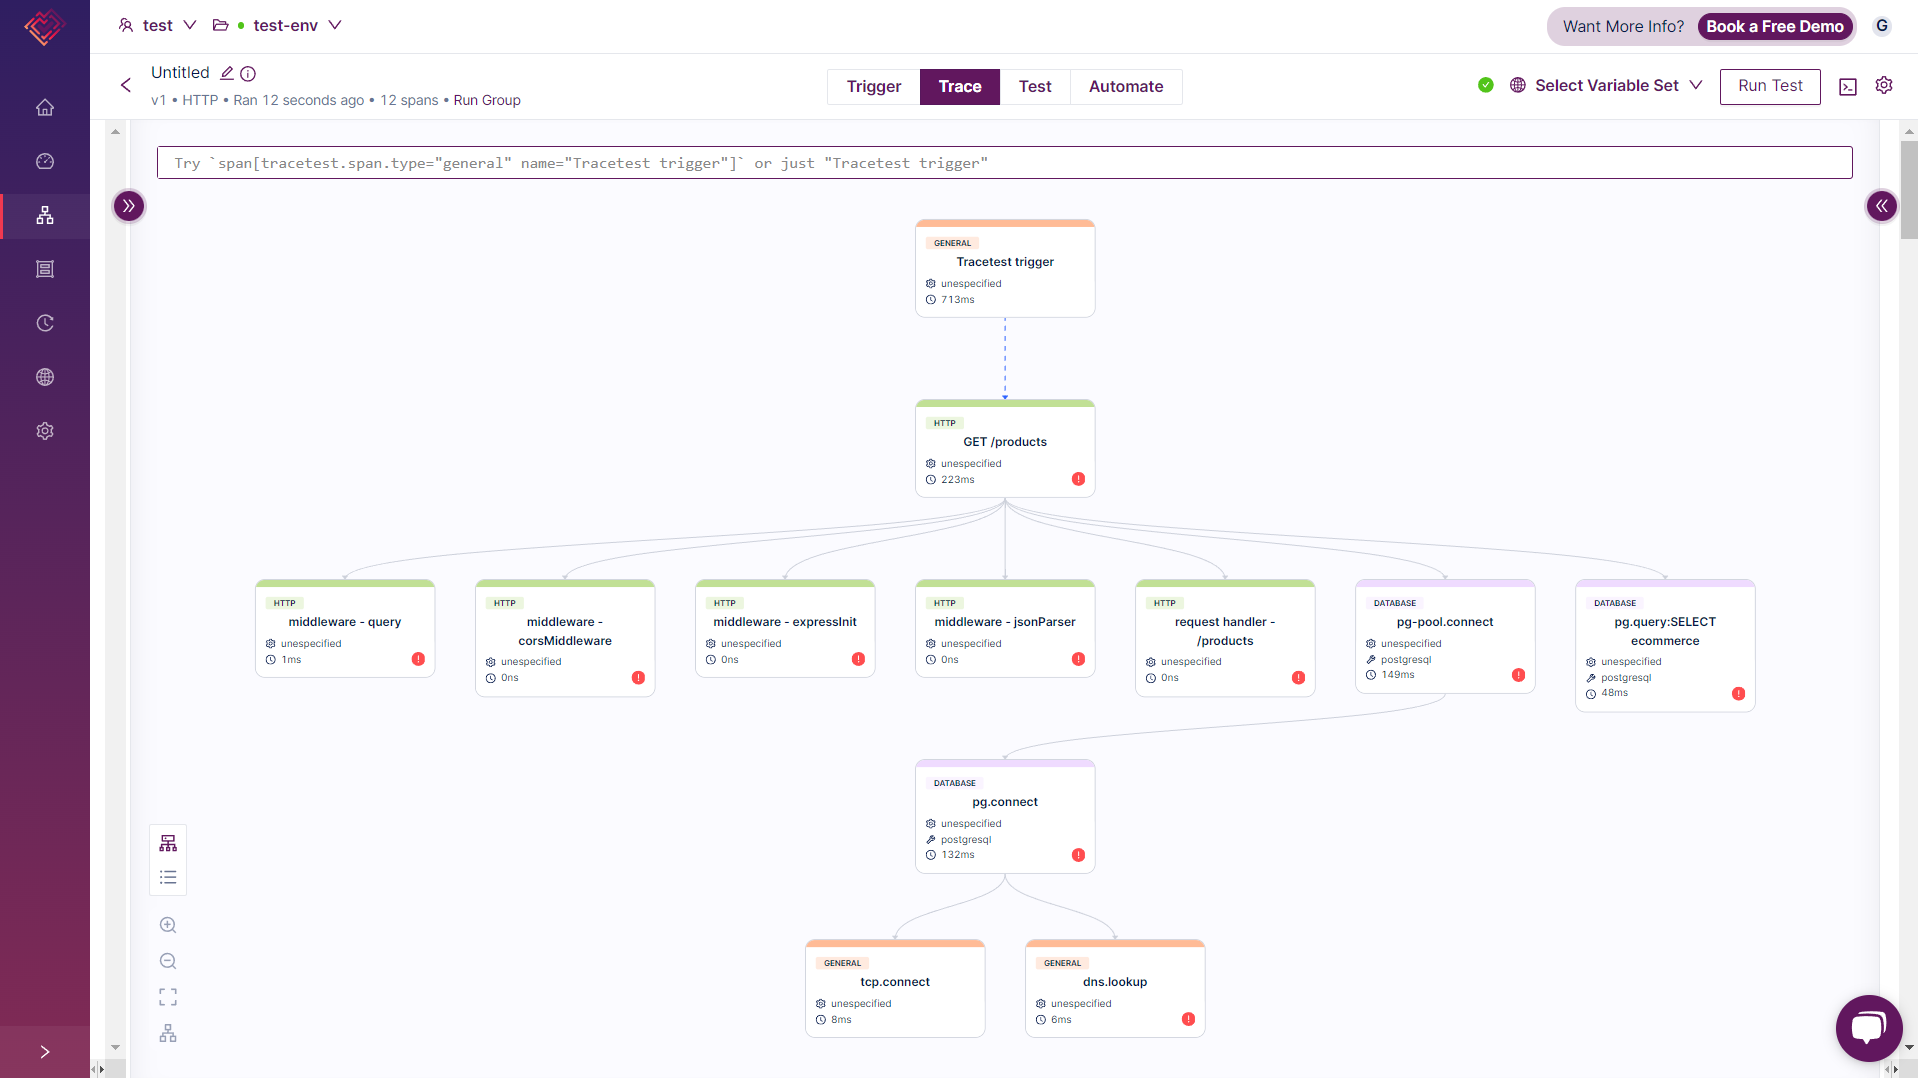
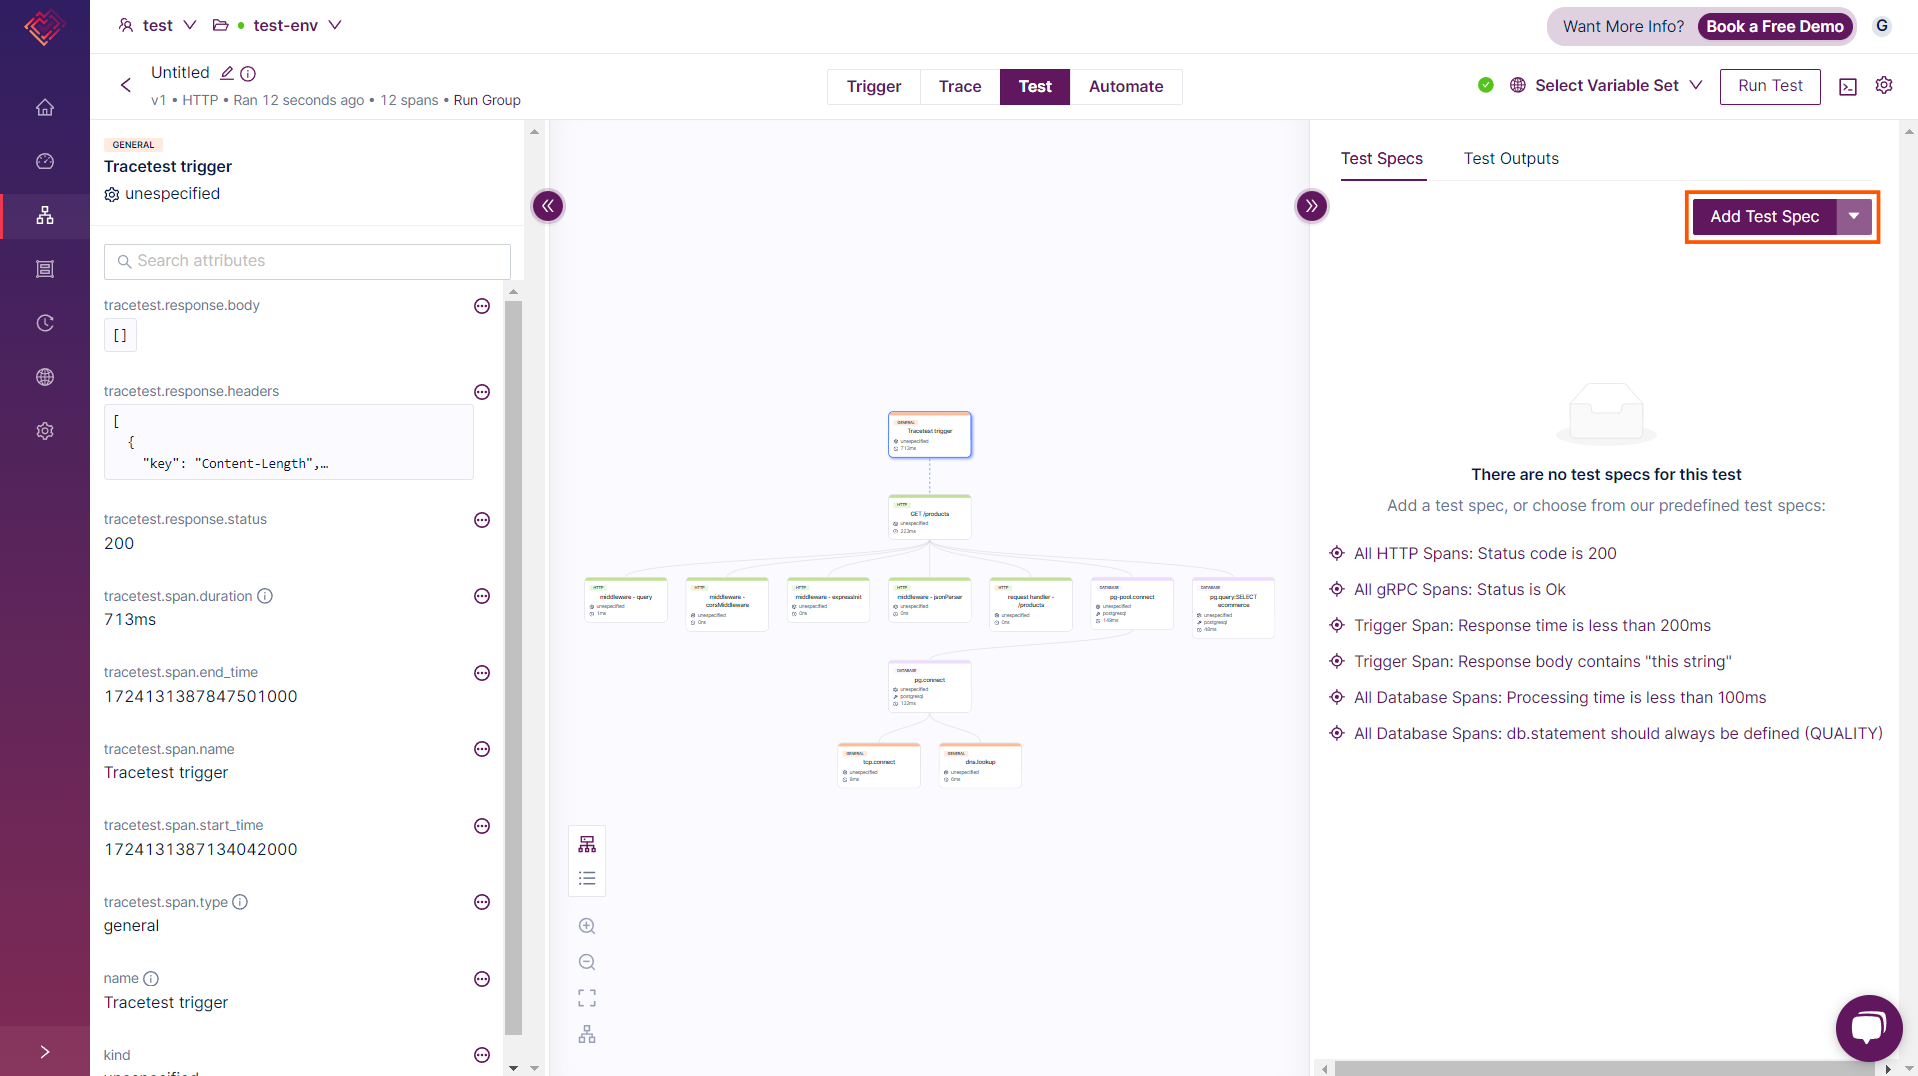
When you go to the "Trace" tab in Tracetest, you’ll see a list of spans, which are individual units of work within a trace. Each span represents a specific operation or step in your application's workflow, such as an HTTP request, a database query, or a function execution.
Tracetest simplifies the view of these spans by organizing them in a clear, hierarchical structure, making it easy to follow the sequence of operations.
Switch to the "Test" tab to start adding tests on every trace span. Click the "Add Test Spec" button.
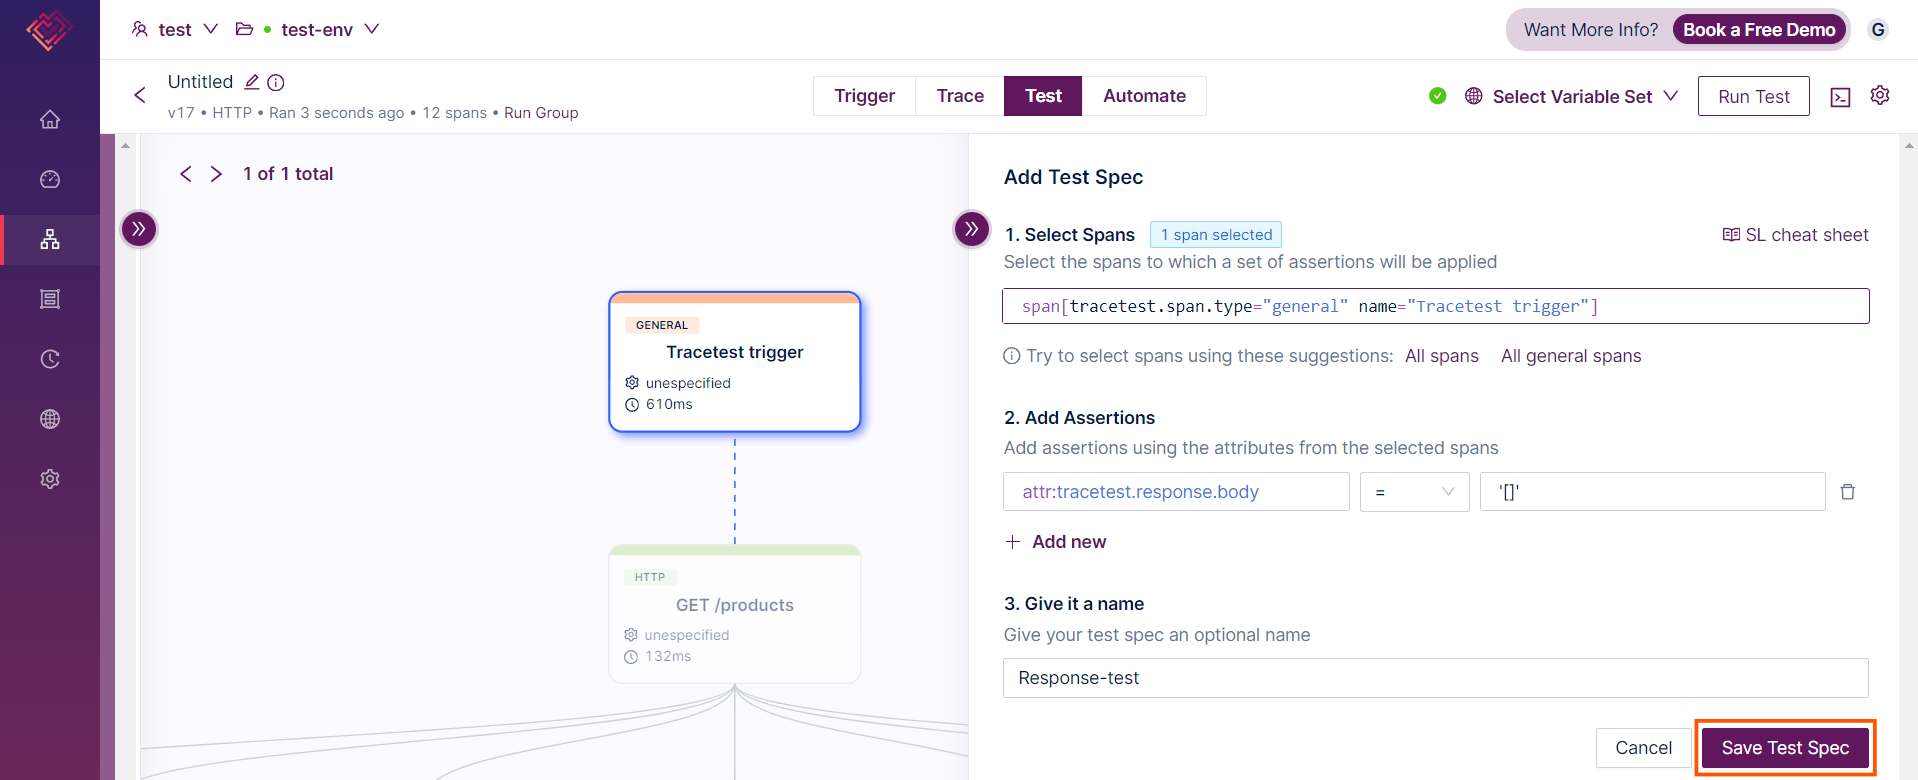
Let’s add a test to validate the server's response. Start by selecting the "Tracetest trigger" span, which represents the initial action in your test. In the "Add Assertions" section, choose the attribute `attr.response.body`. This allows you to check specific details of the server's response. Enter the expected value, which in our case is `[]`, since the server returns an empty array.
Give the test spec a name and save it. Once saved, Tracetest will apply this spec to the test run whenever you trigger it, checking if the application behaves as expected according to the criteria you’ve set.
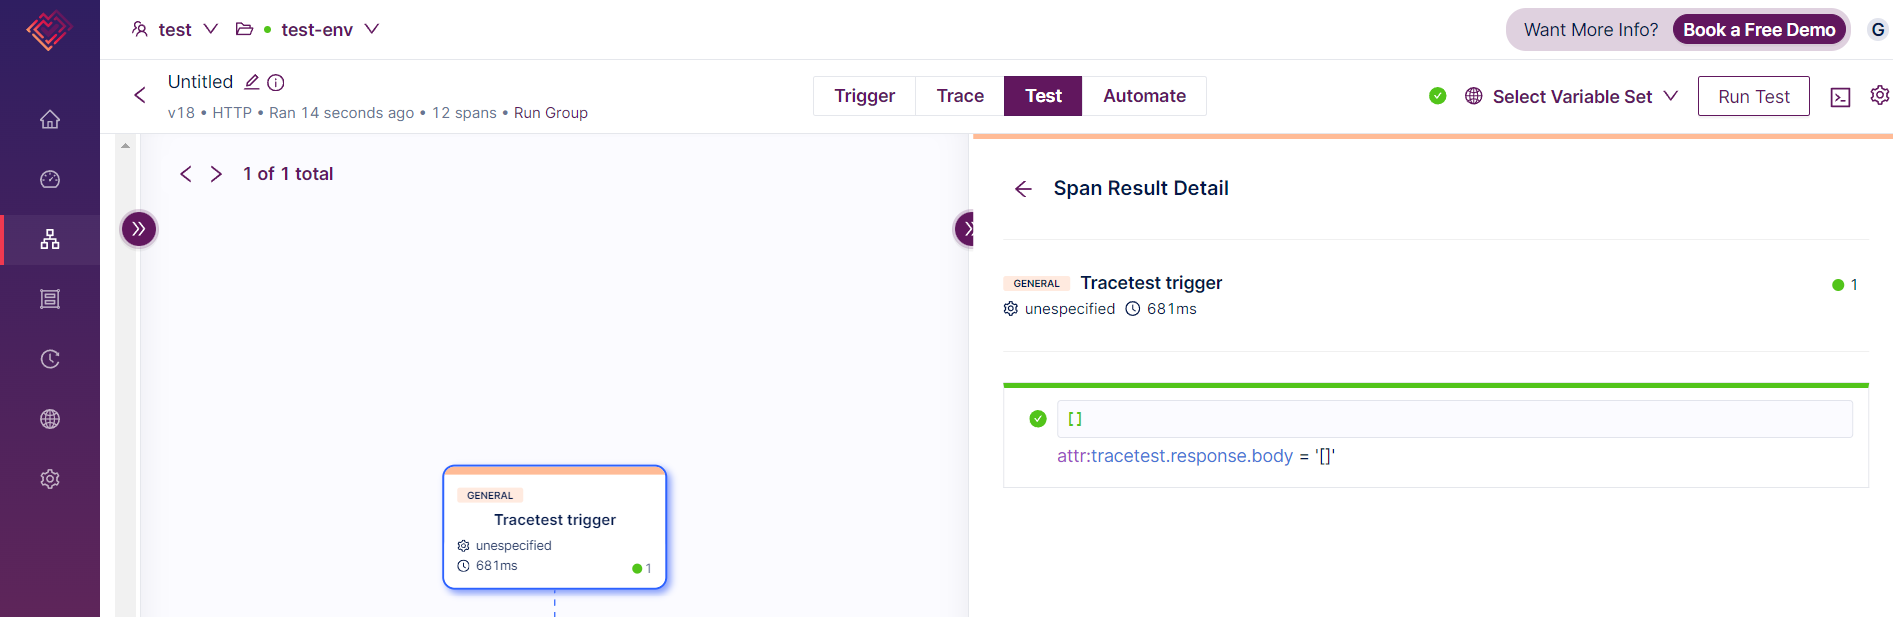
Run the test again and verify if the test spec passed or failed.
Similarly, let's create tests for an API. Select an API trace and add assertions to verify key aspects of the API's behavior. For example, you might check that the method used is "GET". You can also validate the route to ensure it contains the expected data or matches a specific format. By setting these assertions, you ensure that the API behaves as intended and meets your functional requirements.
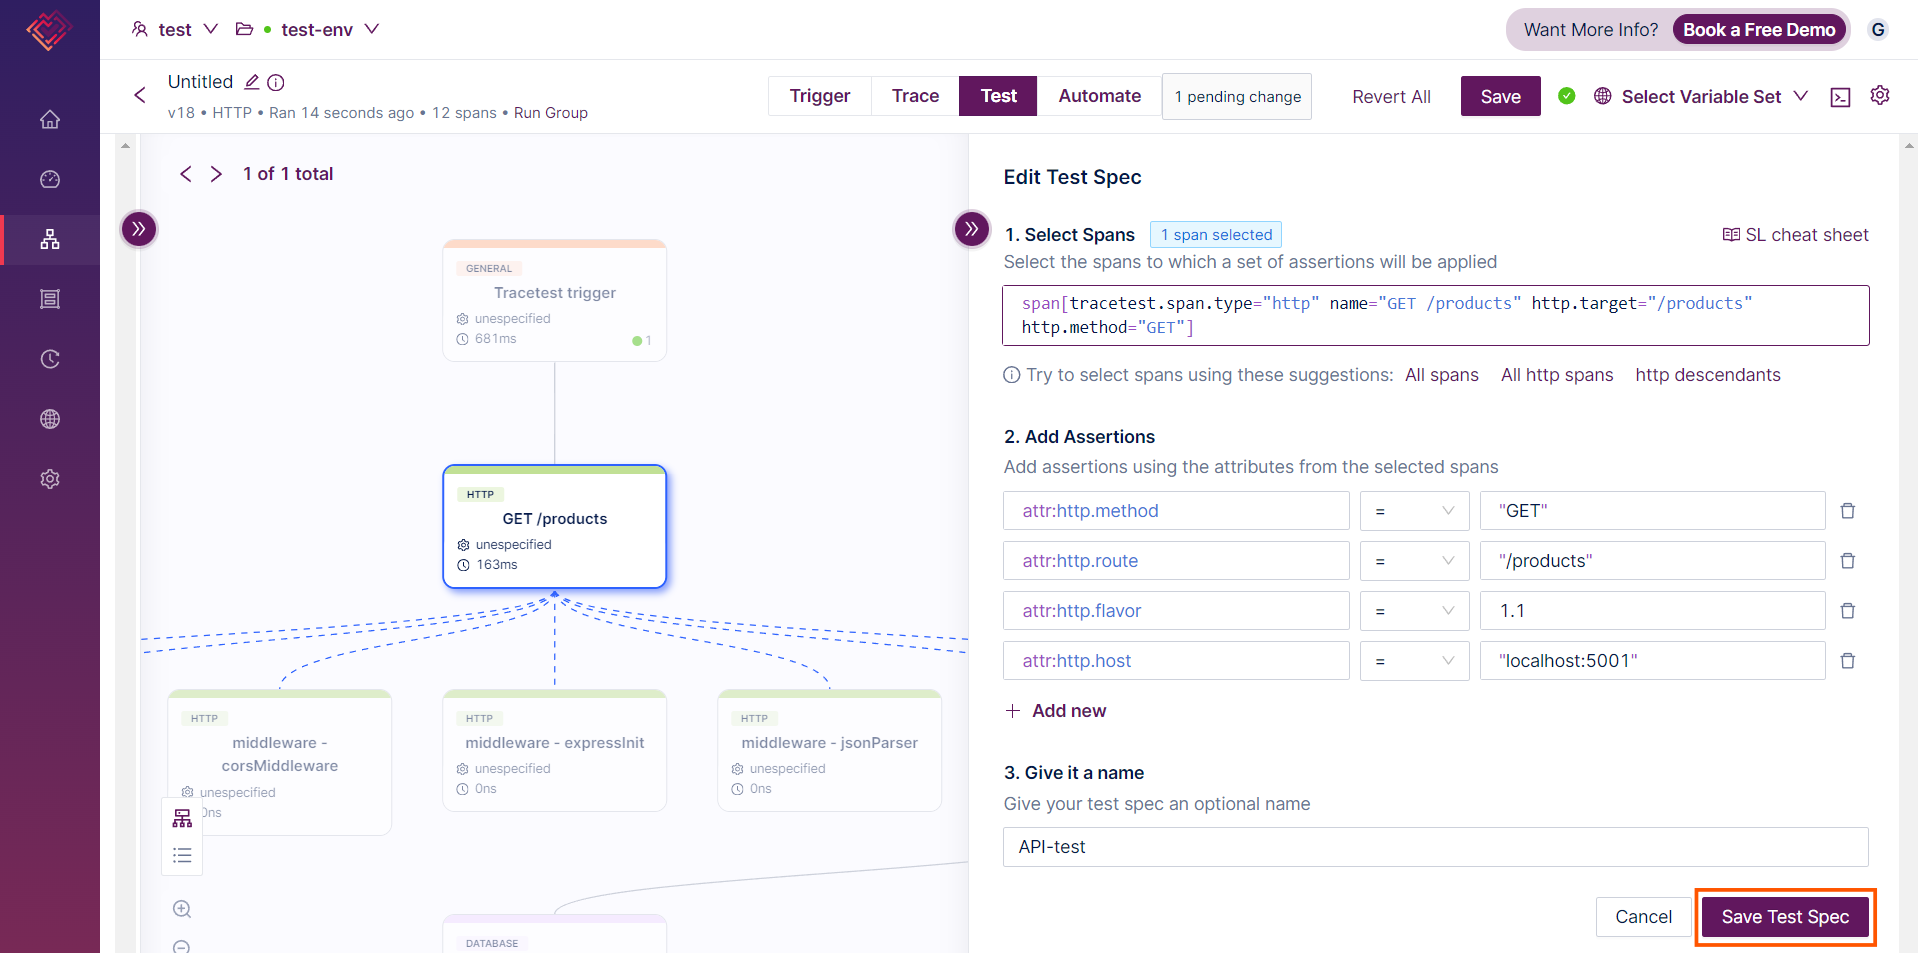
Save the test spec and run tests again:
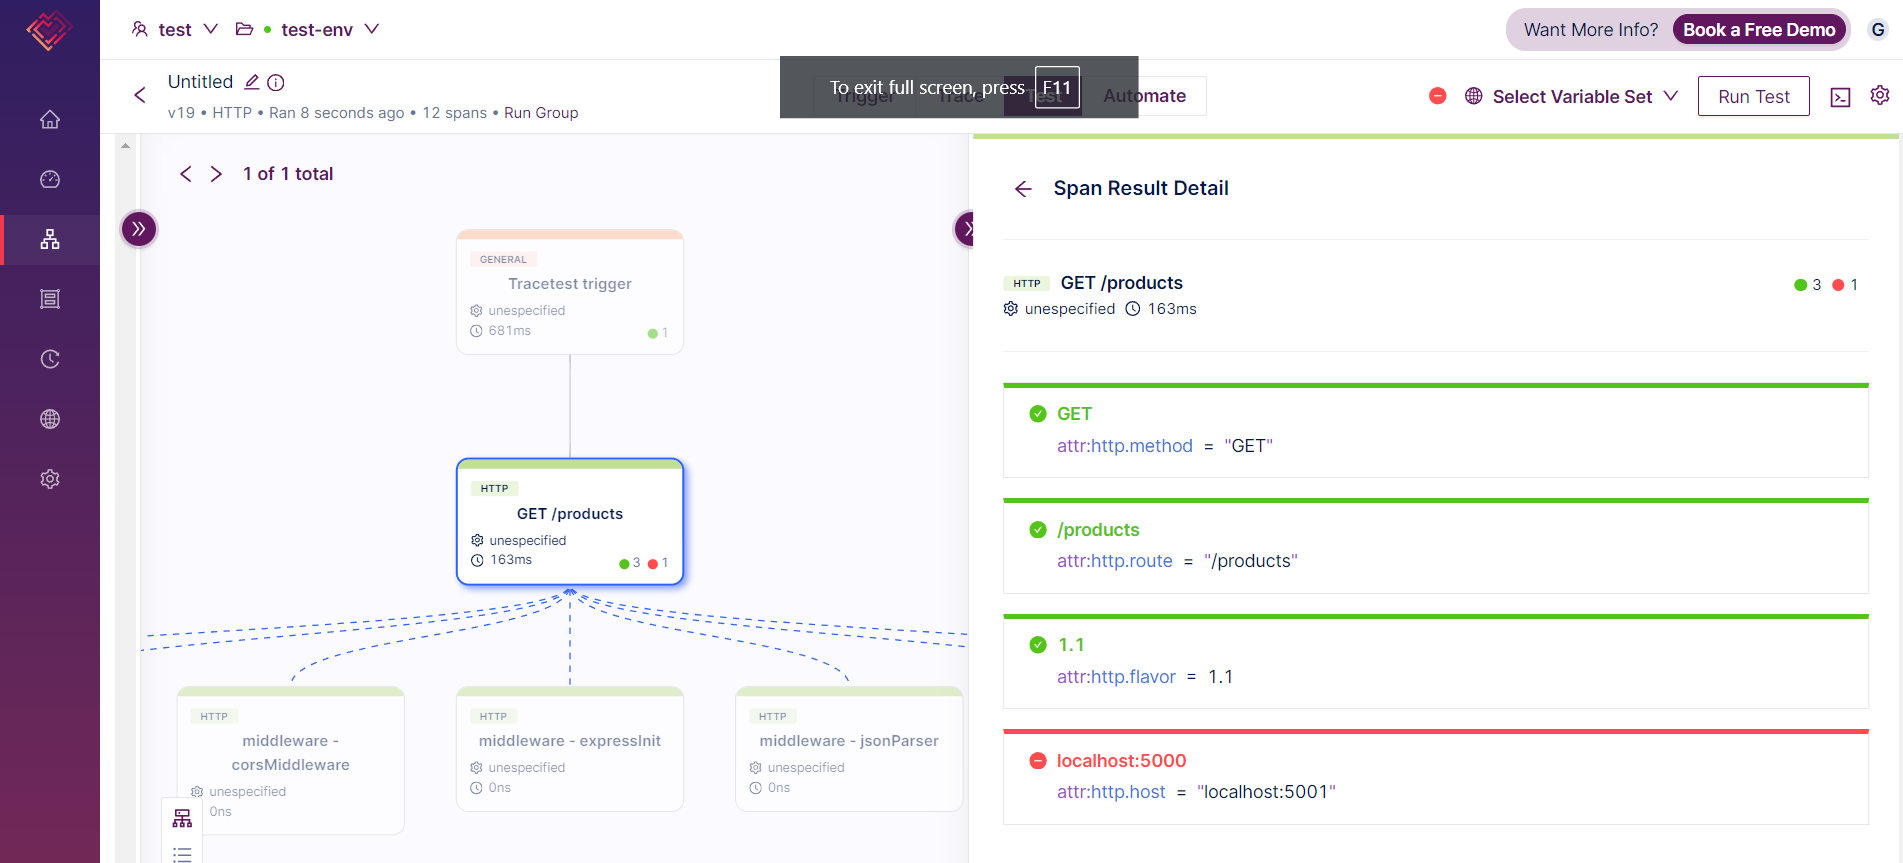
In the above image, you can see that one of the assertions failed the test because the expected value `localhost:5001` does not match the actual value `localhost:5000`.
Let’s create assertions for database connection next.
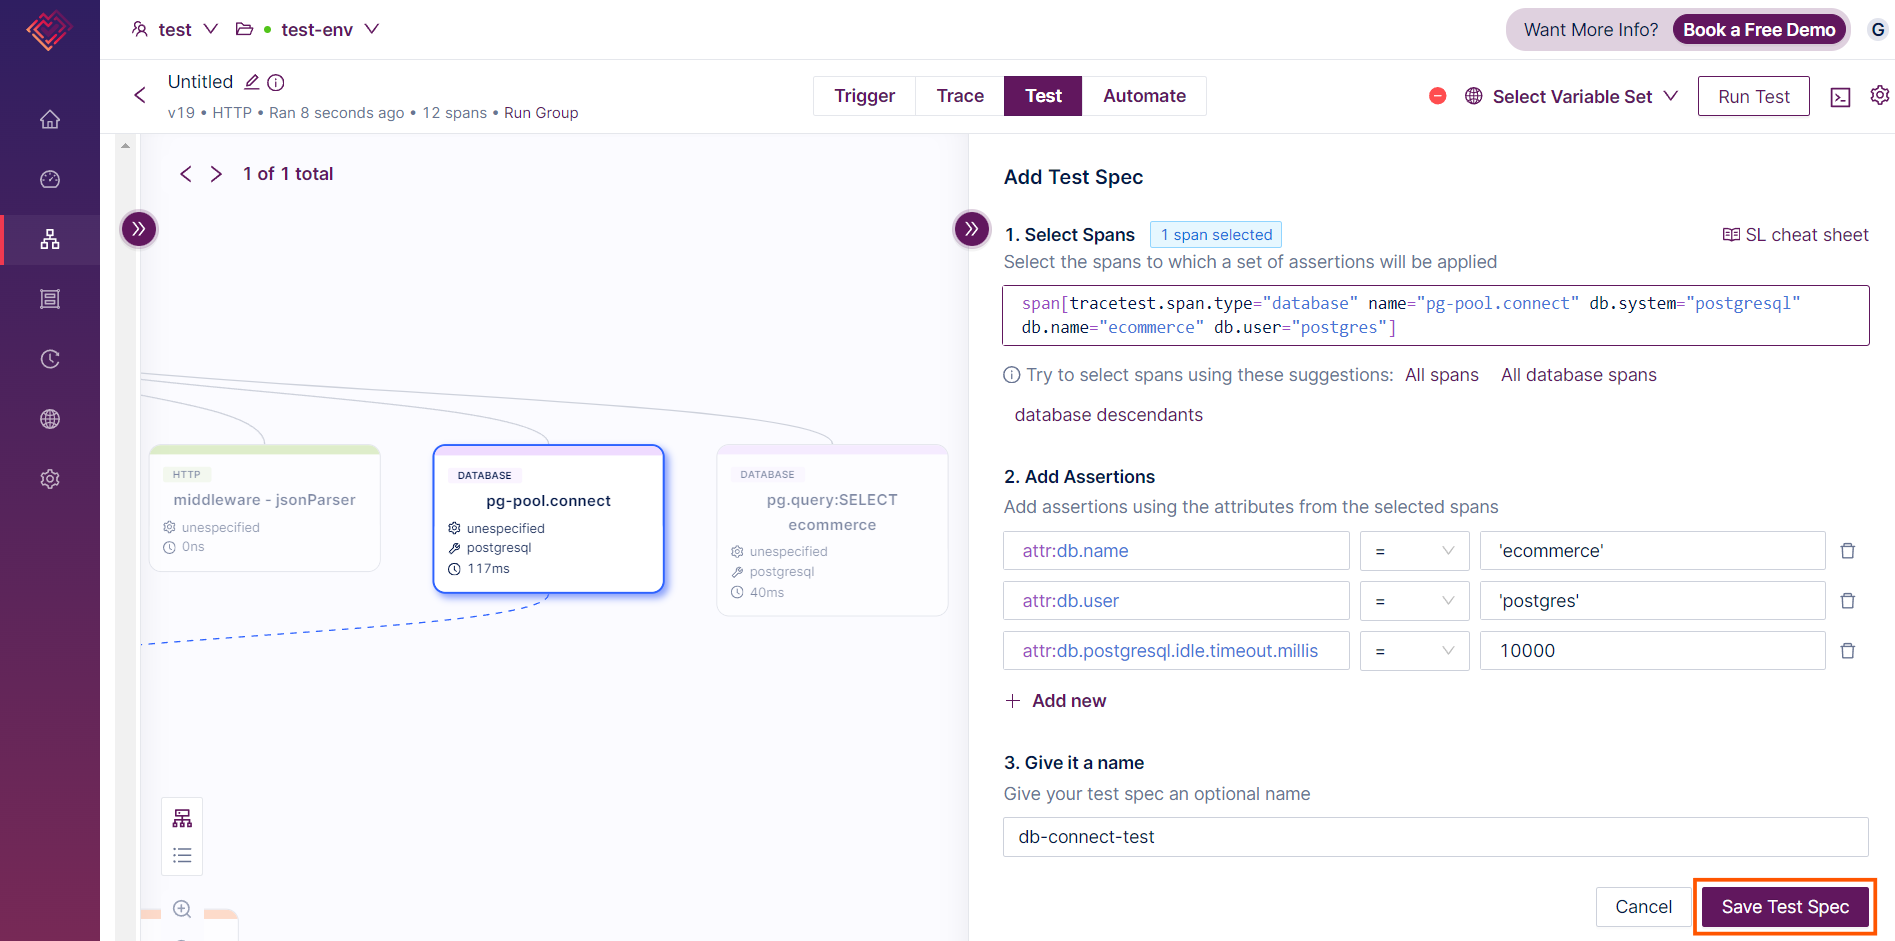
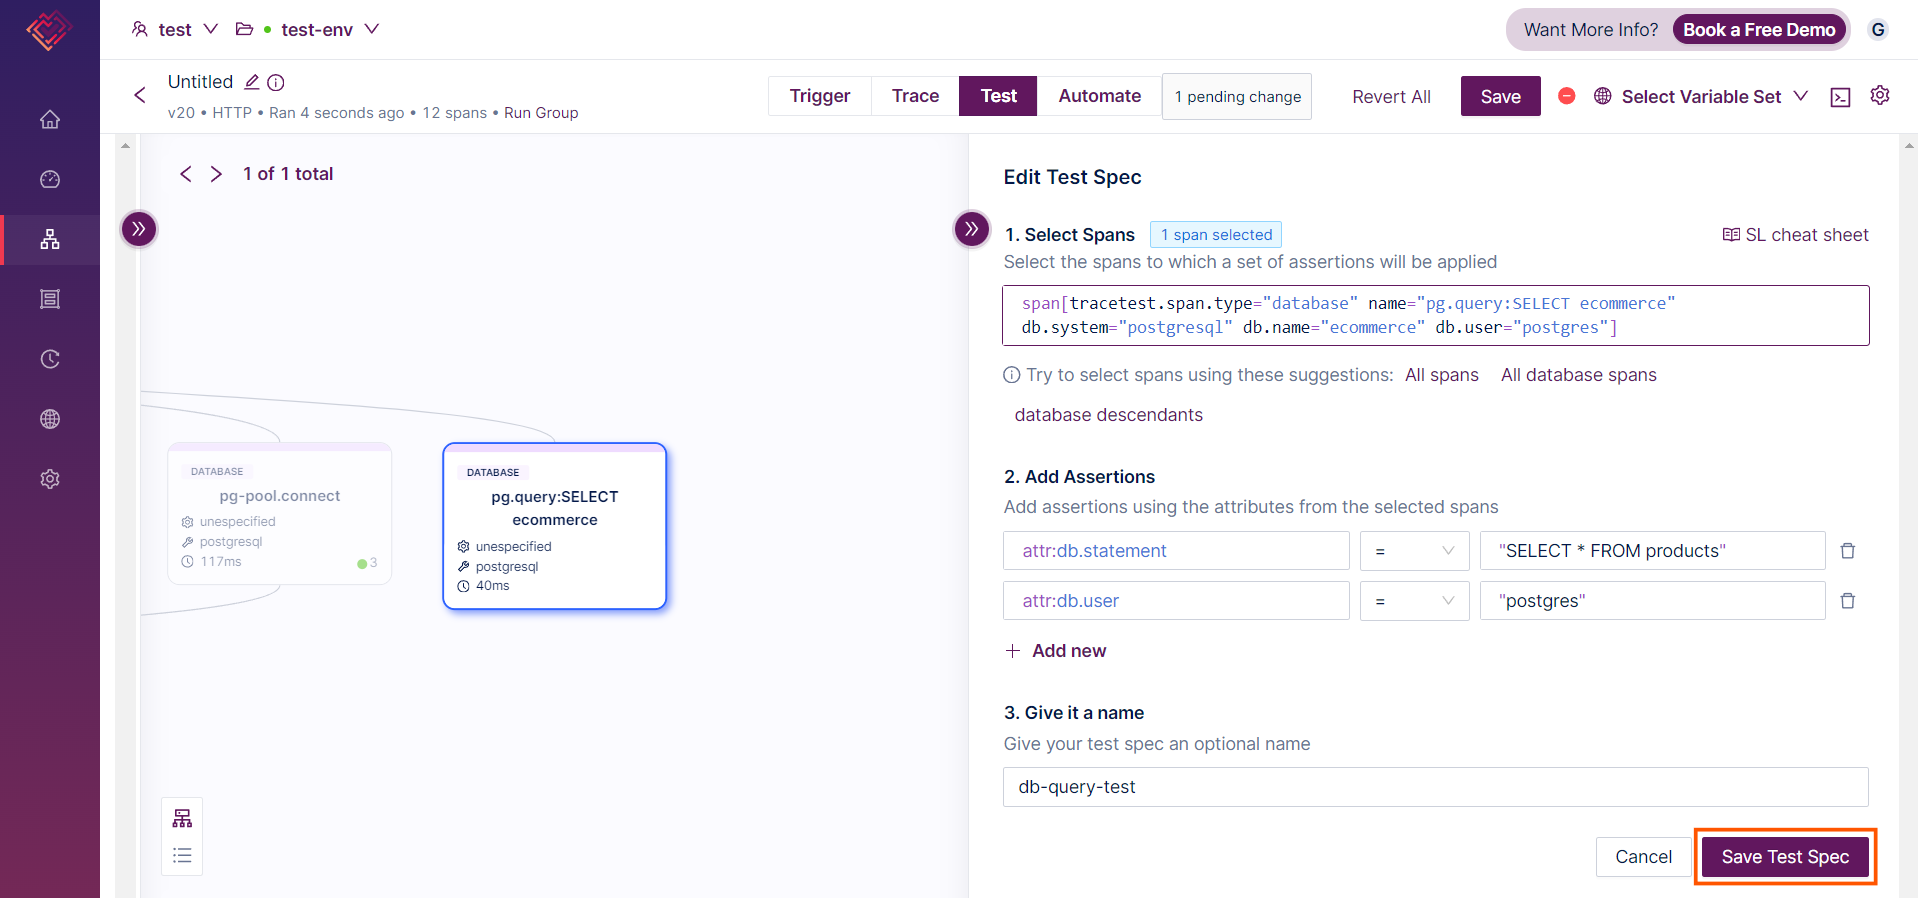
Now, add tests for database queries by selecting the trace that corresponds to your database operations. Focus on specific spans related to the database interactions, such as queries or transactions.
Run the test after creating all the test specs to know how many tests pass and how many fail.
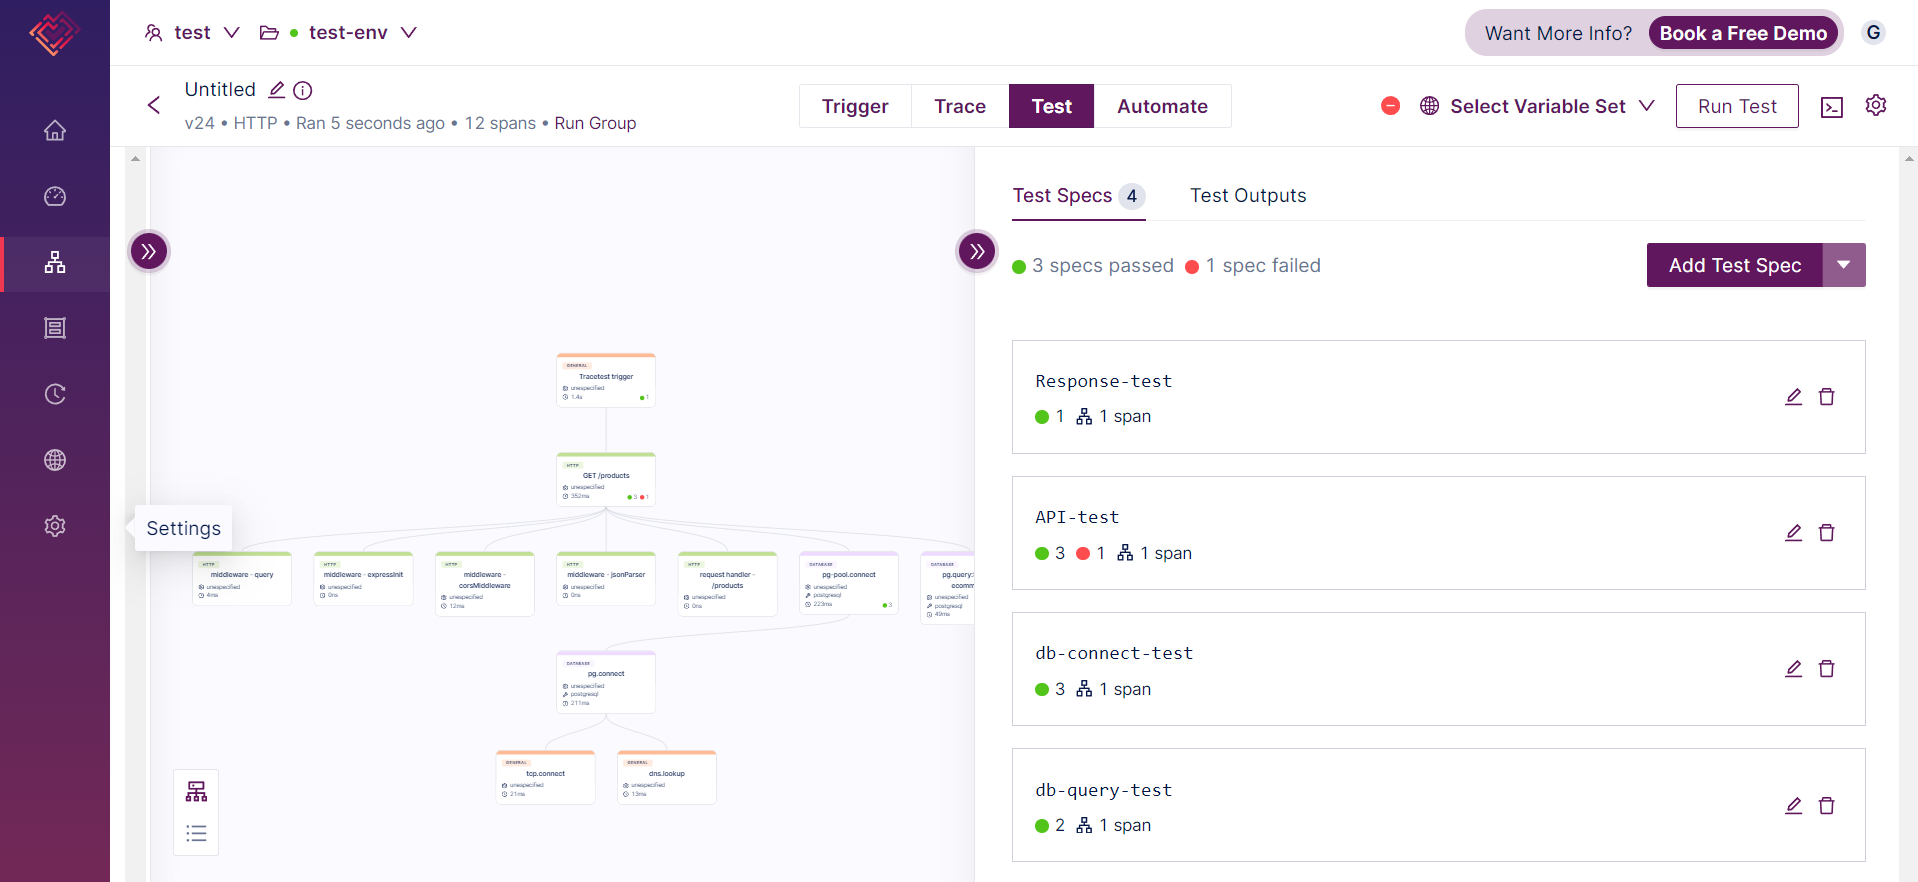
You have successfully tested the application in Tracetest using OpenTelemetry traces.
## Wrapping Up: Trace-Based Testing for Easier Validation
Today, you learned about how trace-based testing with OpenTelemetry and Tracetest can simplify how you validate complex systems. Tracing offers a complete view of a request’s journey, far beyond what logs can provide. By adding Tracetest to your workflow, you’re not just monitoring—you’re testing every step of your application’s process.
While adopting trace-based testing might seem like a shift, the advantages are huge. With Tracetest, you’re not only ensuring system reliability but also gaining confidence that everything works as intended before hitting production.
## Frequently Asked Questions
### What is OpenTelemetry used for?
OpenTelemetry is an open-source observability framework used to collect, process, and export telemetry data (traces, metrics, and logs) from applications. It helps developers and operations teams monitor the performance of distributed systems, troubleshoot issues, and gain insights into how their applications are functioning in real time.
### What is the difference between OpenTelemetry and Prometheus?
OpenTelemetry and Prometheus serve different but complementary purposes in observability. OpenTelemetry is focused on collecting and exporting traces, metrics, and logs from applications, providing a unified way to instrument and observe systems.
On the other hand, Prometheus is a monitoring and alerting tool designed explicitly for metrics collection and querying. While OpenTelemetry can generate and export metrics, Prometheus specializes in scraping and storing these metrics for monitoring purposes.
They can be used together, with OpenTelemetry generating the metrics and Prometheus storing and analyzing them.
### What is the “trace” in trace-based testing?
In testing, a trace refers to a record of the execution path of a request or transaction as it moves through different components of a system. Tracing helps in understanding the flow of data, identifying bottlenecks, and ensuring that each step in the workflow is executed correctly. In trace-based testing, these traces are used to validate that not only the final output but each part of the system’s process works as intended.
## Try Tracetest Yourself!
Last, but not least, do you want to learn more about Tracetest and what it brings to the table? Check the [docs](https://docs.tracetest.io) and try it out by [signing up](https://app.tracetest.io/) today!
Also, please feel free to join our [Slack community](https://dub.sh/tracetest-community), give [Tracetest a star on GitHub](https://github.com/kubeshop/tracetest), or schedule a [time to chat 1:1](https://calendly.com/ken-kubeshop/tracetest-walkthrough).
.jpg)
.avif)
.avif)