
Trace-based testing cloud-native apps with AWS X-Ray + Tracetest
.avif)
%20(1).avif)
Distributed tracing with AWS X-Ray combined with Tracetest allows complete end-to-end testing of processes for Lambda, Fargate, EKS, and EC2.
Table of Contents
When working with cloud-native applications, having a clear understanding of what every part of the system is doing can become quite complex. Teams might struggle to correctly have accurate integration tests that could validate entire flows because they usually only focus on the user-facing parts of the system like APIs, WebSockets, and FE apps, and their immediate response. Therefore, testing back-end processes like messaging queues, ETL (Extract, Transform, and Load) tasks and any type of asynchronous process can become a pain point.
That’s where the power of distributed tracing alongside AWS X-Ray comes to play. Enabling teams to add automatic and/or custom checkpoints, called [spans](https://opentelemetry.io/docs/concepts/signals/traces/#spans), that generate step-by-step details for a complete end-to-end process, a [distributed trace](https://opentelemetry.io/docs/concepts/signals/traces/), from anywhere in your distributed cloud infrastructure. Even if you’re using services on AWS like [Lambda](https://aws.amazon.com/lambda/), [Fargate](https://aws.amazon.com/fargate/), [EKS](https://aws.amazon.com/eks/), [EC2](https://aws.amazon.com/ec2/), or others.
Then, ultimately combining this with the power of Tracetest allows teams to run automatic trace-based tests by defining test specs and assertions against the data from distributed traces.
> Check out this [hands-on basic X-Ray recipe](https://docs.tracetest.io/examples-tutorials/recipes/running-tracetest-with-aws-x-ray) with Tracetest and Docker!
After you finish reading, you’ll learn how to combine AWS X-Ray’s tracing capabilities with the power of Tracetest’s trace-based testing!
## What is AWS X-Ray?
[AWS X-Ray](https://aws.amazon.com/xray/) is a distributed tracing system included in the [AWS](https://aws.amazon.com/) cloud platform, that enables developers to monitor, analyze, and debug distributed applications running on AWS infrastructure. It provides information on how an application is performing and allows developers to identify and resolve performance issues quickly. X-Ray traces requests as they travel through an application, providing a comprehensive view of its performance. It also integrates with other AWS services, such as Amazon EC2 and AWS Lambda, providing developers with a complete view of their applications.
## What is Tracetest?
[Tracetest](https://tracetest.io/) is an [open-source project](https://github.com/kubeshop/tracetest), part of the CNCF landscape. It allows you to quickly build integration and end-to-end tests, powered by your OpenTelemetry traces.
Tracetest uses your existing OpenTelemetry traces to power trace-based testing with assertions against your trace data at every point of the request transaction. You point Tracetest to your existing trace data source, or send traces to Tracetest directly!
Tracetest makes it possible to:
- Define tests and assertions against every single microservice that a transaction goes through.
- Work with your existing distributed tracing solution, allowing you to build tests based against your already instrumented system.
- Define multiple transaction triggers, such as a GET against an API endpoint, a GRPC request, etc.
- Define assertions against both the response and trace data, ensuring both your response and the underlying processes worked correctly, quickly, and without errors.
- Save and run the tests manually or via CI build jobs with the Tracetest CLI.
### Why is the Tracetest Integration with X-Ray Important?
AWS X-Ray is commonly used to provide observability into distributed systems that have multiple moving pieces, some using queues, AWS Lambda functions, calling external services, and/or storing information in databases.
Therefore, **combining it with Tracetest allows you to get more out of the instrumentation work done to introduce observability into your system**. It **enables trace-based testing**, which can be used to **run assertions against any part of the generated trace**, allowing you to have automated ways of **validating your distributed system’s behavior using real-life inputs** as well as **improving the overall test coverage**.
You can also utilize these tests as part of your CI/CD process to ensure system functionality and to catch regressions.
## Try Tracetest with AWS X-Ray
One of the core values of the Tracetest team and the project, in general, is to always aim for flexibility and allow teams to use Tracetest as part of their ecosystem with minimal disruption. In this blog post, we are not only showing you one way to combine X-Ray and Tracetest but rather three different use cases so you can choose what’s best for your team.
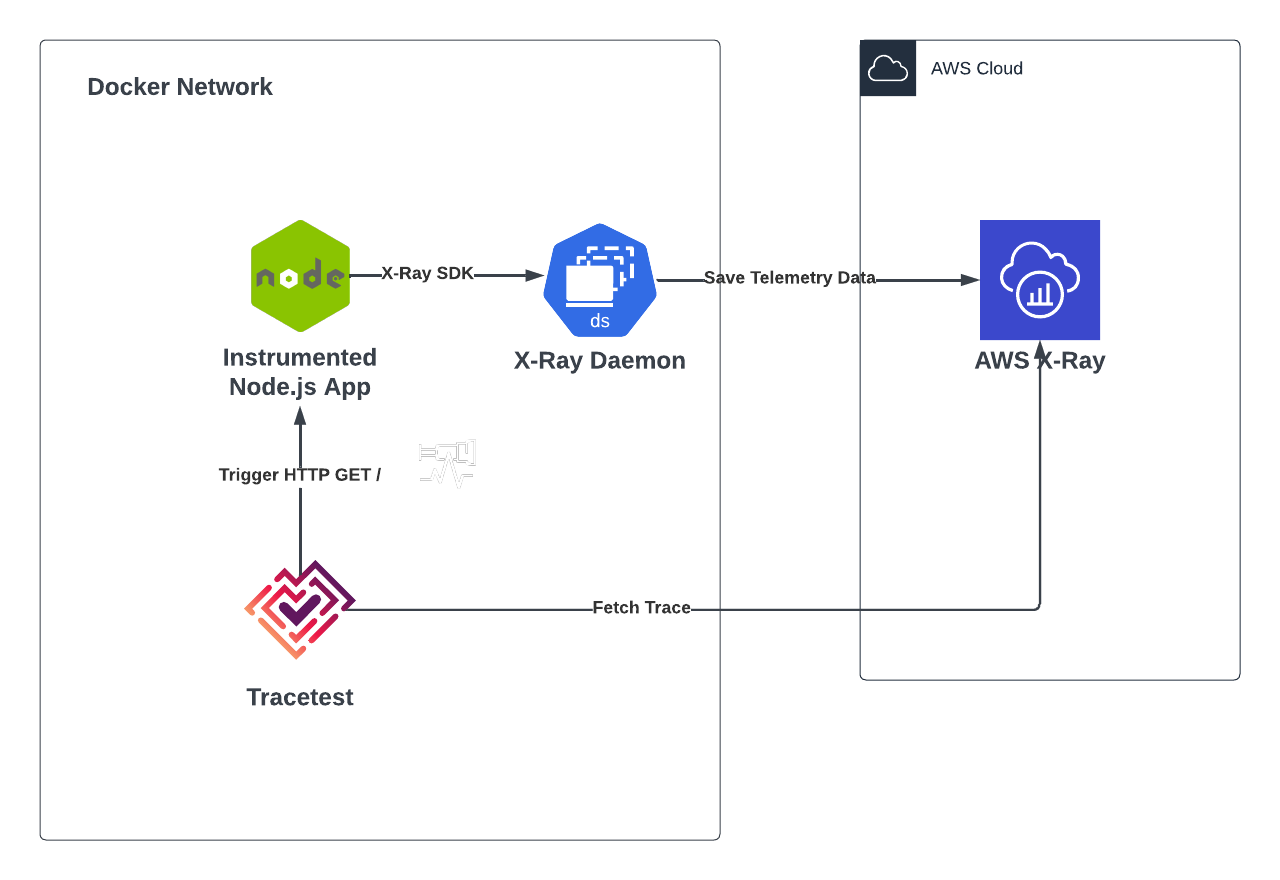
1. **Node.js Instrumented API with X-Ray SDK, X-Ray Daemon, and Tracetest.** A basic Express server that sends an HTTP GET request to [amazon.com](http://amazon.com) and uses the [AWS X-Ray SDK](https://docs.aws.amazon.com/xray/latest/devguide/xray-sdk-nodejs.html) auto instrumentation, the [X-Ray Daemon](https://docs.aws.amazon.com/xray/latest/devguide/xray-daemon.html) as a middleware to send trace data to AWS, and Tracetest for trace-based testing.
2. **Node.js Instrumented API with AWS X-Ray SDK, ADOT, and Tracetest.** A basic Express server that sends an HTTP GET request to [amazon.com](http://amazon.com) and uses the AWS X-Ray SDK auto instrumentation, the [AWS Distro for OpenTelemetry](https://aws.amazon.com/otel/) as a middleware to send tracing data to AWS, and Tracetest for trace-based testing.
3. **The Pokeshop API with Otel Instrumentation, ADOT, X-Ray, and Tracetest.** Using Tracetest's own distributed [Node.js Pokemon demo API](https://docs.tracetest.io/live-examples/pokeshop/overview), instrumented using [official OpenTelemetry packages](https://opentelemetry.io/), the AWS Distro for OpenTelemetry as middleware to send tracing data to AWS, and Tracetest for trace-based testing.
To run trace-based testing with AWS X-Ray, you need to install the following tools:
1. [AWS CLI](https://aws.amazon.com/cli/)
2. [AWS Access Key Credentials](https://docs.aws.amazon.com/powershell/latest/userguide/pstools-appendix-sign-up.html)
3. [Tracetest CLI](https://docs.tracetest.io/getting-started/installation)
## Node.js Instrumented API with X-Ray SDK, X-Ray Daemon, and Tracetest
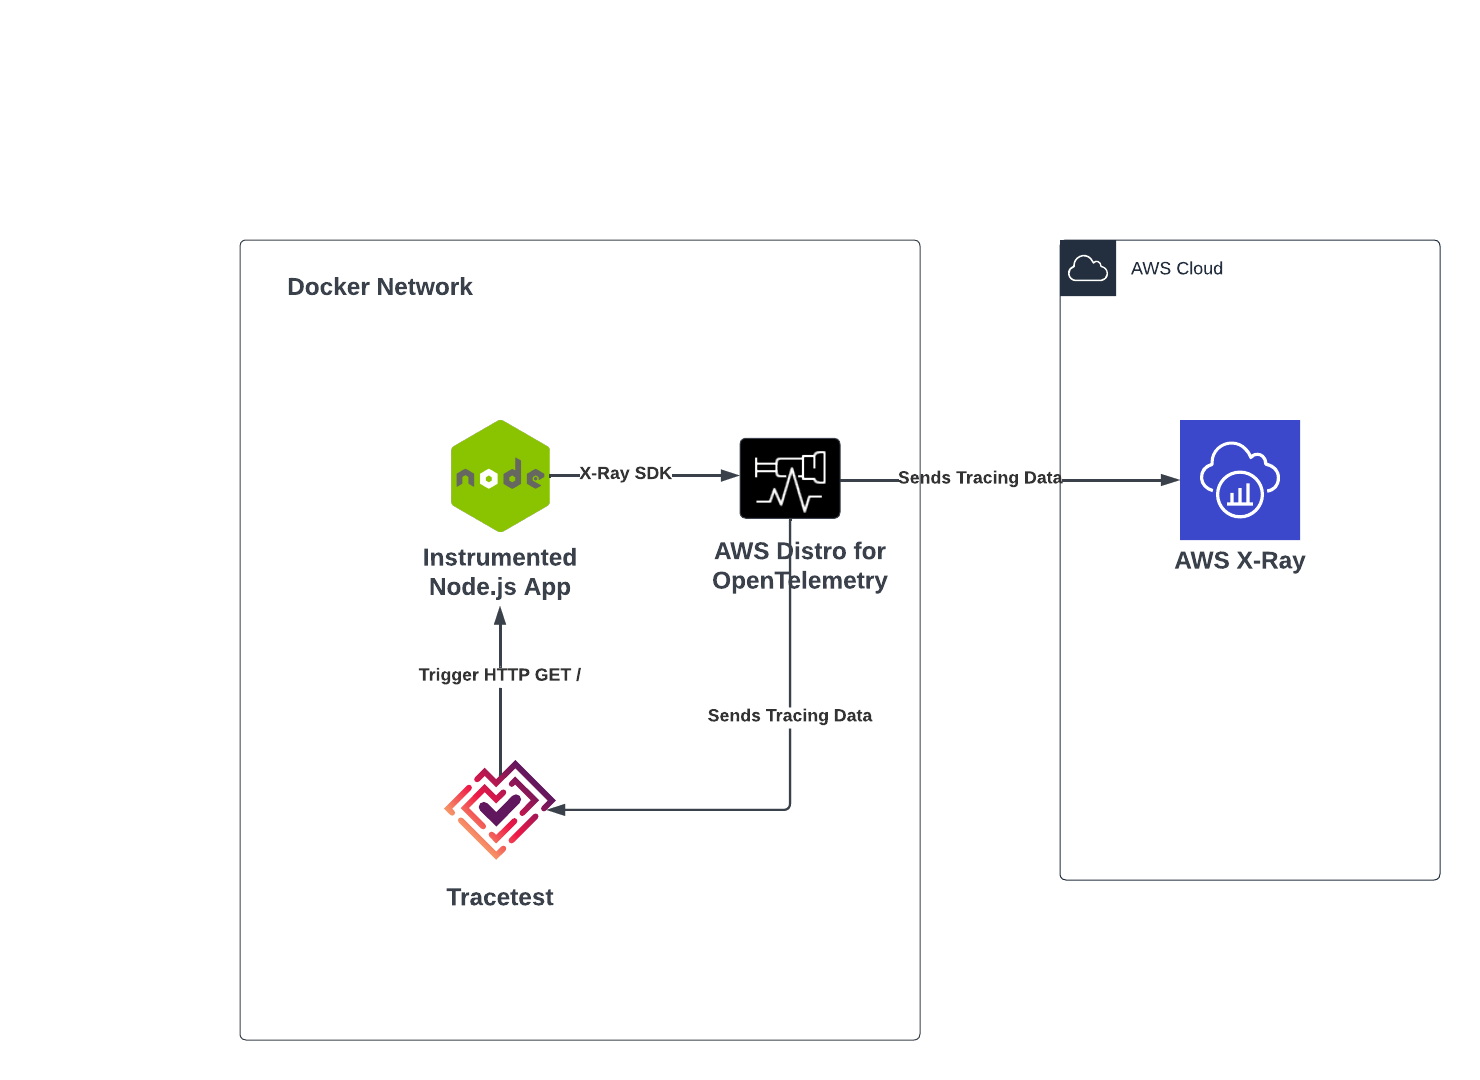
In this use case, we have a dockerized Node.js Express application that listens for a GET request on the `/http-request` route, triggers a request to [amazon.com](http://amazon.com), and returns a response based on the request.
This demo will showcase the following:
1. Instrumenting the Node.js app using the AWS X-Ray SDK
2. Sending trace data to AWS Cloud using the AWS X-Ray daemon
3. Triggering, visualizing, and applying trace-based testing with Tracetest.
To better follow this use case you can download and run the example from the Tracetest GitHub [repo](https://github.com/kubeshop/tracetest) by following these steps:
```
git clone https://github.com/kubeshop/tracetest.git
cd examples/tracetest-amazon-x-ray
docker compose up
```
### Instrumenting the Node.js Express App
The first task at hand is to create the instrumented Node.js App using the AWS X-Ray SDK. This can be achieved by:
1. Including the [aws-x-ray-sdk](https://www.npmjs.com/package/aws-xray-sdk) module in the project.
2. Configuring the SDK to wrap and generate automatic telemetry data for packages ([https](https://nodejs.org/api/https.html), [aws-sdk](https://www.npmjs.com/package/aws-sdk)).
3. Updating the daemon endpoint to send tracing data.
4. Creating the express routes and logic.
```js
// src/index.js
const AWSXRay = require("aws-xray-sdk");
const XRayExpress = AWSXRay.express;
const express = require("express");
// sends tracing data to the local x-ray daemon instance
AWSXRay.setDaemonAddress("xray-daemon:2000");
// Capture all AWS clients we create
const AWS = AWSXRay.captureAWS(require("aws-sdk"));
AWS.config.update({
region: process.env.AWS_REGION || "us-west-2",
});
// Capture all outgoing https requests
AWSXRay.captureHTTPsGlobal(require("https"));
const https = require("https");
const app = express();
const port = 3000;
app.use(XRayExpress.openSegment("Tracetest"));
app.get("/", (req, res) => {
const seg = AWSXRay.getSegment();
const sub = seg.addNewSubsegment("customSubsegment");
setTimeout(() => {
sub.close();
res.sendFile(`${process.cwd()}/index.html`);
}, 500);
});
app.get("/http-request/", (req, res) => {
const endpoint = "https://amazon.com/";
https.get(endpoint, (response) => {
response.on("data", () => {});
response.on("error", (err) => {
res.send(`Encountered error while making HTTPS request: ${err}`);
});
response.on("end", () => {
res.send(`Successfully reached ${endpoint}.`);
});
});
});
app.use(XRayExpress.closeSegment());
app.listen(port, () => console.log(`Example app listening on port ${port}!`));
```
### The Docker Compose Configuration
The Docker configuration will be spinning up all of the required services to run the Node.js Express App, the AWS X-Ray Daemon, and the Tracetest server.
```yaml
# docker-comopose.yaml
version: "3"
services:
app:
build: .
environment:
AWS_REGION: ${AWS_REGION}
ports:
- "3000:3000"
tracetest:
image: kubeshop/tracetest:${TAG:-latest}
platform: linux/amd64
volumes:
- type: bind
source: ./tracetest-config.yaml
target: /app/tracetest.yaml
- type: bind
source: ./tracetest.provision.yaml
target: /app/provisioning.yaml
ports:
- 11633:11633
command: --provisioning-file /app/provisioning.yaml
extra_hosts:
- "host.docker.internal:host-gateway"
depends_on:
postgres:
condition: service_healthy
xray-daemon:
condition: service_started
healthcheck:
test: ["CMD", "wget", "--spider", "localhost:11633"]
interval: 1s
timeout: 3s
retries: 60
postgres:
image: postgres:14
environment:
POSTGRES_PASSWORD: postgres
POSTGRES_USER: postgres
healthcheck:
test: pg_isready -U "$$POSTGRES_USER" -d "$$POSTGRES_DB"
interval: 1s
timeout: 5s
retries: 60
ports:
- 5432:5432
xray-daemon:
image: amazon/aws-xray-daemon:latest
environment:
AWS_ACCESS_KEY_ID: ${AWS_ACCESS_KEY_ID}
AWS_SECRET_ACCESS_KEY: ${AWS_SECRET_ACCESS_KEY}
AWS_SESSION_TOKEN: ${AWS_SESSION_TOKEN}
AWS_REGION: ${AWS_REGION}
ports:
- 2000:2000
```
Alongside the Docker compose configuration, a `.env` file is used to provide the AWS credentials to the AWS X-Ray daemon.
```
AWS_ACCESS_KEY_ID="<your-accessKeyId>"
AWS_SECRET_ACCESS_KEY="<your-secretAccessKey>"
AWS_SESSION_TOKEN="<your-session-token>"
AWS_REGION="us-west-2"
```
### Configuring Tracetest
The only requirement to run the Tracetest server is to have a working Postgres instance and provide the connection details either over a config file and/or environment variables. This looks like the following:
> *Note: The name of the file should match the `volume` configuration part of the `docker` config under the `tracetest` configuration.*
```yaml
# tracetest-config.yaml
---
postgres:
host: postgres
user: postgres
password: postgres
port: 5432
dbname: postgres
params: sslmode=disable
```
In this case, we’ll be provisioning the Tracetest server with the AWS X-Ray configuration so we can ensure it's fully configured to use it as a Data Store from startup. For that, the provisioning file should be the following:
> *Note: The name of the file should match the `volume` configuration part of the `docker` config under the `tracetest` configuration.*
```yaml
# tracetest-provision.yaml
---
type: PollingProfile
spec:
name: default
strategy: periodic
default: true
periodic:
retryDelay: 5s
timeout: 10m
---
type: DataStore
spec:
name: awsxray
type: awsxray
awsxray:
accessKeyId: <your-accessKeyId>
secretAccessKey: <your-secretAccessKey>
sessionToken: <your-session-token>
region: "us-west-2"
```
### Getting the AWS Credentials
If you are familiar with AWS, getting a pair of credentials should be straightforward, but we recommend using temporary credentials to validate this use case. To do so you can run `aws sts get-session-token` from your terminal to get them.
```bash
aws sts get-session-token
[Output]
{
"Credentials": {
"AccessKeyId": "<your-accessKeyId>",
"SecretAccessKey": "<your-secretAccessKey>",
"SessionToken": "<your-session-token>",
"Expiration": "2023-03-29T21:35:14+00:00"
}
}
```
### Running the Use Case
If you are following this and have the example from the repo open you can run `docker compose up -d`.
Then you can open the Tracetest UI at `http://localhost:11633`.
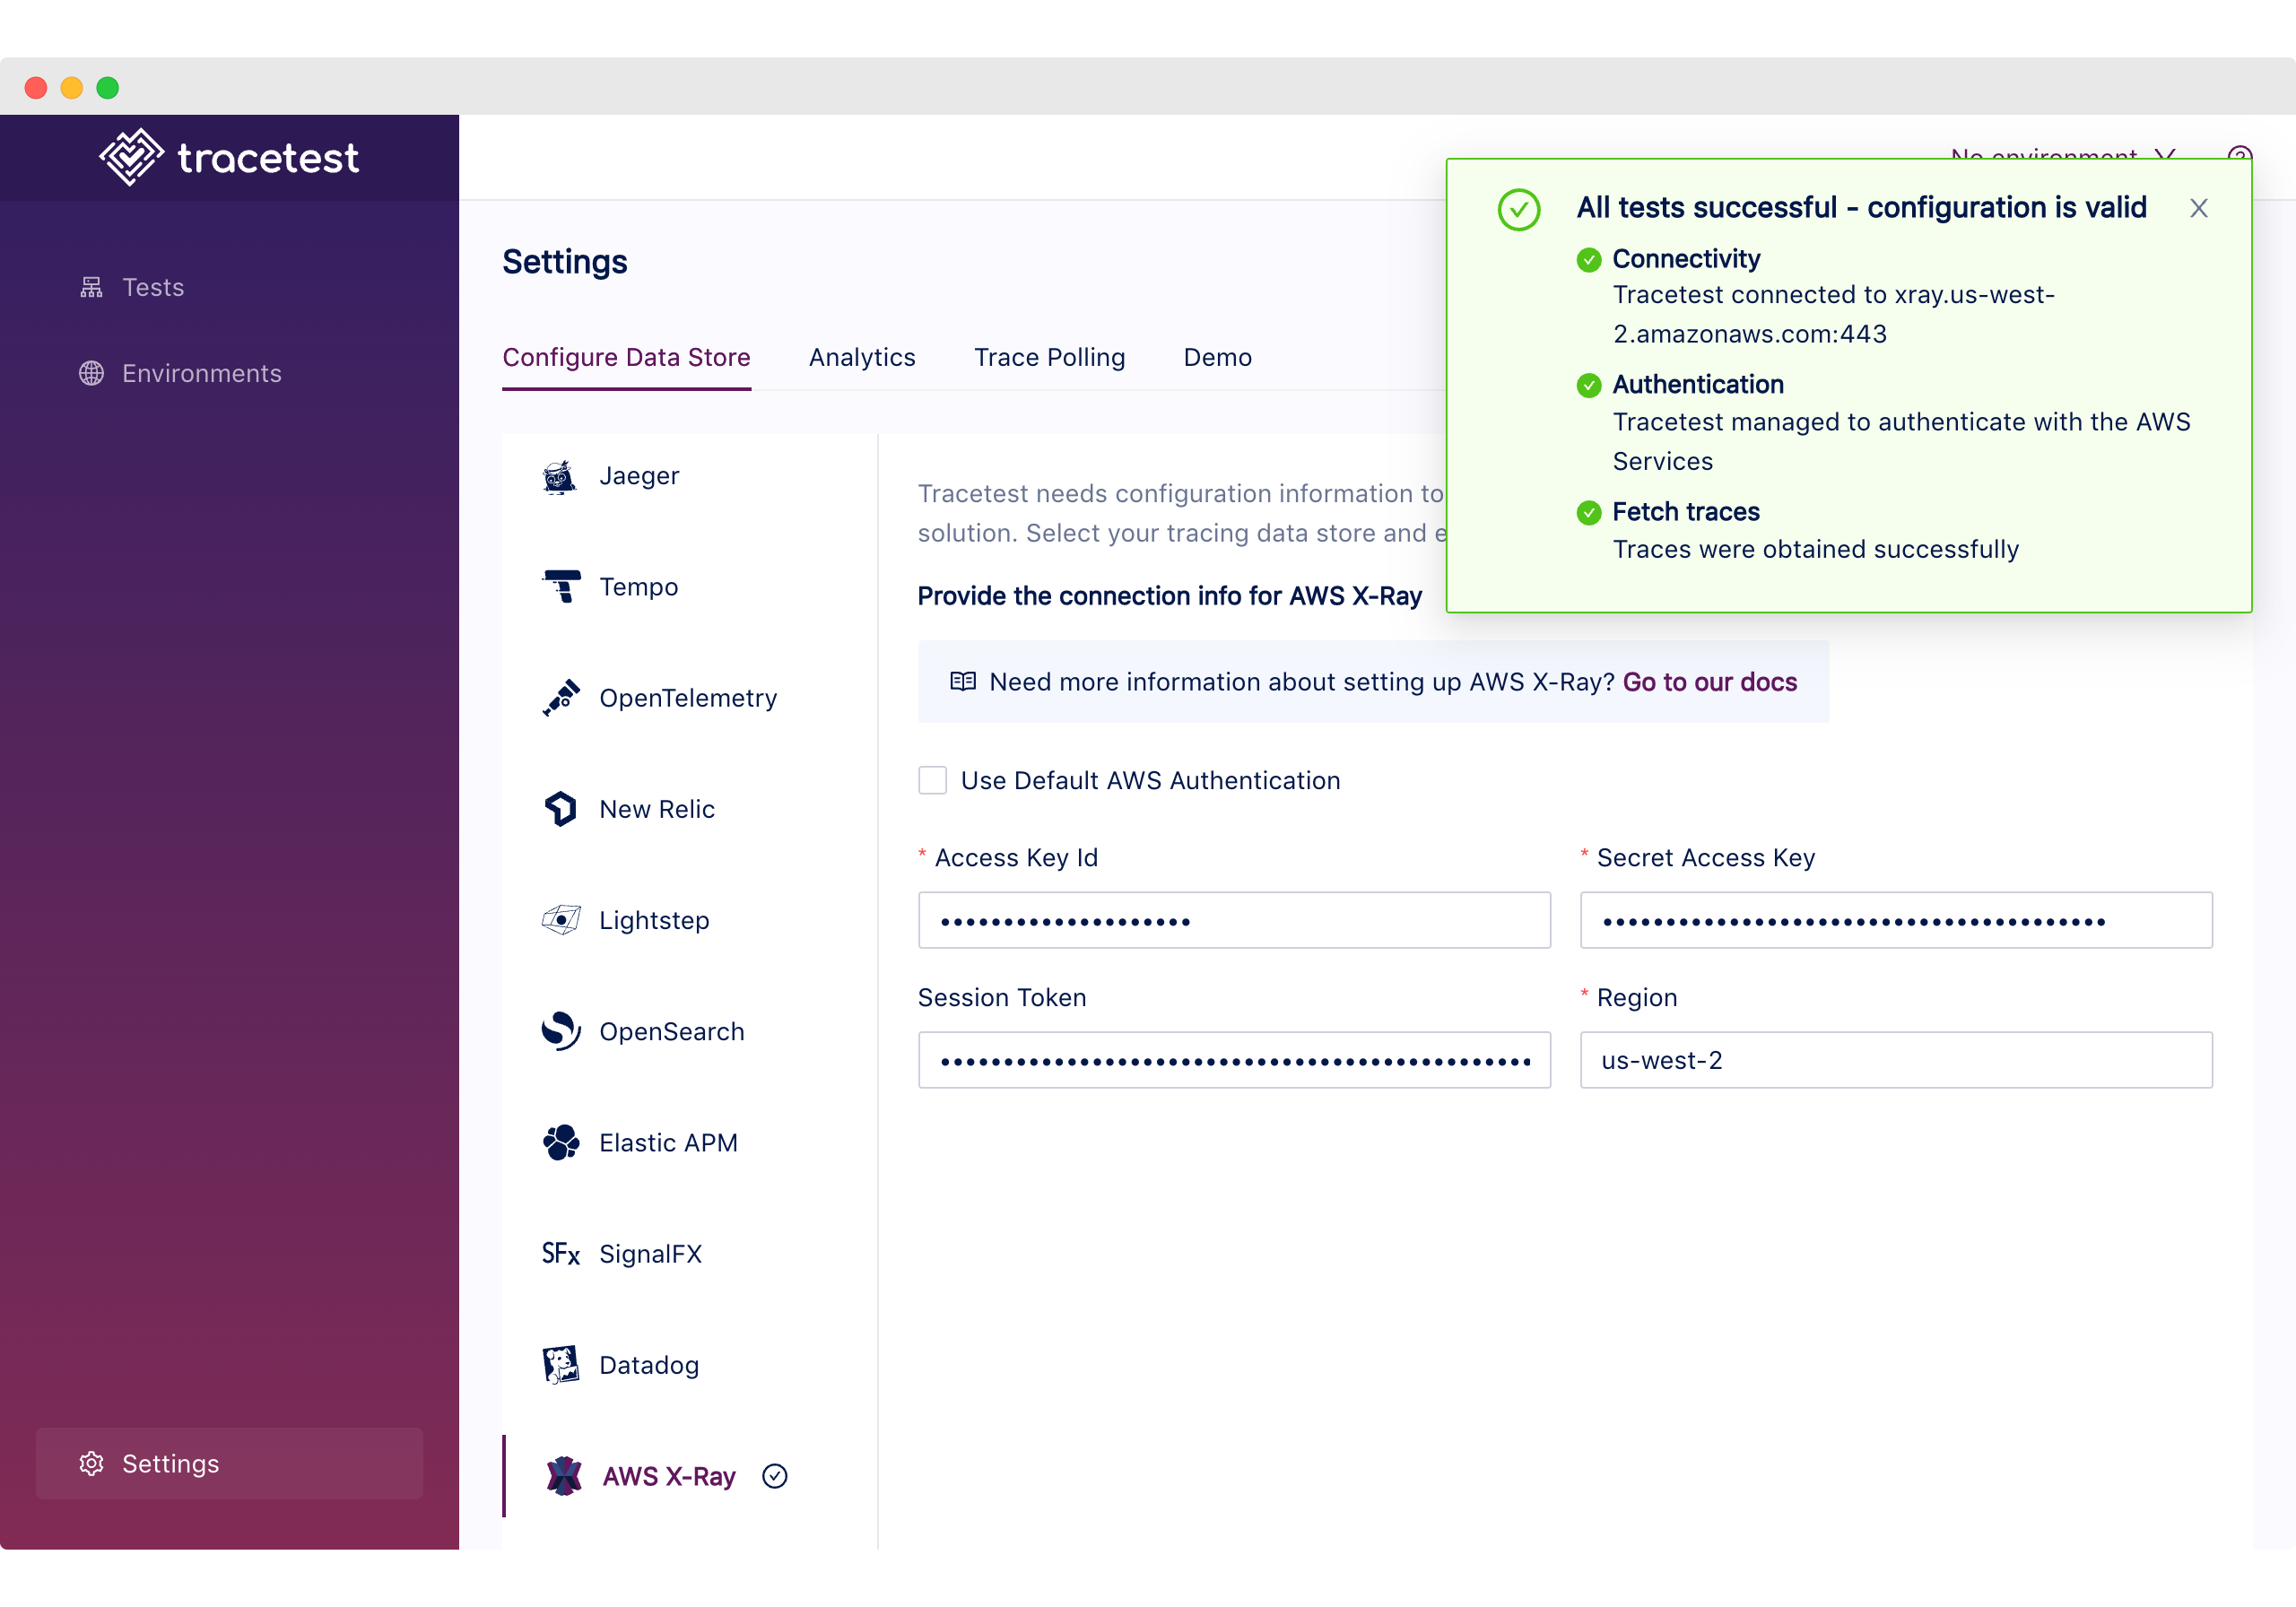
And to validate that the provisioning works as expected and Tracetest can communicate with AWS X-Ray, you can go to the `/settings` page and click the `Test Connection` button.
### Trace-based Testing with Tracetest
Now that we have the infra ready, we can move on to the fun part!
We’ll be using the following test definition for this example:
```yaml
# tests/test.yaml
type: Test
spec:
id: 4F1jCHJVR
name: XRay
description: XRay
trigger:
type: http
httpRequest:
url: http://app:3000/http-request
method: GET
headers:
- key: Content-Type
value: application/json
specs:
- selector: span[tracetest.span.type="http"]
assertions:
- attr:tracetest.selected_spans.count = 3
- attr:tracetest.span.duration < 1s
- selector: span[tracetest.span.type="http" name="amazon.com" http.method="GET"]
assertions:
- attr:http.url = "https://amazon.com/"
```
> *Note: If you want to know more about how the test definitions work, refer to the Tracetest [main docs](https://docs.tracetest.io/cli/creating-tests).*
Let’s start by configuring the Tracetest CLI and adding the test into the system:
```bash
tracetest configure --endpoint http://localhost:11633 --analytics
```
Next, create the test:
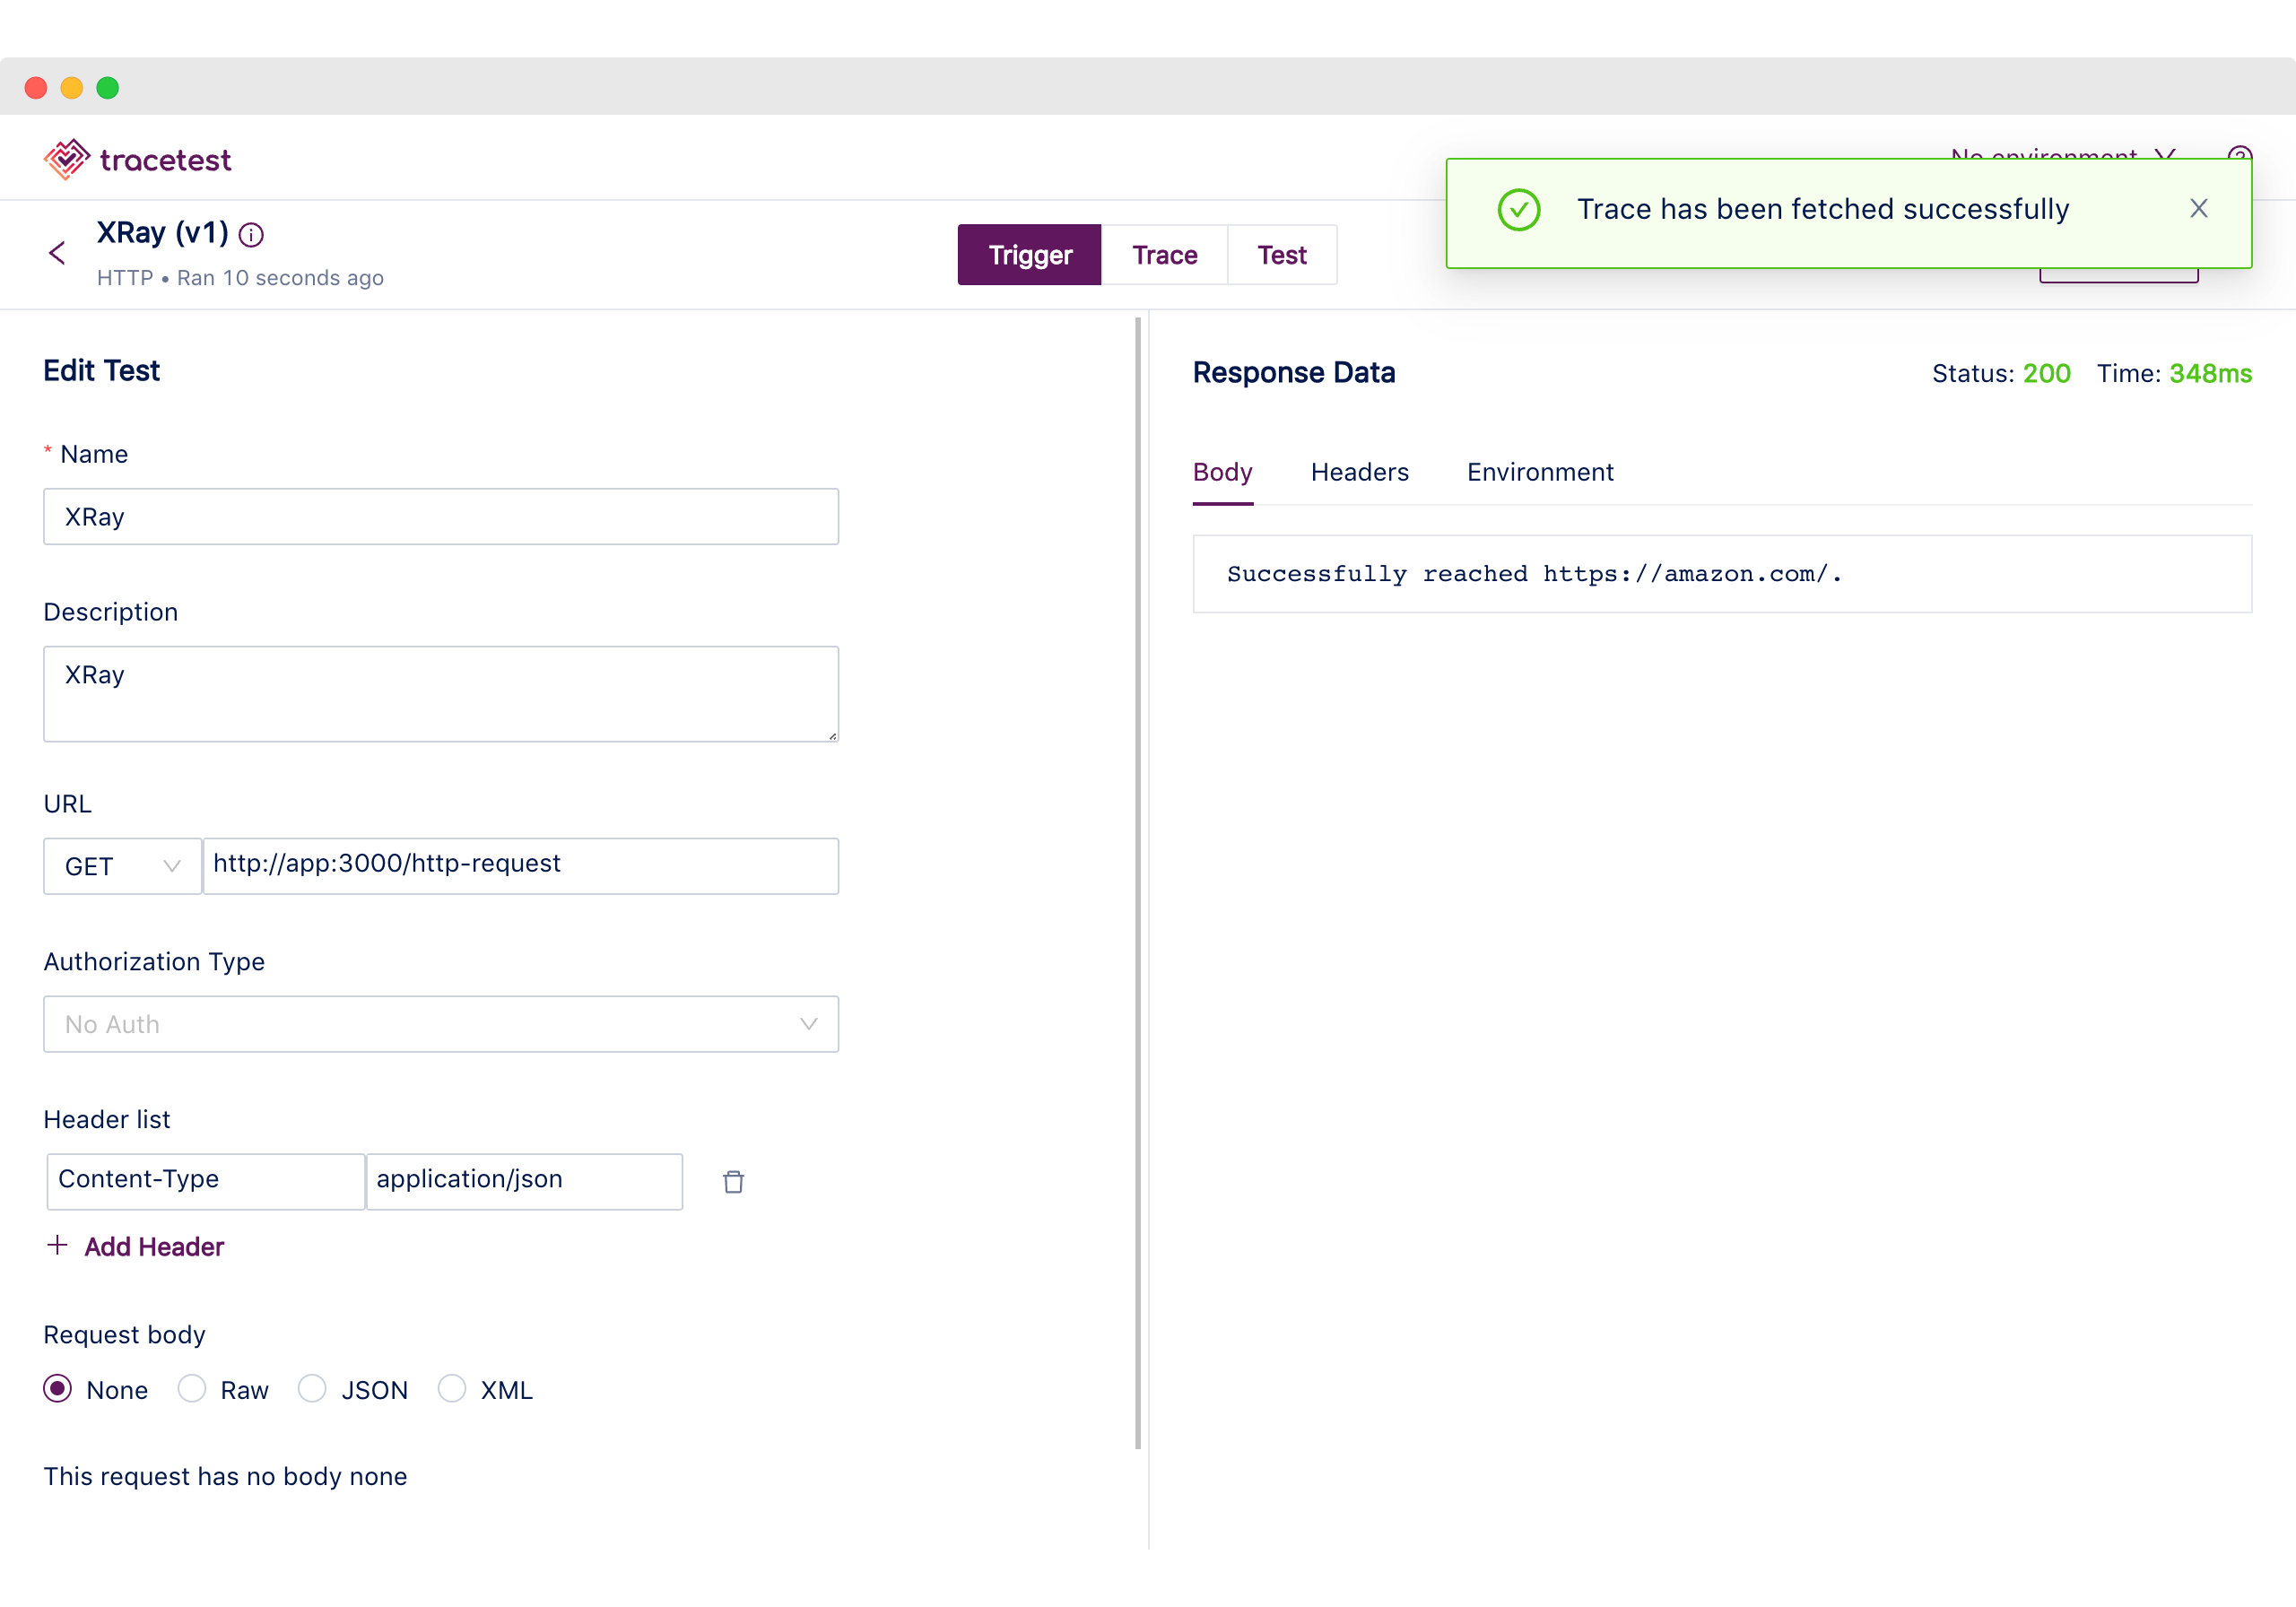
```bash
tracetest test run -d tests/test.yaml
✔ XRay (http://localhost:11633/test/4F1jCHJVR/run/1/test)
```
By following the link we can find the initial trigger information, describing the HTTP request and the response data.
Moving to the Trace tab, using the top navigation, we can visually validate the tracing information the Node.js Express App generated.
We can find the following:
1. The Tracetest Trigger generated a span.
2. The incoming HTTP request.
3. Two HTTP request spans to amazon.com.
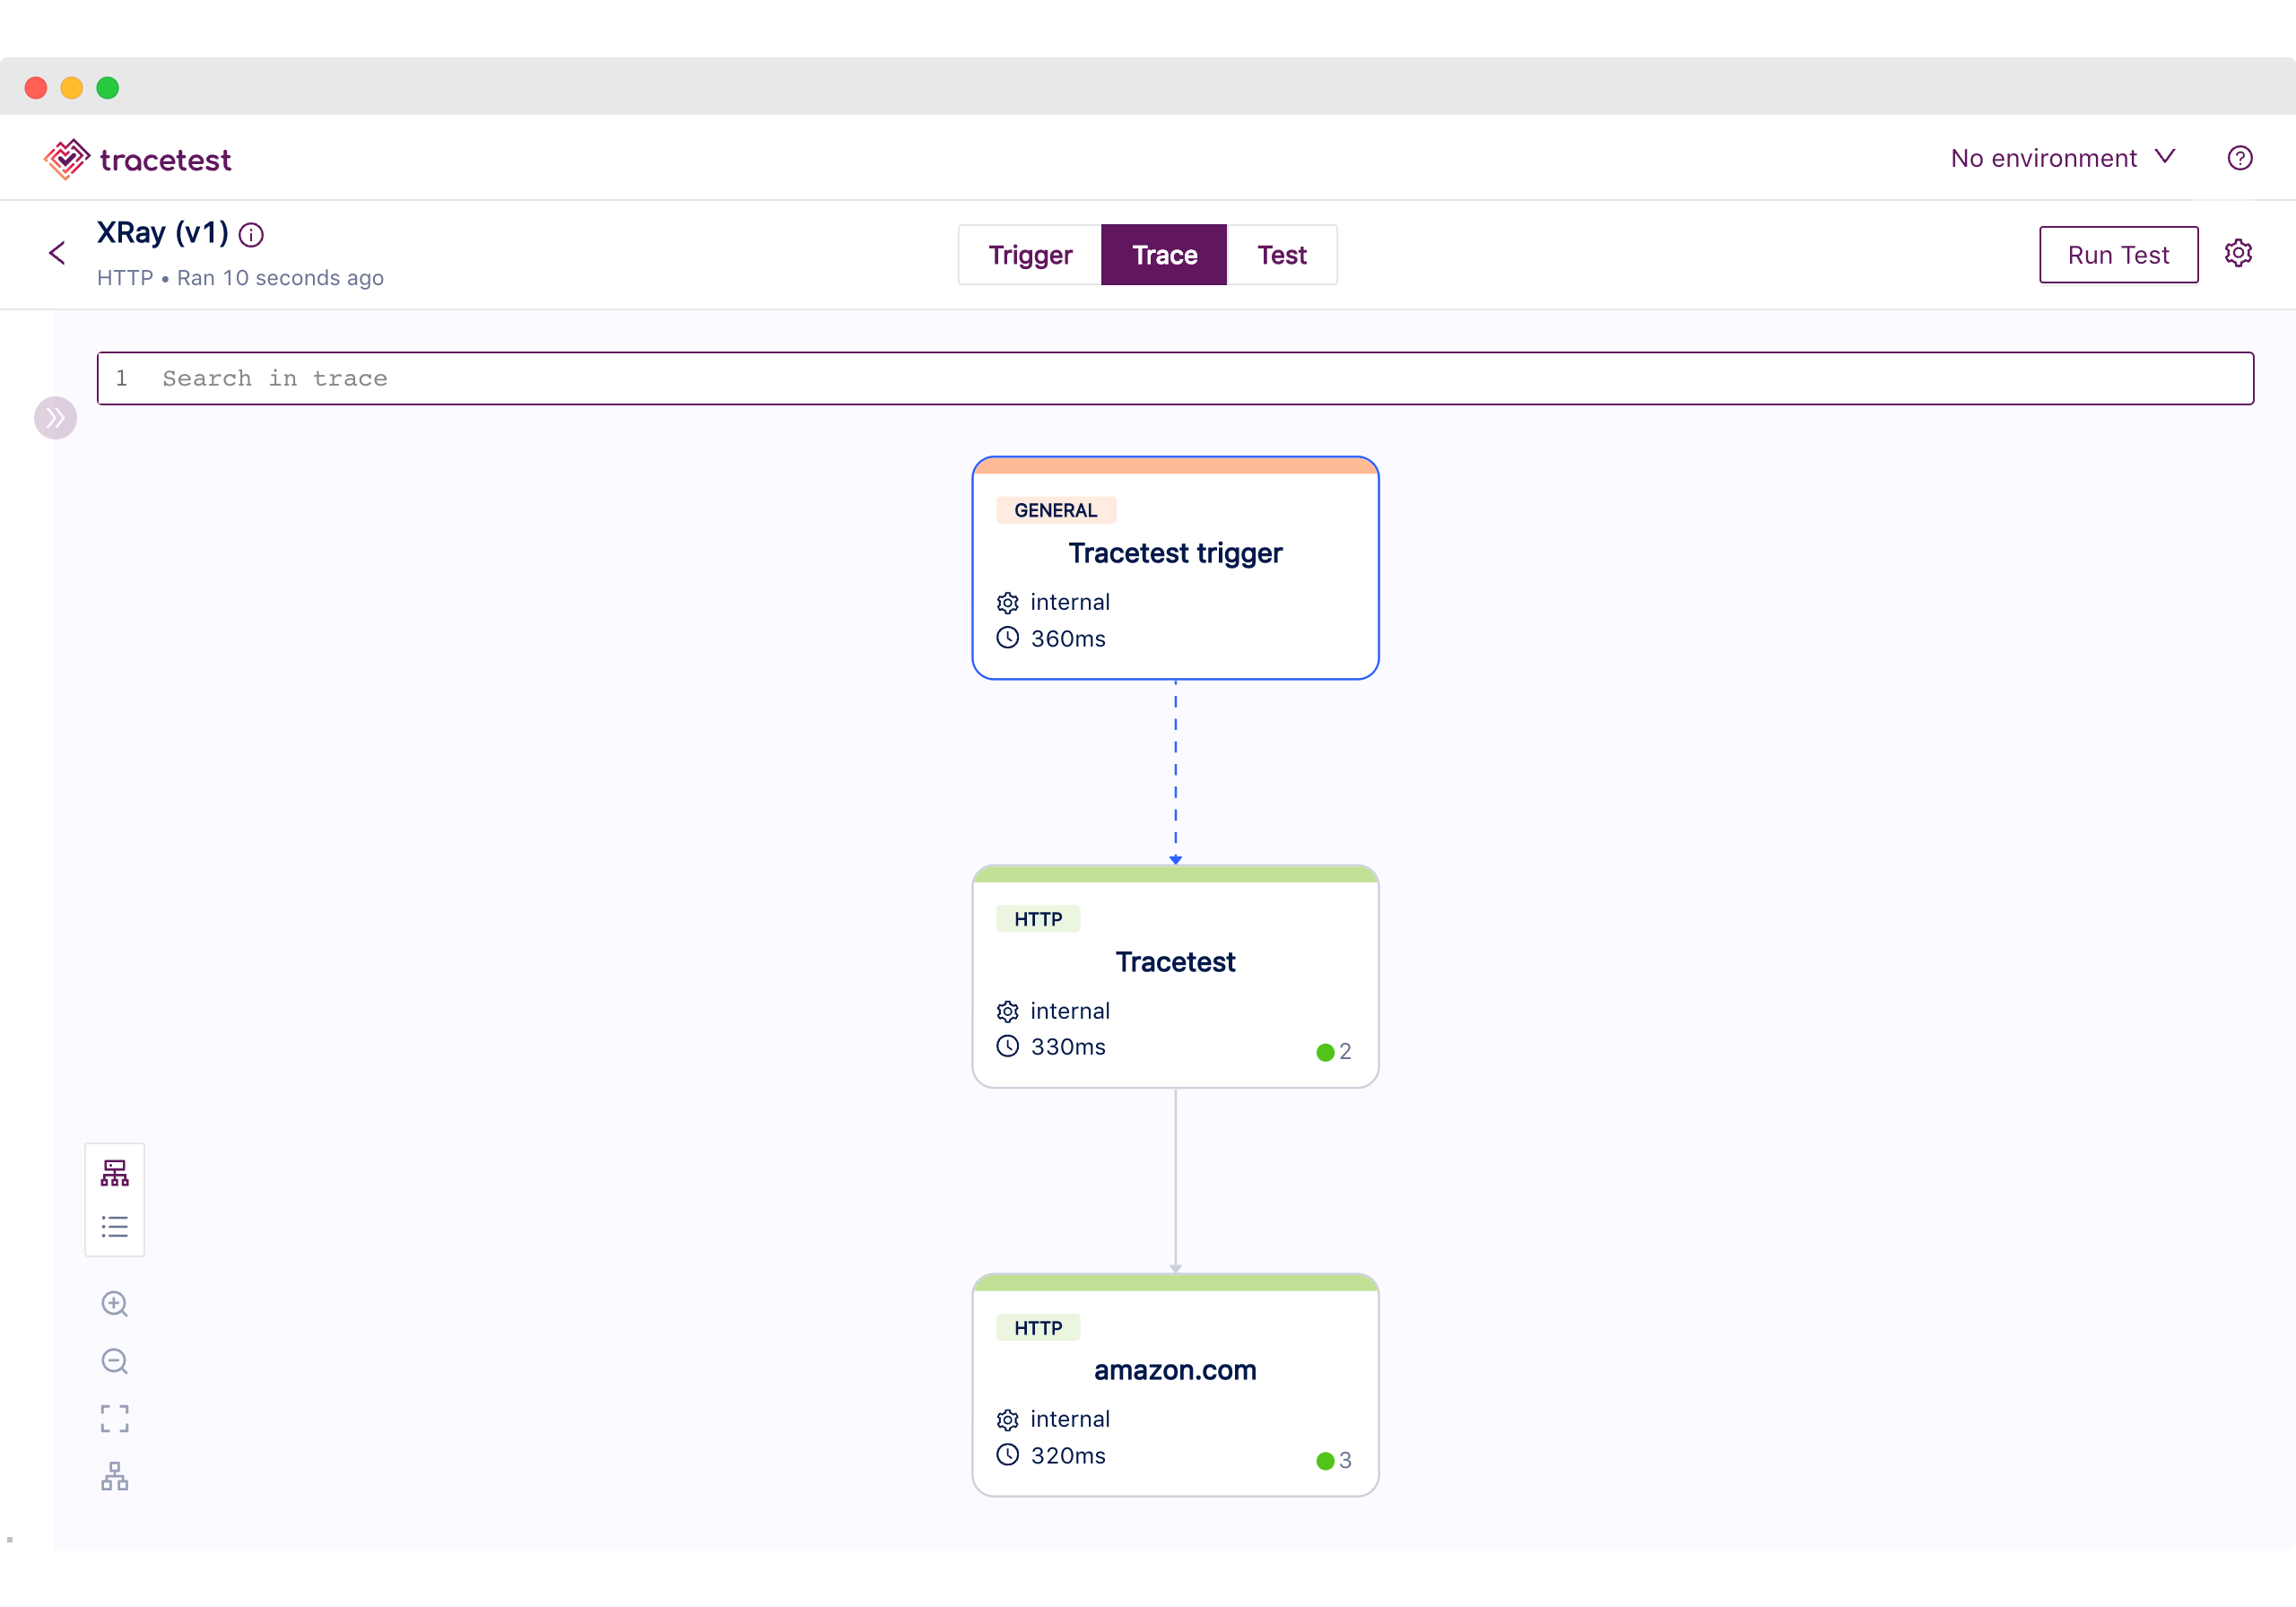
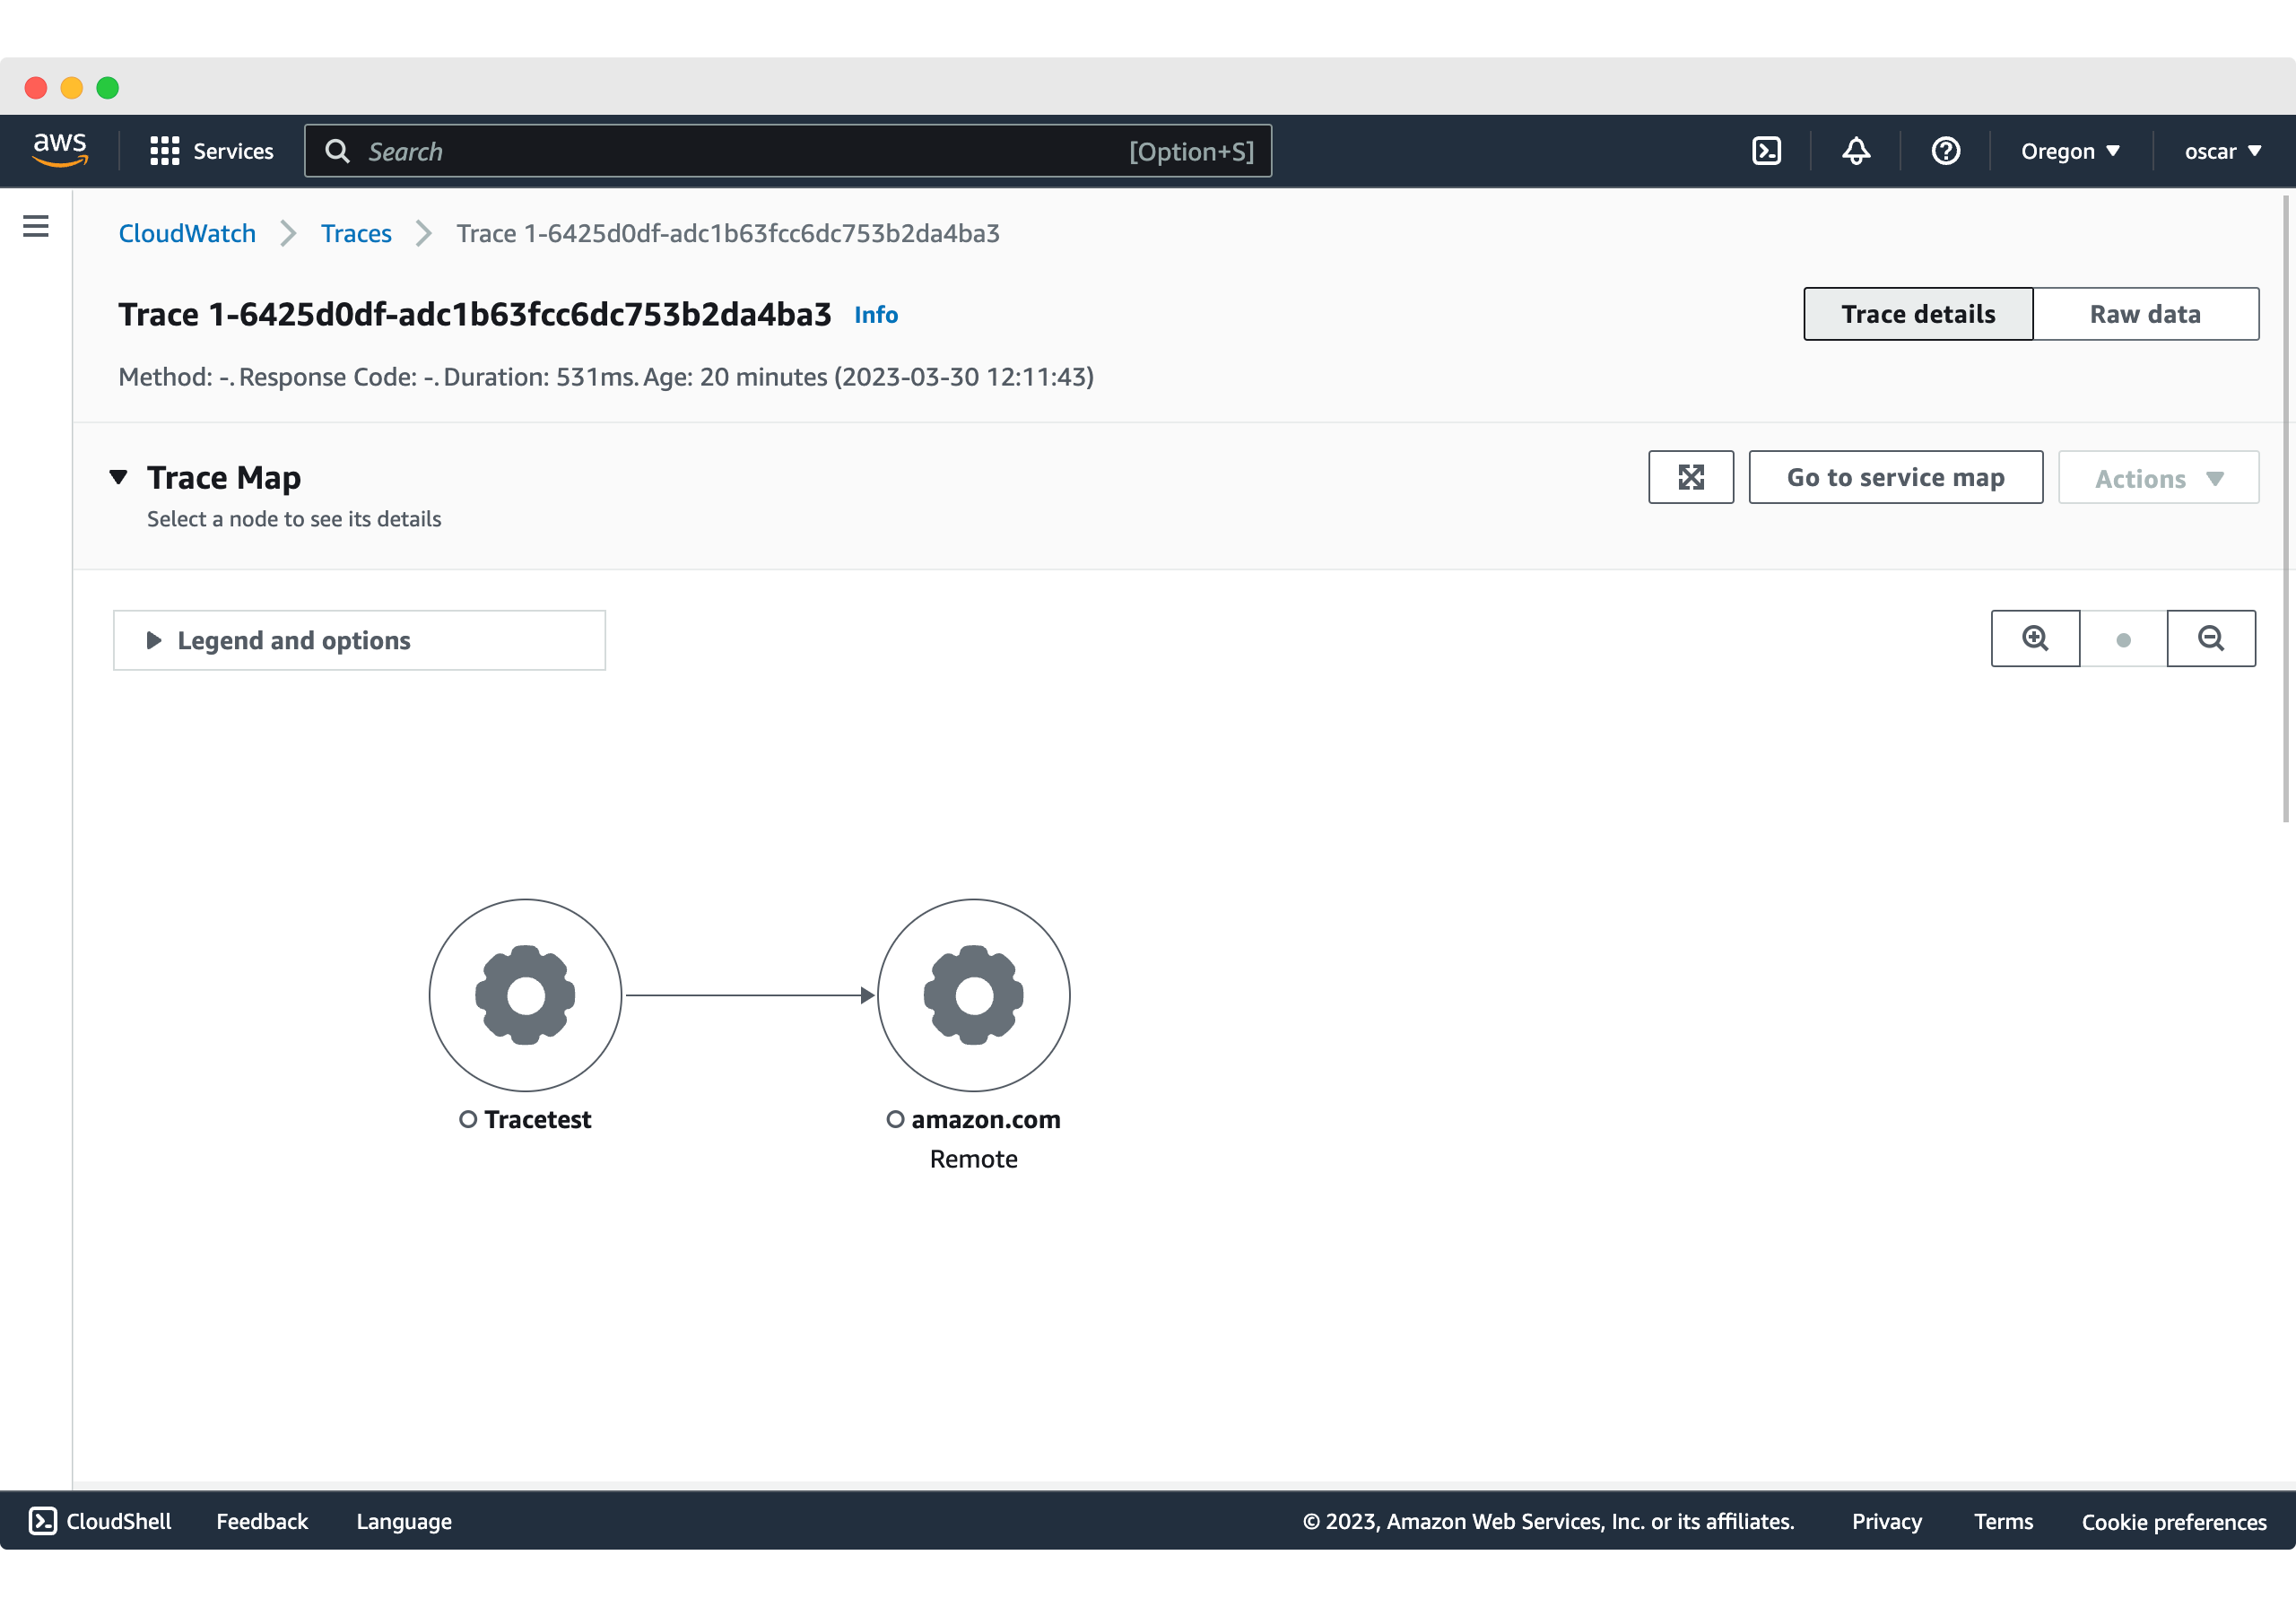
This is reflected in AWS X-Ray where we can see the generated trace.
As good as it is to be able to visualize the full trace information to understand what an application is doing, having an automated way of validating it makes it more efficient.
Thus, we can move to Trace mode by using the top navigation to continue with the final step to create test specs and assertions based on the generated spans.
The test definition we executed includes the following validations:
1. All HTTP spans have a duration of less than 1 second.
2. The count of all HTTP spans should be 3.
3. HTTP outgoing requests should go to `http://amazon.com`.
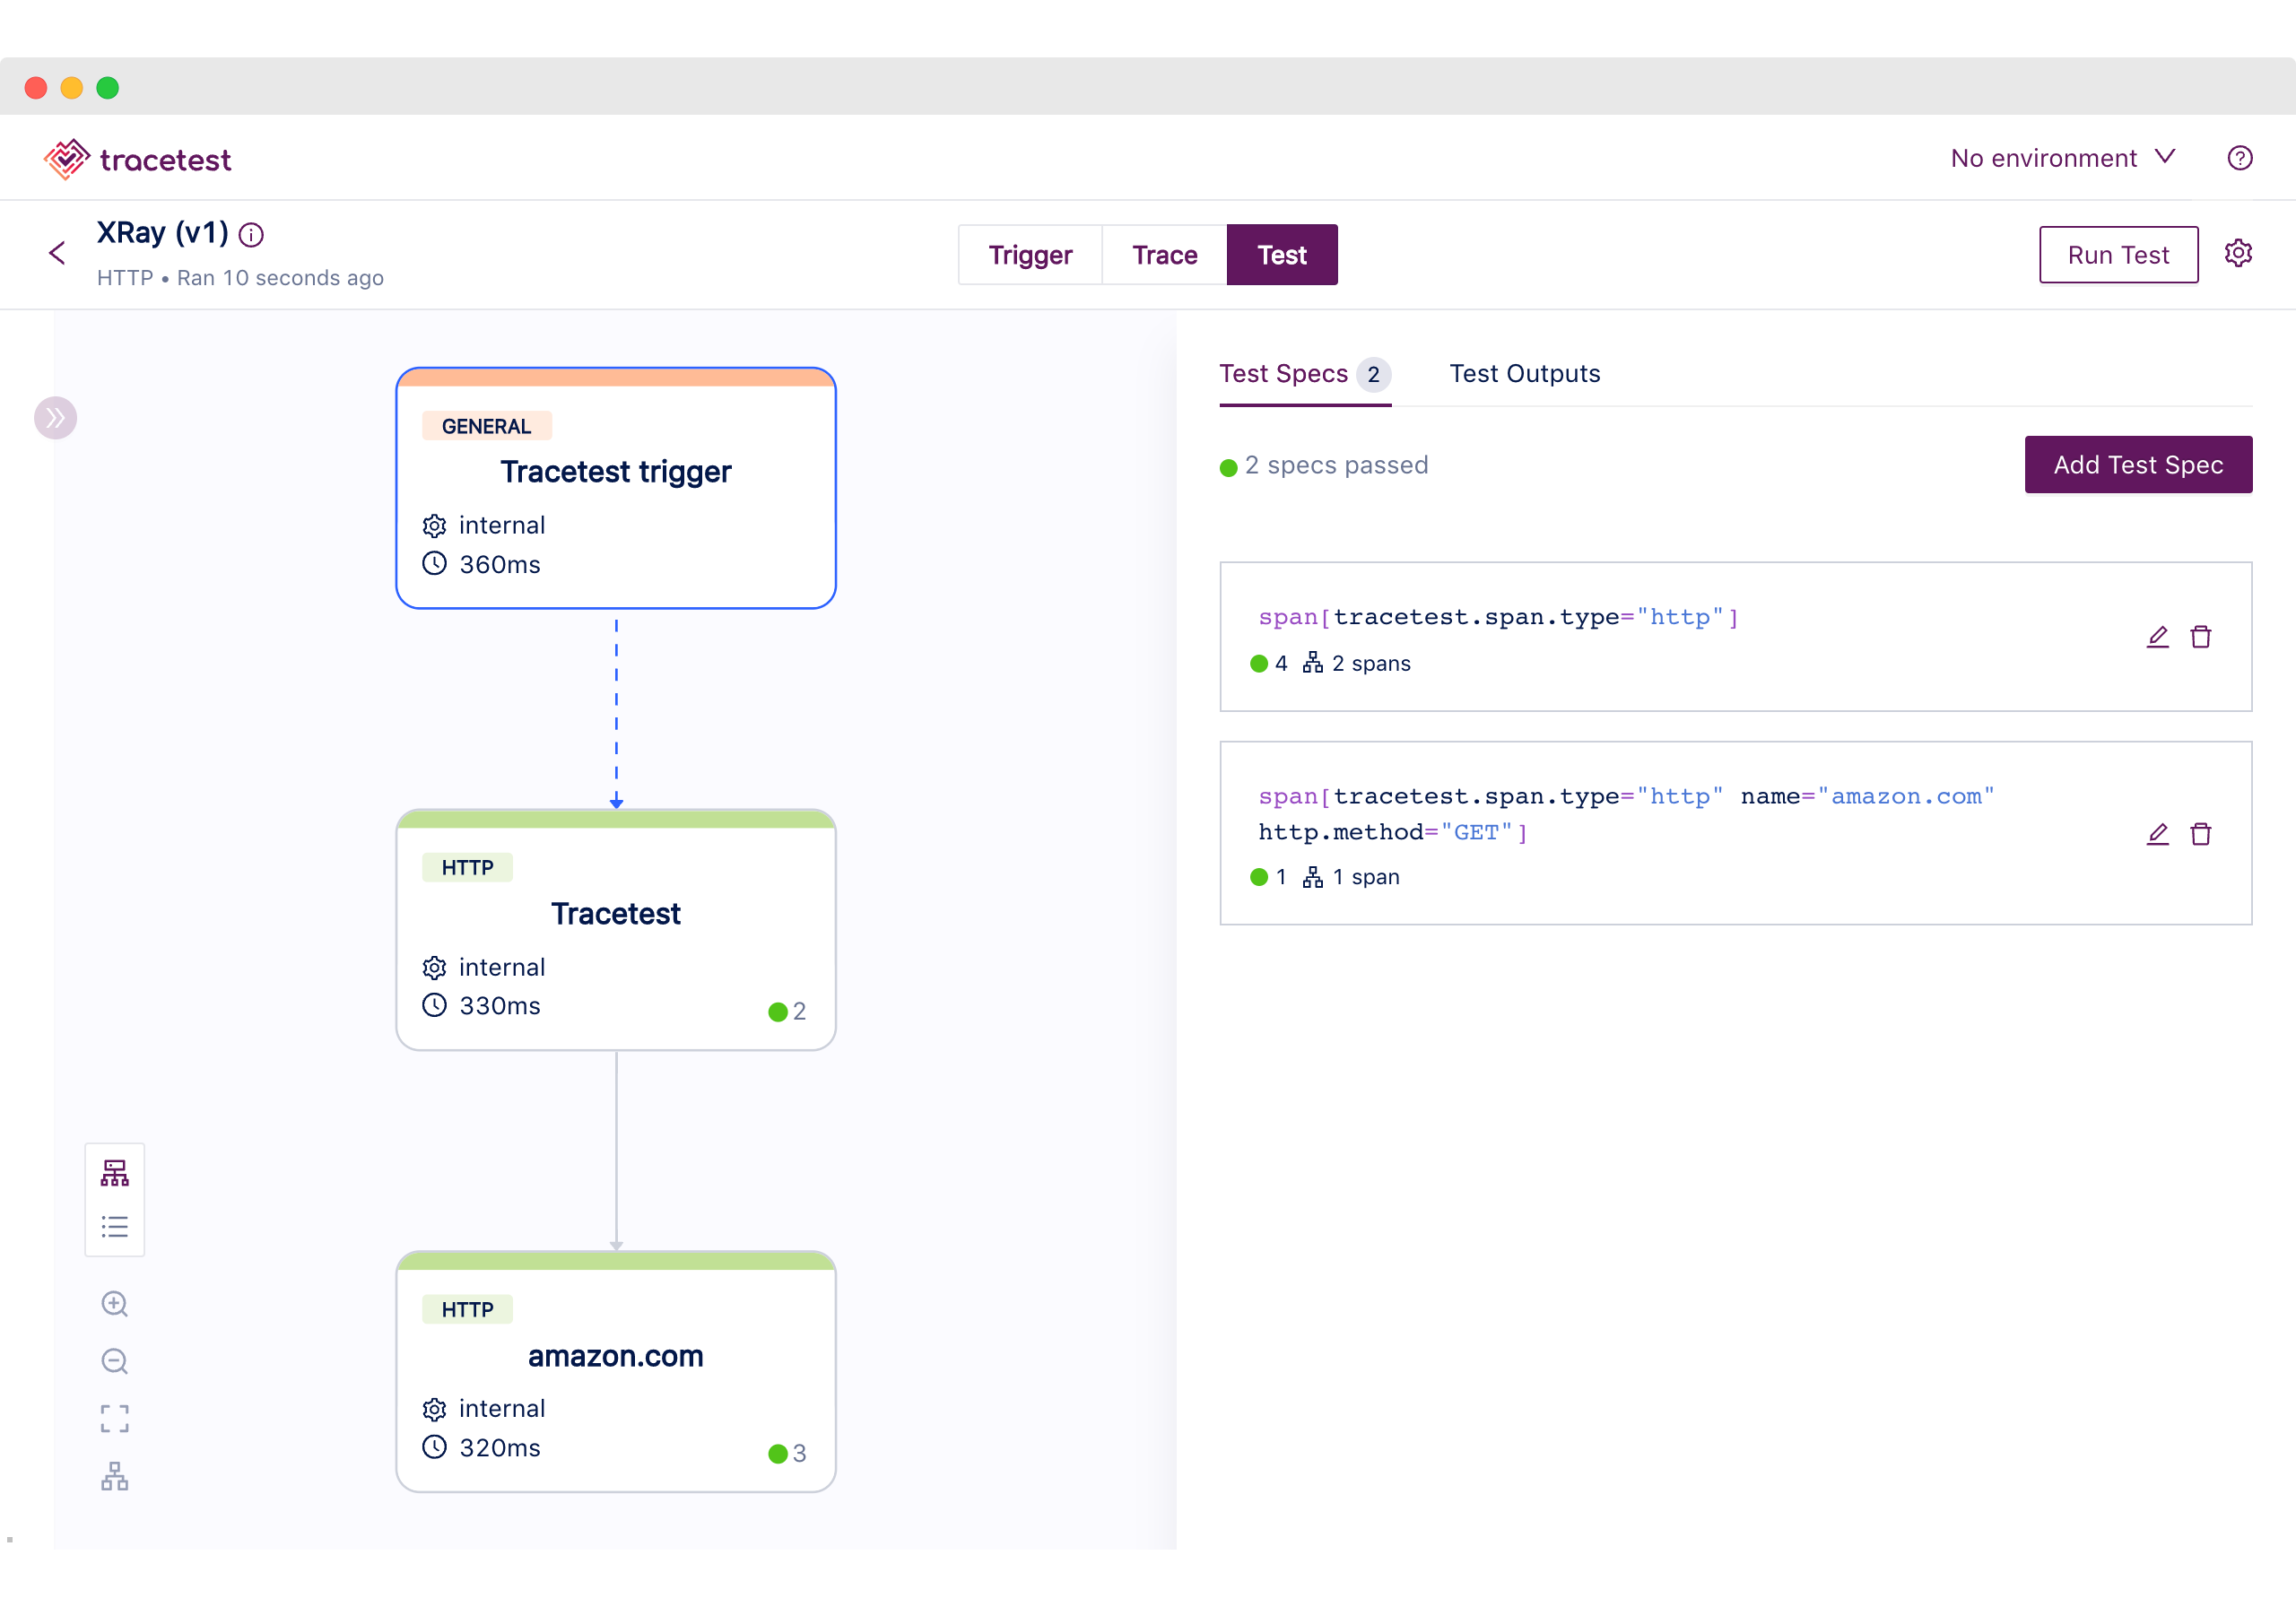
As you can see from this use case, Tracetest enables you to use the generated telemetry data from your application, to have deeper and more specific tests targeting every part of the system.
## Node.js Instrumented API with AWS X-Ray SDK, ADOT, and Tracetest
Next, we’ll have the same Node.js Express app example, that listens for a GET request in the `/http-request` route, trigger a request to [amazon.com](http://amazon.com), and returns a response based on the request. But we’ll be doing some changes by introducing the AWS Distro for OpenTelemetry as a middleware for both X-Ray and Tracetest.
Here’s what the demo will showcase:
1. Instrumenting the Node.js app using the AWS X-Ray SDK.
2. Sending tracing data to both the AWS Cloud and Tracetest using the ADOT.
3. Triggering, visualizing, and applying trace-based testing with Tracetest.
To better follow this use case you can download the example from the [repo](https://github.com/kubeshop/tracetest) by following the next steps:
```
git clone https://github.com/kubeshop/tracetest.git
cd examples/tracetest-amazon-x-ray-adot
docker compose up -d
```
### Instrumenting the Node.js Express App
Similar to the previous use case, the first task is to create an instrumented version of the basic Node.js App using the AWS X-Ray SDK, but, in this case, the data should be sent to the ADOT collector instead of the X-Ray daemon instance.
```jsx
// src/index.js
const AWSXRay = require("aws-xray-sdk");
const XRayExpress = AWSXRay.express;
const express = require("express");
// tracing data sent to the adot collector
AWSXRay.setDaemonAddress("adot-collector:2000");
// Capture all AWS clients we create
const AWS = AWSXRay.captureAWS(require("aws-sdk"));
AWS.config.update({
region: process.env.AWS_REGION || "us-west-2",
});
// Capture all outgoing https requests
AWSXRay.captureHTTPsGlobal(require("https"));
const https = require("https");
const app = express();
const port = 3000;
app.use(XRayExpress.openSegment("Tracetest"));
app.get("/", (req, res) => {
const seg = AWSXRay.getSegment();
const sub = seg.addNewSubsegment("customSubsegment");
setTimeout(() => {
sub.close();
res.sendFile(`${process.cwd()}/index.html`);
}, 500);
});
app.get("/http-request/", (req, res) => {
const endpoint = "https://amazon.com/";
https.get(endpoint, (response) => {
response.on("data", () => {});
response.on("error", (err) => {
res.send(`Encountered error while making HTTPS request: ${err}`);
});
response.on("end", () => {
res.send(`Successfully reached ${endpoint}.`);
});
});
});
app.use(XRayExpress.closeSegment());
app.listen(port, () => console.log(`Example app listening on port ${port}!`));
```
### The Docker-Compose Configuration
The Docker configuration will be spinning up all of the required services to run the app, the ADOT collector, and the Tracetest server.
```yaml
# docker-compose.yaml
version: "3"
services:
app:
build: .
environment:
AWS_REGION: ${AWS_REGION}
ports:
- "3000:3000"
tracetest:
image: kubeshop/tracetest:${TAG:-latest}
platform: linux/amd64
volumes:
- type: bind
source: ./tracetest-config.yaml
target: /app/tracetest.yaml
- type: bind
source: ./tracetest.provision.yaml
target: /app/provisioning.yaml
ports:
- 11633:11633
command: --provisioning-file /app/provisioning.yaml
extra_hosts:
- "host.docker.internal:host-gateway"
depends_on:
postgres:
condition: service_healthy
adot-collector:
condition: service_started
healthcheck:
test: ["CMD", "wget", "--spider", "localhost:11633"]
interval: 1s
timeout: 3s
retries: 60
postgres:
image: postgres:14
environment:
POSTGRES_PASSWORD: postgres
POSTGRES_USER: postgres
healthcheck:
test: pg_isready -U "$$POSTGRES_USER" -d "$$POSTGRES_DB"
interval: 1s
timeout: 5s
retries: 60
ports:
- 5432:5432
adot-collector:
image: amazon/aws-otel-collector:latest
command:
- "--config"
- "/otel-local-config.yaml"
volumes:
- ./collector.config.yaml:/otel-local-config.yaml
environment:
AWS_ACCESS_KEY_ID: ${AWS_ACCESS_KEY_ID}
AWS_SECRET_ACCESS_KEY: ${AWS_SECRET_ACCESS_KEY}
AWS_SESSION_TOKEN: ${AWS_SESSION_TOKEN}
AWS_REGION: ${AWS_REGION}
ports:
- 4317:4317
- 2000:2000
```
Alongside the Docker Compose configuration, a `.env` file is used to provide the AWS credentials to the ADOT collector.
```
AWS_ACCESS_KEY_ID="<your-accessKeyId>"
AWS_SECRET_ACCESS_KEY="<your-secretAccessKey>"
AWS_SESSION_TOKEN="<your-session-token>"
AWS_REGION="us-west-2"
```
### Configuring Tracetest
The only requirement to run the Tracetest server is to have a working Postgres instance and provide the connection details either over a config file and/or environment variables. Which looks like the following:
```yaml
# tracetest-config.yaml
---
postgres:
host: postgres
user: postgres
password: postgres
port: 5432
dbname: postgres
params: sslmode=disable
```
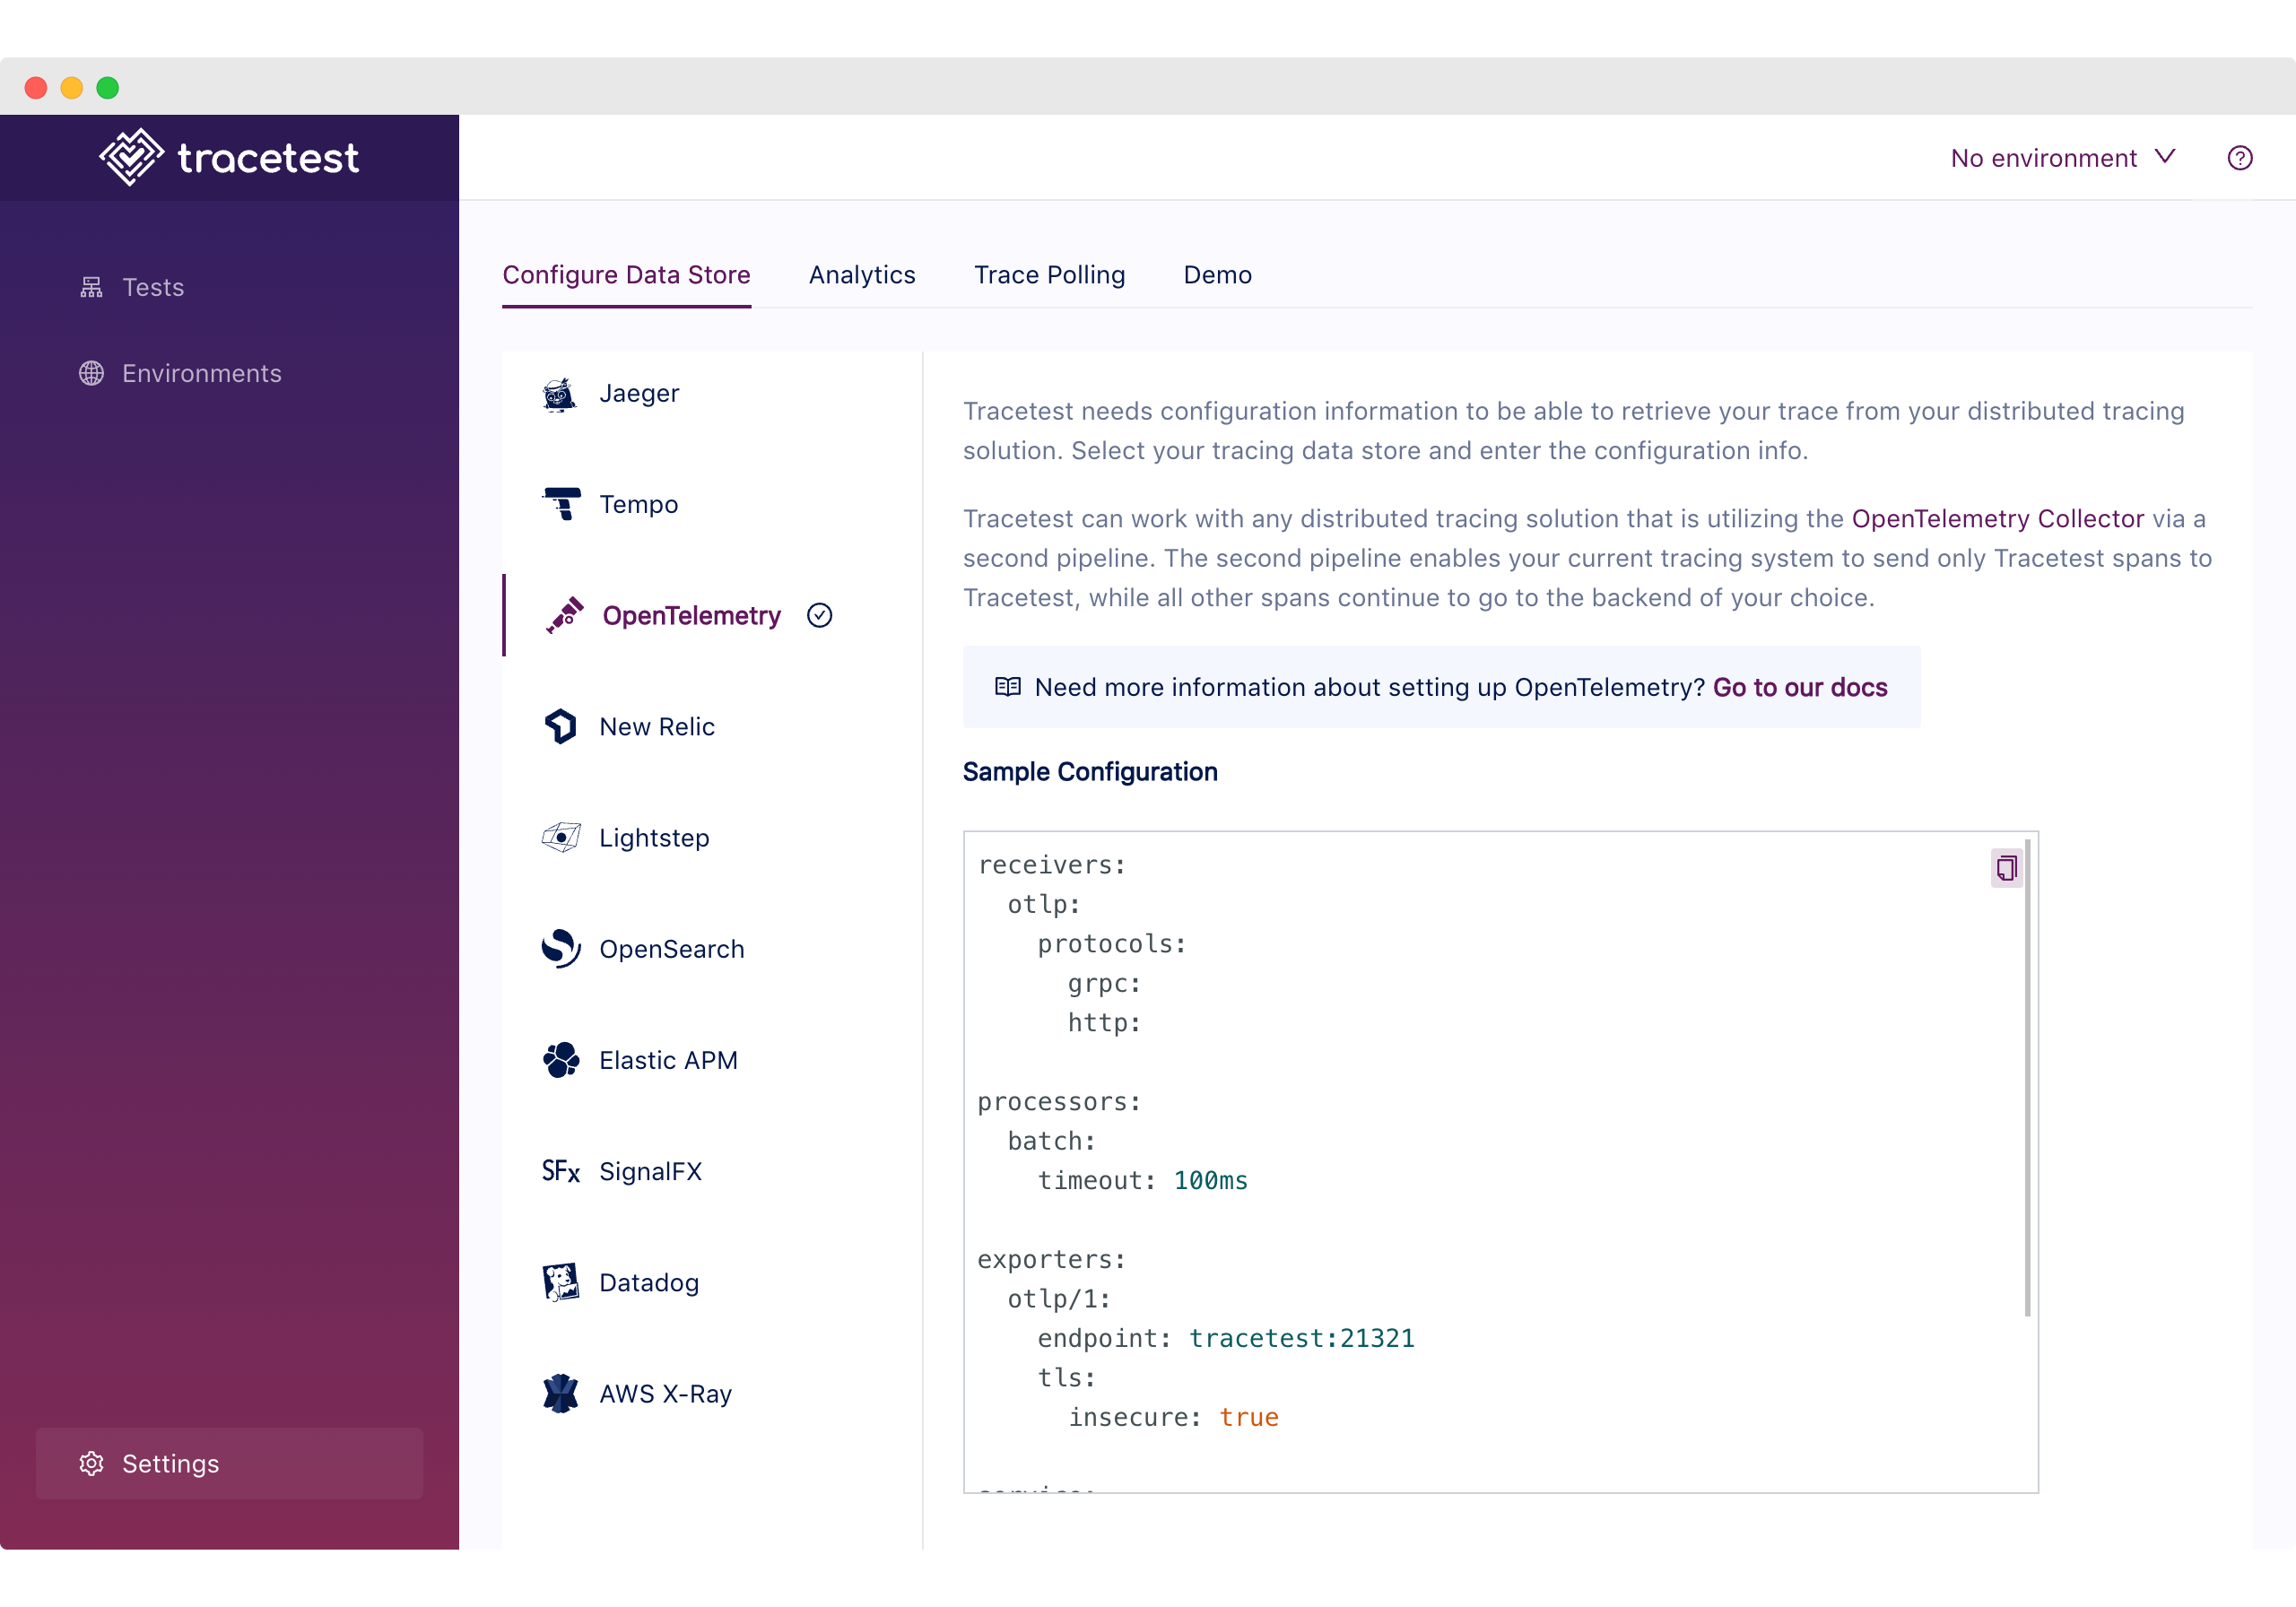
In this case, we’ll be provisioning the Tracetest server with the basic OTLP configuration so we can ensure it's fully configured to use it as a Data Store from startup. For that, the provisioning file should be the following:
```yaml
# tracetest-provision.yaml
---
type: DataStore
spec:
name: otlp
type: otlp
```
### Configuring the ADOT Collector
As the Node.js Express App generates X-Ray format telemetry data, the collector needs to be configured to receive the specific format similar to the Daemon we used for the first use case.
Then, it needs to send telemetry data to both Tracetest and the AWS Cloud, thus the configuration needs to include exporters for both destinations.
Finally, specifying the pipelines for both AWS X-Ray and Tracetest to complete the setup.
```yaml
# collector.config.yaml
receivers:
awsxray:
transport: udp
processors:
batch:
exporters:
awsxray:
region: ${AWS_REGION}
otlp/tt:
endpoint: tracetest:21321
tls:
insecure: true
service:
pipelines:
traces/tt:
receivers: [awsxray]
processors: [batch]
exporters: [otlp/tt]
traces/xr:
receivers: [awsxray]
exporters: [awsxray]
```
### Getting the AWS Credentials
If you are familiar with AWS, getting a pair of credentials should be straightforward, but we recommend using temporary credentials to validate this use case. To do so you can run `aws sts get-session-token` from your terminal to get them.
```bash
aws sts get-session-token
[Output]
{
"Credentials": {
"AccessKeyId": "<your-accessKeyId>",
"SecretAccessKey": "<your-secretAccessKey>",
"SessionToken": "<your-session-token>",
"Expiration": "2023-03-29T21:35:14+00:00"
}
}
```
### Running the Use Case
If you are following this and have the example from the repo open, you can run `docker compose up -d`.
Then, open the Tracetest UI at `http://localhost:11633`
To validate that the provisioning works as expected, go to the `/settings` page and validate that the OpenTelemetry Data Store is selected.
### Trace-based Testing with Tracetest
After finalizing the setup, we are back to the fun part!
We’ll be using a similar test as the previous use case to trigger the API endpoint, fetch the trace from the ADOT, and validate the spans.
```yaml
# tests/test.yaml
type: Test
spec:
id: 4F1jCHJVR
name: XRay
description: XRay
trigger:
type: http
httpRequest:
url: http://app:3000/http-request
method: GET
headers:
- key: Content-Type
value: application/json
specs:
- selector: span[tracetest.span.type="http"]
assertions:
- attr:tracetest.selected_spans.count = 3
- attr:tracetest.span.duration < 1s
- selector: span[tracetest.span.type="http" name="amazon.com" http.method="GET"]
assertions:
- attr:http.url = "https://amazon.com/"
```
> *Note: If you want to know more about how the test definitions work, refer to the Tracetest [main docs](https://docs.tracetest.io/cli/creating-tests).*
First, let’s configure the Tracetest CLI:
```bash
tracetest configure --endpoint http://localhost:11633 --analytics
```
Then, we create and run the test:
```bash
tracetest test run -d tests/test.yaml
✔ XRay (http://localhost:11633/test/4F1jCHJVR/run/1/test)
```
By following the link we can find the initial trigger information, describing the HTTP request and the response data.

Moving to the Trace tab, using the top navigation, we can visually validate the tracing information the Node.js Express App generated.
We can find the following:
1. The Tracetest Trigger generated a span.
2. The incoming HTTP request.
3. Two HTTP request spans to `amazon.com`.

This is reflected in AWS X-Ray where we can see the generated trace.

As good as it is to be able to visualize the full trace information to understand what an application is doing, having an automated way of validating it becomes more efficient.
Thus, we can move to trace mode by using the top navigation to continue with the final step to create test specs and assertions based on the generated spans.
The test definition we executed includes the following validations:
1. All HTTP spans have a duration of less than 1 second.
2. The count of all HTTP spans should be 3.
3. HTTP outgoing requests should go to `http://amazon.com`.

As you can see in this use case, enabling tracing for your distributed system can be done in multiple ways, allowing you to choose what’s the best match for your team and current setup. Tracetest is easy to integrate with the path that suits you best, without losing the ability to use the generated telemetry data from your application and have deeper and more specific tests targeting every part of the system.
## The Pokeshop API with Otel Instrumentation, ADOT, X-Ray, and Tracetest
Now that we have learned the basics to instrument an application with AWS X-Ray and run some trace-based testing using Tracetest, it's time to remove the training wheels and go for something closer to a real-life scenario.
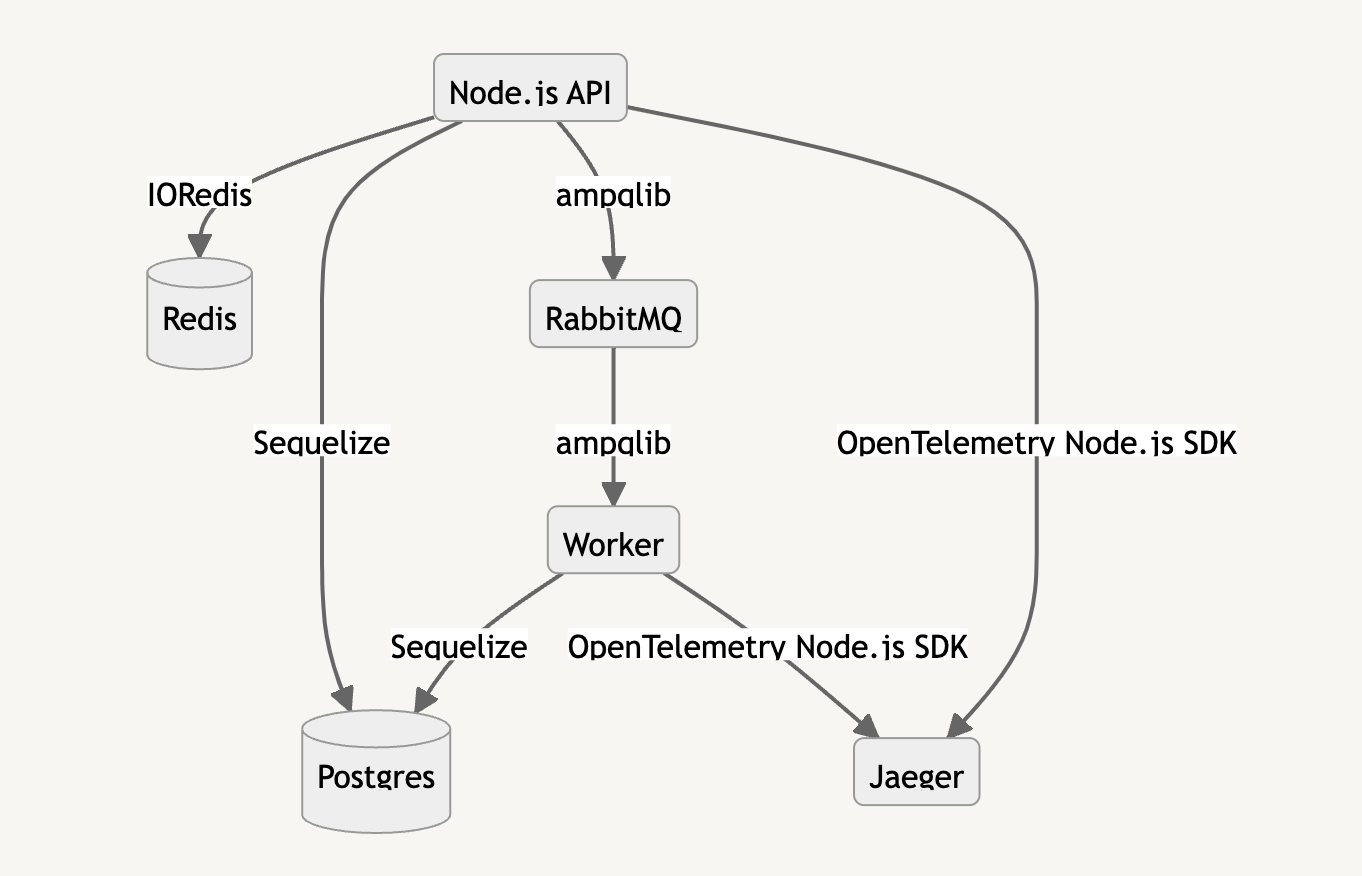
For this use case, we are going to be using Tracetest’s own [Pokeshop API](https://docs.tracetest.io/live-examples/pokeshop/overview) which is a fully distributed Node.js application. It showcases some of the hurdles and complexities a distributed system can have. Including:
- Asynchronous processes
- Cache layers
- HTTP/Grpc APIs
- External API requests
- Database storage
> *Note: The use case will be focused on testing the [import Pokemon](https://docs.tracetest.io/live-examples/pokeshop/use-cases/import-pokemon) async process*
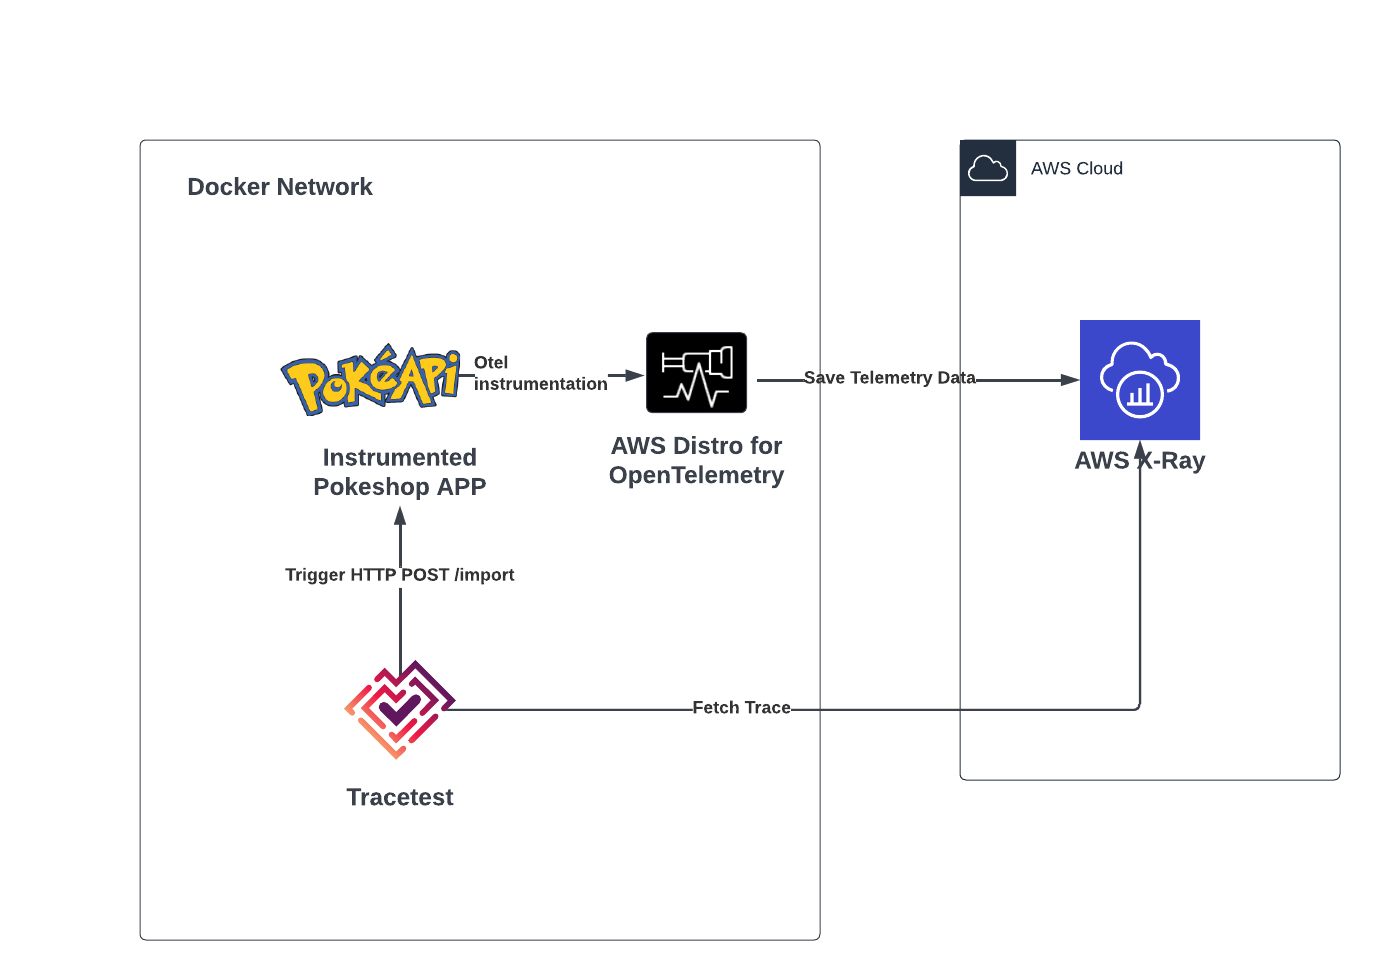
In this example, we are sending trace data from the Pokeshop API to the AWS Distribution for Open Telemetry (ADOT), which receives the OpenTelemetry protocol format and then exports it to AWS Cloud as the final destination. Then, Tracetest fetches the full trace directly from AWS X-Ray.
To better follow this use case you can download the example from the [repo](https://github.com/kubeshop/tracetest) by following these steps:
```
git clone https://github.com/kubeshop/tracetest.git
cd examples/tracetest-amazon-x-ray-pokeshop
docker compose up -d
```
### The Pokeshop API
The Pokeshop API is a fully instrumented and distributed application that uses queues, cache layers, databases, and processing workers to simulate a real-life application.
> *Note: To find out more about the Pokeshop API, you can take a look at the [official docs](https://docs.tracetest.io/live-examples/pokeshop/overview).*
### The Docker Compose Configuration
The Docker configuration will be spinning off all of the required services to run the Pokeshop API services, the ADOT collector, and the Tracetest server.
```yaml
version: "3"
services:
tracetest:
image: kubeshop/tracetest:${TAG:-latest}
platform: linux/amd64
volumes:
- type: bind
source: ./tracetest.config.yaml
target: /app/tracetest.yaml
- type: bind
source: ./tracetest.provision.yaml
target: /app/provisioning.yaml
ports:
- 11633:11633
command: --provisioning-file /app/provisioning.yaml
extra_hosts:
- "host.docker.internal:host-gateway"
depends_on:
postgres:
condition: service_healthy
adot-collector:
condition: service_started
healthcheck:
test: ["CMD", "wget", "--spider", "localhost:11633"]
interval: 1s
timeout: 3s
retries: 60
postgres:
image: postgres:14
environment:
POSTGRES_PASSWORD: postgres
POSTGRES_USER: postgres
healthcheck:
test: pg_isready -U "$$POSTGRES_USER" -d "$$POSTGRES_DB"
interval: 1s
timeout: 5s
retries: 60
ports:
- 5432:5432
adot-collector:
image: amazon/aws-otel-collector:latest
command:
- "--config"
- "/otel-local-config.yaml"
volumes:
- ./collector.config.yaml:/otel-local-config.yaml
environment:
AWS_ACCESS_KEY_ID: ${AWS_ACCESS_KEY_ID}
AWS_SECRET_ACCESS_KEY: ${AWS_SECRET_ACCESS_KEY}
AWS_SESSION_TOKEN: ${AWS_SESSION_TOKEN}
AWS_REGION: ${AWS_REGION}
ports:
- 4317:4317
- 2000:2000
cache:
image: redis:6
restart: unless-stopped
healthcheck:
test: ["CMD", "redis-cli", "ping"]
interval: 1s
timeout: 3s
retries: 60
queue:
image: rabbitmq:3.8-management
restart: unless-stopped
healthcheck:
test: rabbitmq-diagnostics -q check_running
interval: 1s
timeout: 5s
retries: 60
demo-api:
image: kubeshop/demo-pokemon-api:latest
restart: unless-stopped
pull_policy: always
environment:
REDIS_URL: cache
DATABASE_URL: postgresql://postgres:postgres@postgres:5432/postgres?schema=public
RABBITMQ_HOST: queue
POKE_API_BASE_URL: https://pokeapi.co/api/v2
COLLECTOR_ENDPOINT: http://adot-collector:4317
NPM_RUN_COMMAND: api
ports:
- "8081:8081"
healthcheck:
test: ["CMD", "wget", "--spider", "localhost:8081"]
interval: 1s
timeout: 3s
retries: 60
depends_on:
postgres:
condition: service_healthy
cache:
condition: service_healthy
queue:
condition: service_healthy
demo-worker:
image: kubeshop/demo-pokemon-api:latest
restart: unless-stopped
pull_policy: always
environment:
REDIS_URL: cache
DATABASE_URL: postgresql://postgres:postgres@postgres:5432/postgres?schema=public
RABBITMQ_HOST: queue
POKE_API_BASE_URL: https://pokeapi.co/api/v2
COLLECTOR_ENDPOINT: http://adot-collector:4317
NPM_RUN_COMMAND: worker
depends_on:
postgres:
condition: service_healthy
cache:
condition: service_healthy
queue:
condition: service_healthy
demo-rpc:
image: kubeshop/demo-pokemon-api:latest
restart: unless-stopped
pull_policy: always
environment:
REDIS_URL: cache
DATABASE_URL: postgresql://postgres:postgres@postgres:5432/postgres?schema=public
RABBITMQ_HOST: queue
POKE_API_BASE_URL: https://pokeapi.co/api/v2
COLLECTOR_ENDPOINT: http://adot-collector:4317
NPM_RUN_COMMAND: rpc
ports:
- 8082:8082
healthcheck:
test: ["CMD", "lsof", "-i", "8082"]
interval: 1s
timeout: 3s
retries: 60
depends_on:
postgres:
condition: service_healthy
cache:
condition: service_healthy
queue:
condition: service_healthy
```
Alongside the Docker Compose configuration, a `.env` file is used to provide the AWS credentials to the ADOT collector.
```
AWS_ACCESS_KEY_ID="<your-accessKeyId>"
AWS_SECRET_ACCESS_KEY="<your-secretAccessKey>"
AWS_SESSION_TOKEN="<your-session-token>"
AWS_REGION="us-west-2"
```
### Configuring Tracetest
The only requirement to run the Tracetest server is to have a working Postgres instance and provide the connection details either over a config file and/or environment variables. Which looks like the following:
```yaml
# tracetest-config.yaml
---
postgres:
host: postgres
user: postgres
password: postgres
port: 5432
dbname: postgres
params: sslmode=disable
```
In this case, we’ll be provisioning the Tracetest server with the AWS X-Ray configuration so we can ensure it's fully configured to use it as a Data Store from startup. For that the provisioning file should be the following:
```yaml
# tracetest-provision.yaml
---
type: PollingProfile
spec:
name: default
strategy: periodic
default: true
periodic:
retryDelay: 5s
timeout: 10m
---
type: DataStore
spec:
name: awsxray
type: awsxray
awsxray:
accessKeyId: <your-accessKeyId>
secretAccessKey: <your-secretAccessKey>
sessionToken: <your-session-token>
region: "us-west-2"
```
### Configuring the ADOT Collector
As the Pokeshop API generates OpenTelemetry tracing data, the collector needs to be configured to receive that specific format.
Then, export the telemetry data to the AWS Cloud using the AWS X-Ray format.
Finally, specify the pipelines for AWS X-Ray.
```yaml
# collector.config.yaml
receivers:
otlp:
protocols:
grpc:
http:
exporters:
awsxray:
region: ${AWS_REGION}
service:
pipelines:
traces/xr:
receivers: [otlp]
exporters: [awsxray]
```
### Getting the AWS Credentials
If you are familiar with AWS, getting a pair of credentials should be straightforward, but we recommend using temporary credentials to validate this use case. You can run `aws sts get-session-token` from your terminal to get them.
```bash
aws sts get-session-token
[Output]
{
"Credentials": {
"AccessKeyId": "<your-accessKeyId>",
"SecretAccessKey": "<your-secretAccessKey>",
"SessionToken": "<your-session-token>",
"Expiration": "2023-03-29T21:35:14+00:00"
}
}
```
### Running the Use Case
If you are following this and have the example from the repo open, you can run `docker compose up -d`.
Then, open the Tracetest UI at `http://localhost:11633`
To validate that the provisioning works as expected and Tracetest can communicate with AWS X-Ray you can go to the `/settings` page and click the `Test Connection` button.

### Trace-based Testing with Tracetest
Okay, once more into the breach!
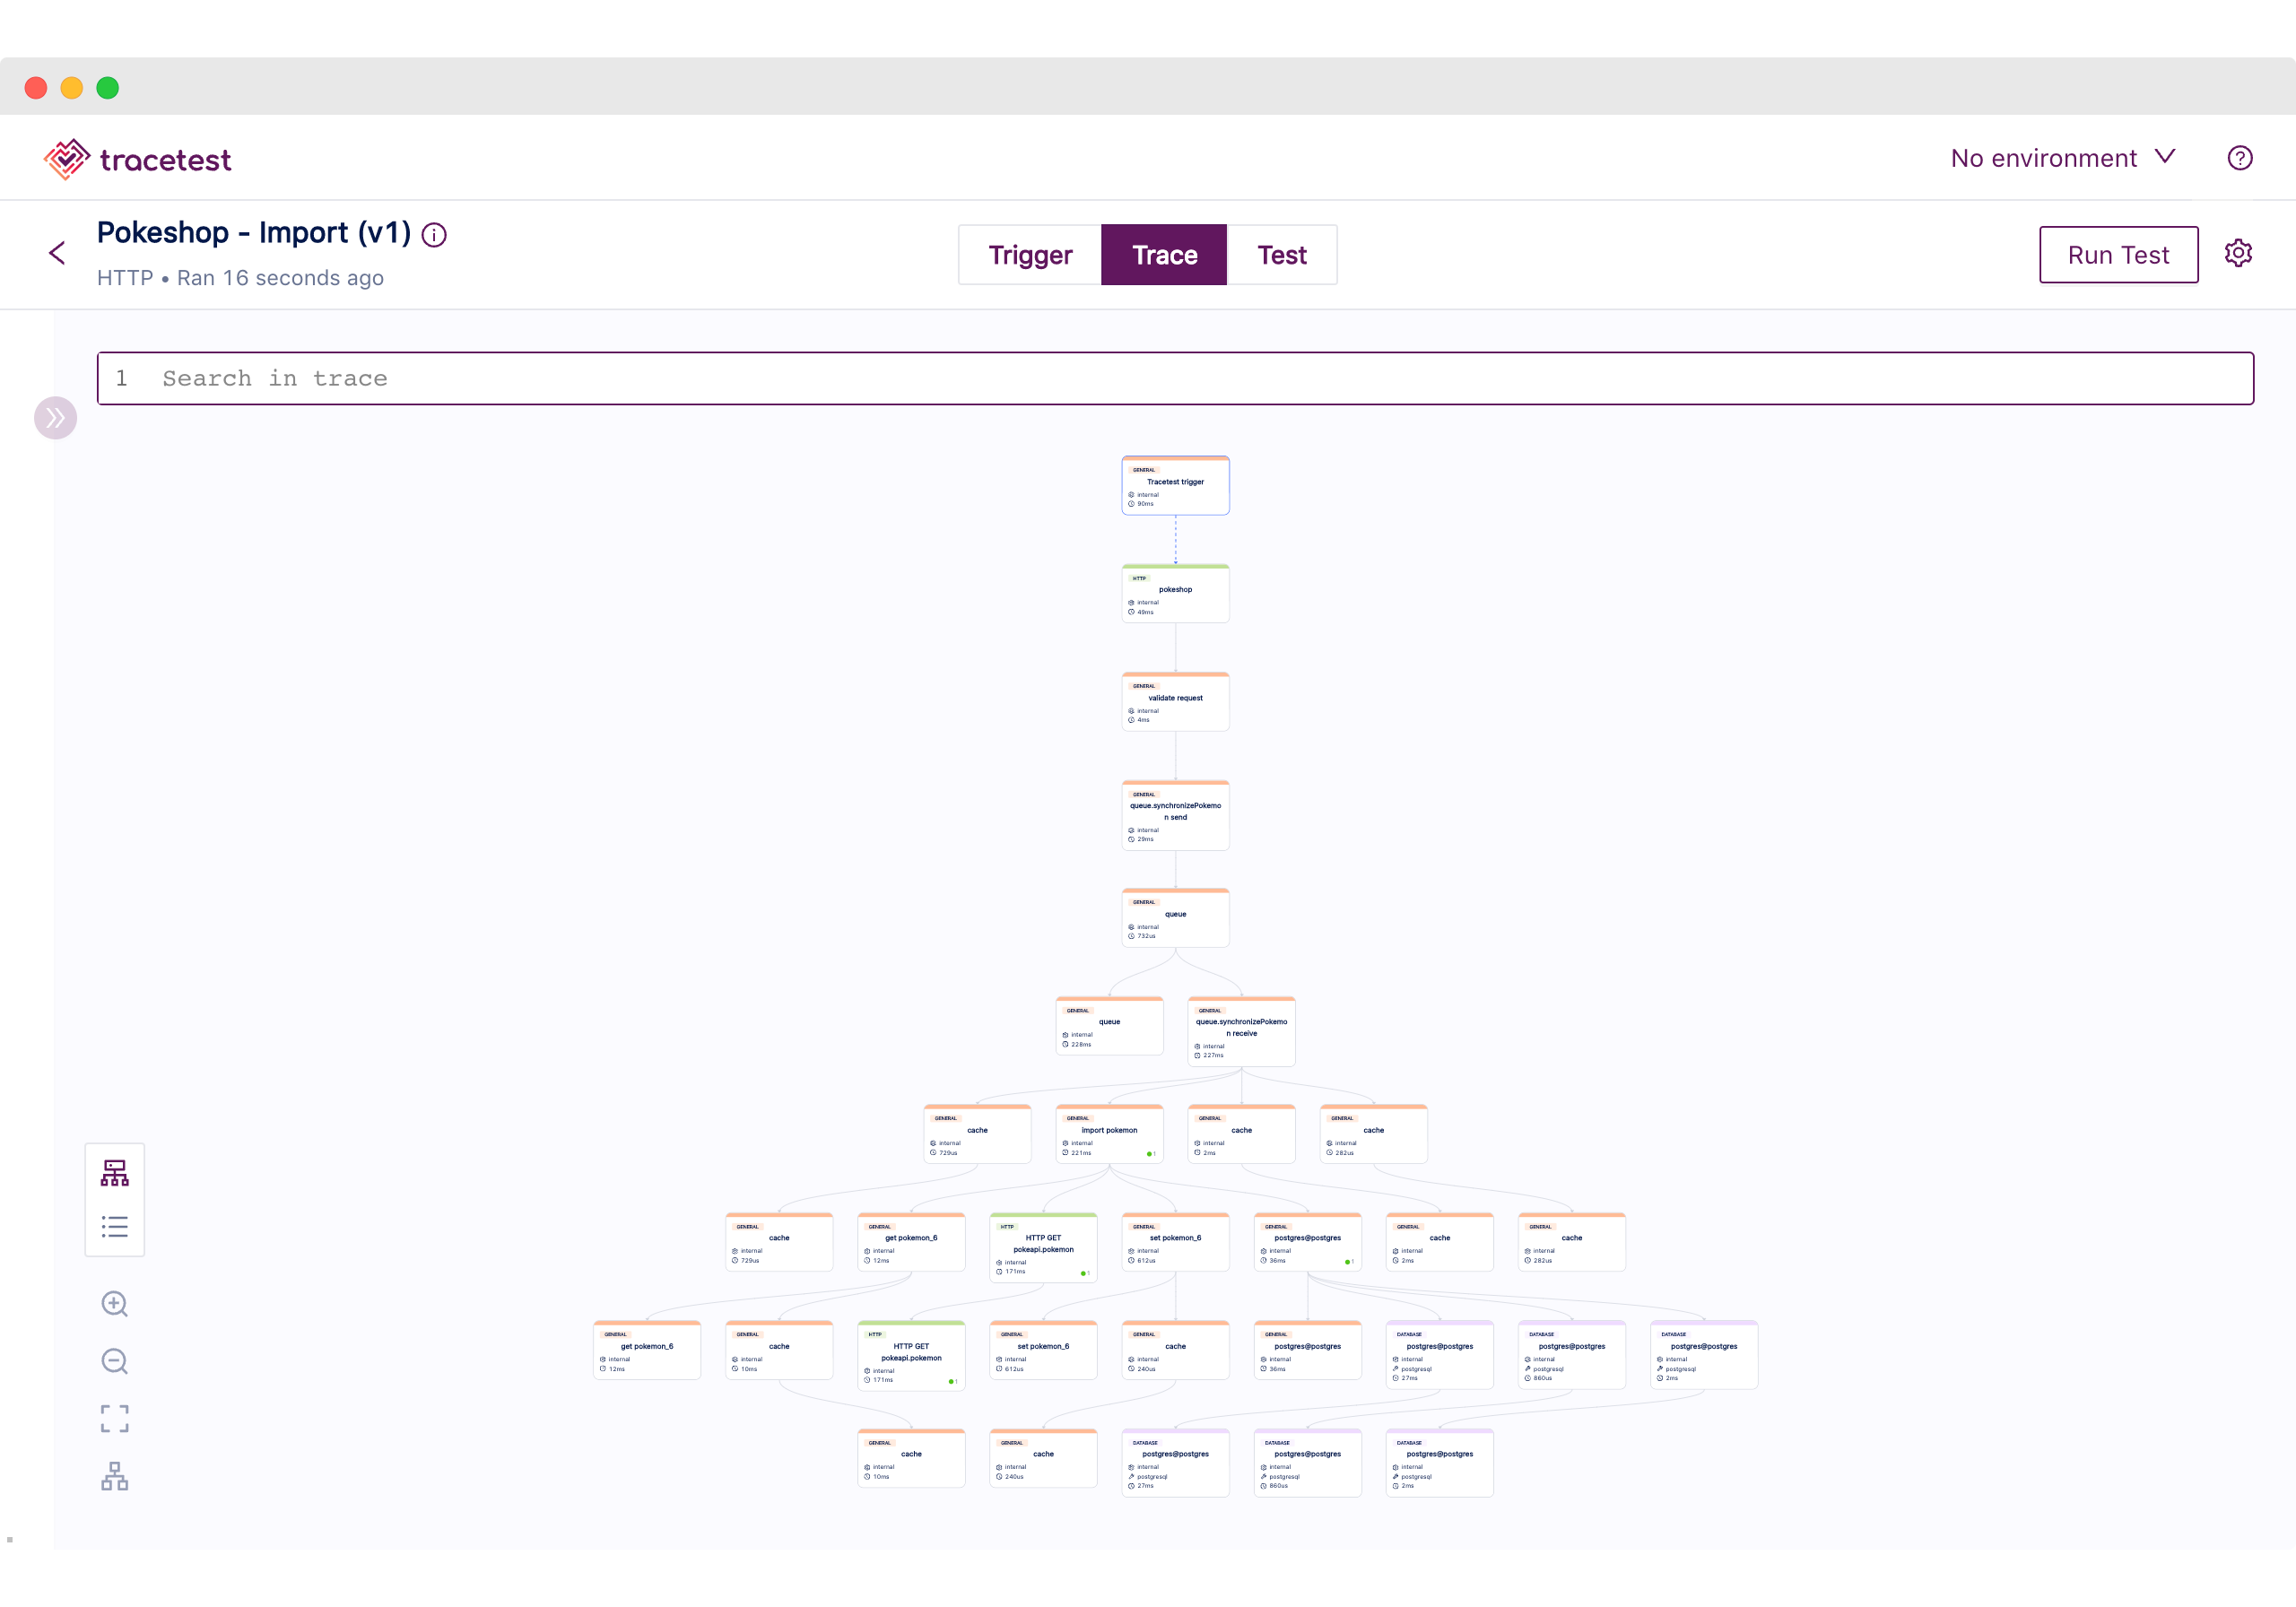
In this last use case, we are going to focus on testing the [import](https://docs.tracetest.io/live-examples/pokeshop/use-cases/import-pokemon) endpoint, which executes an asynchronous process using a message queue and a task worker. It triggers an external API request to grab the Pokemon information by ID/name.
Validating these types of scenarios with integration or end-to-end tests can be quite difficult, as the immediate response clients get is a `201 Accepted` response with no context of what is happening behind the scenes.
In this case, by using trace-based testing we can go further than just validating the initial request/response by also testing the worker process, external requests, and database queries.
Here’s the test definition we are going to be using:
```yaml
# tests/test.yaml
type: Test
spec:
id: -ao9stJVg
name: Pokeshop - Import
description: Import a Pokemon
trigger:
type: http
httpRequest:
url: http://demo-api:8081/pokemon/import
method: POST
headers:
- key: Content-Type
value: application/json
body: '{"id":6}'
specs:
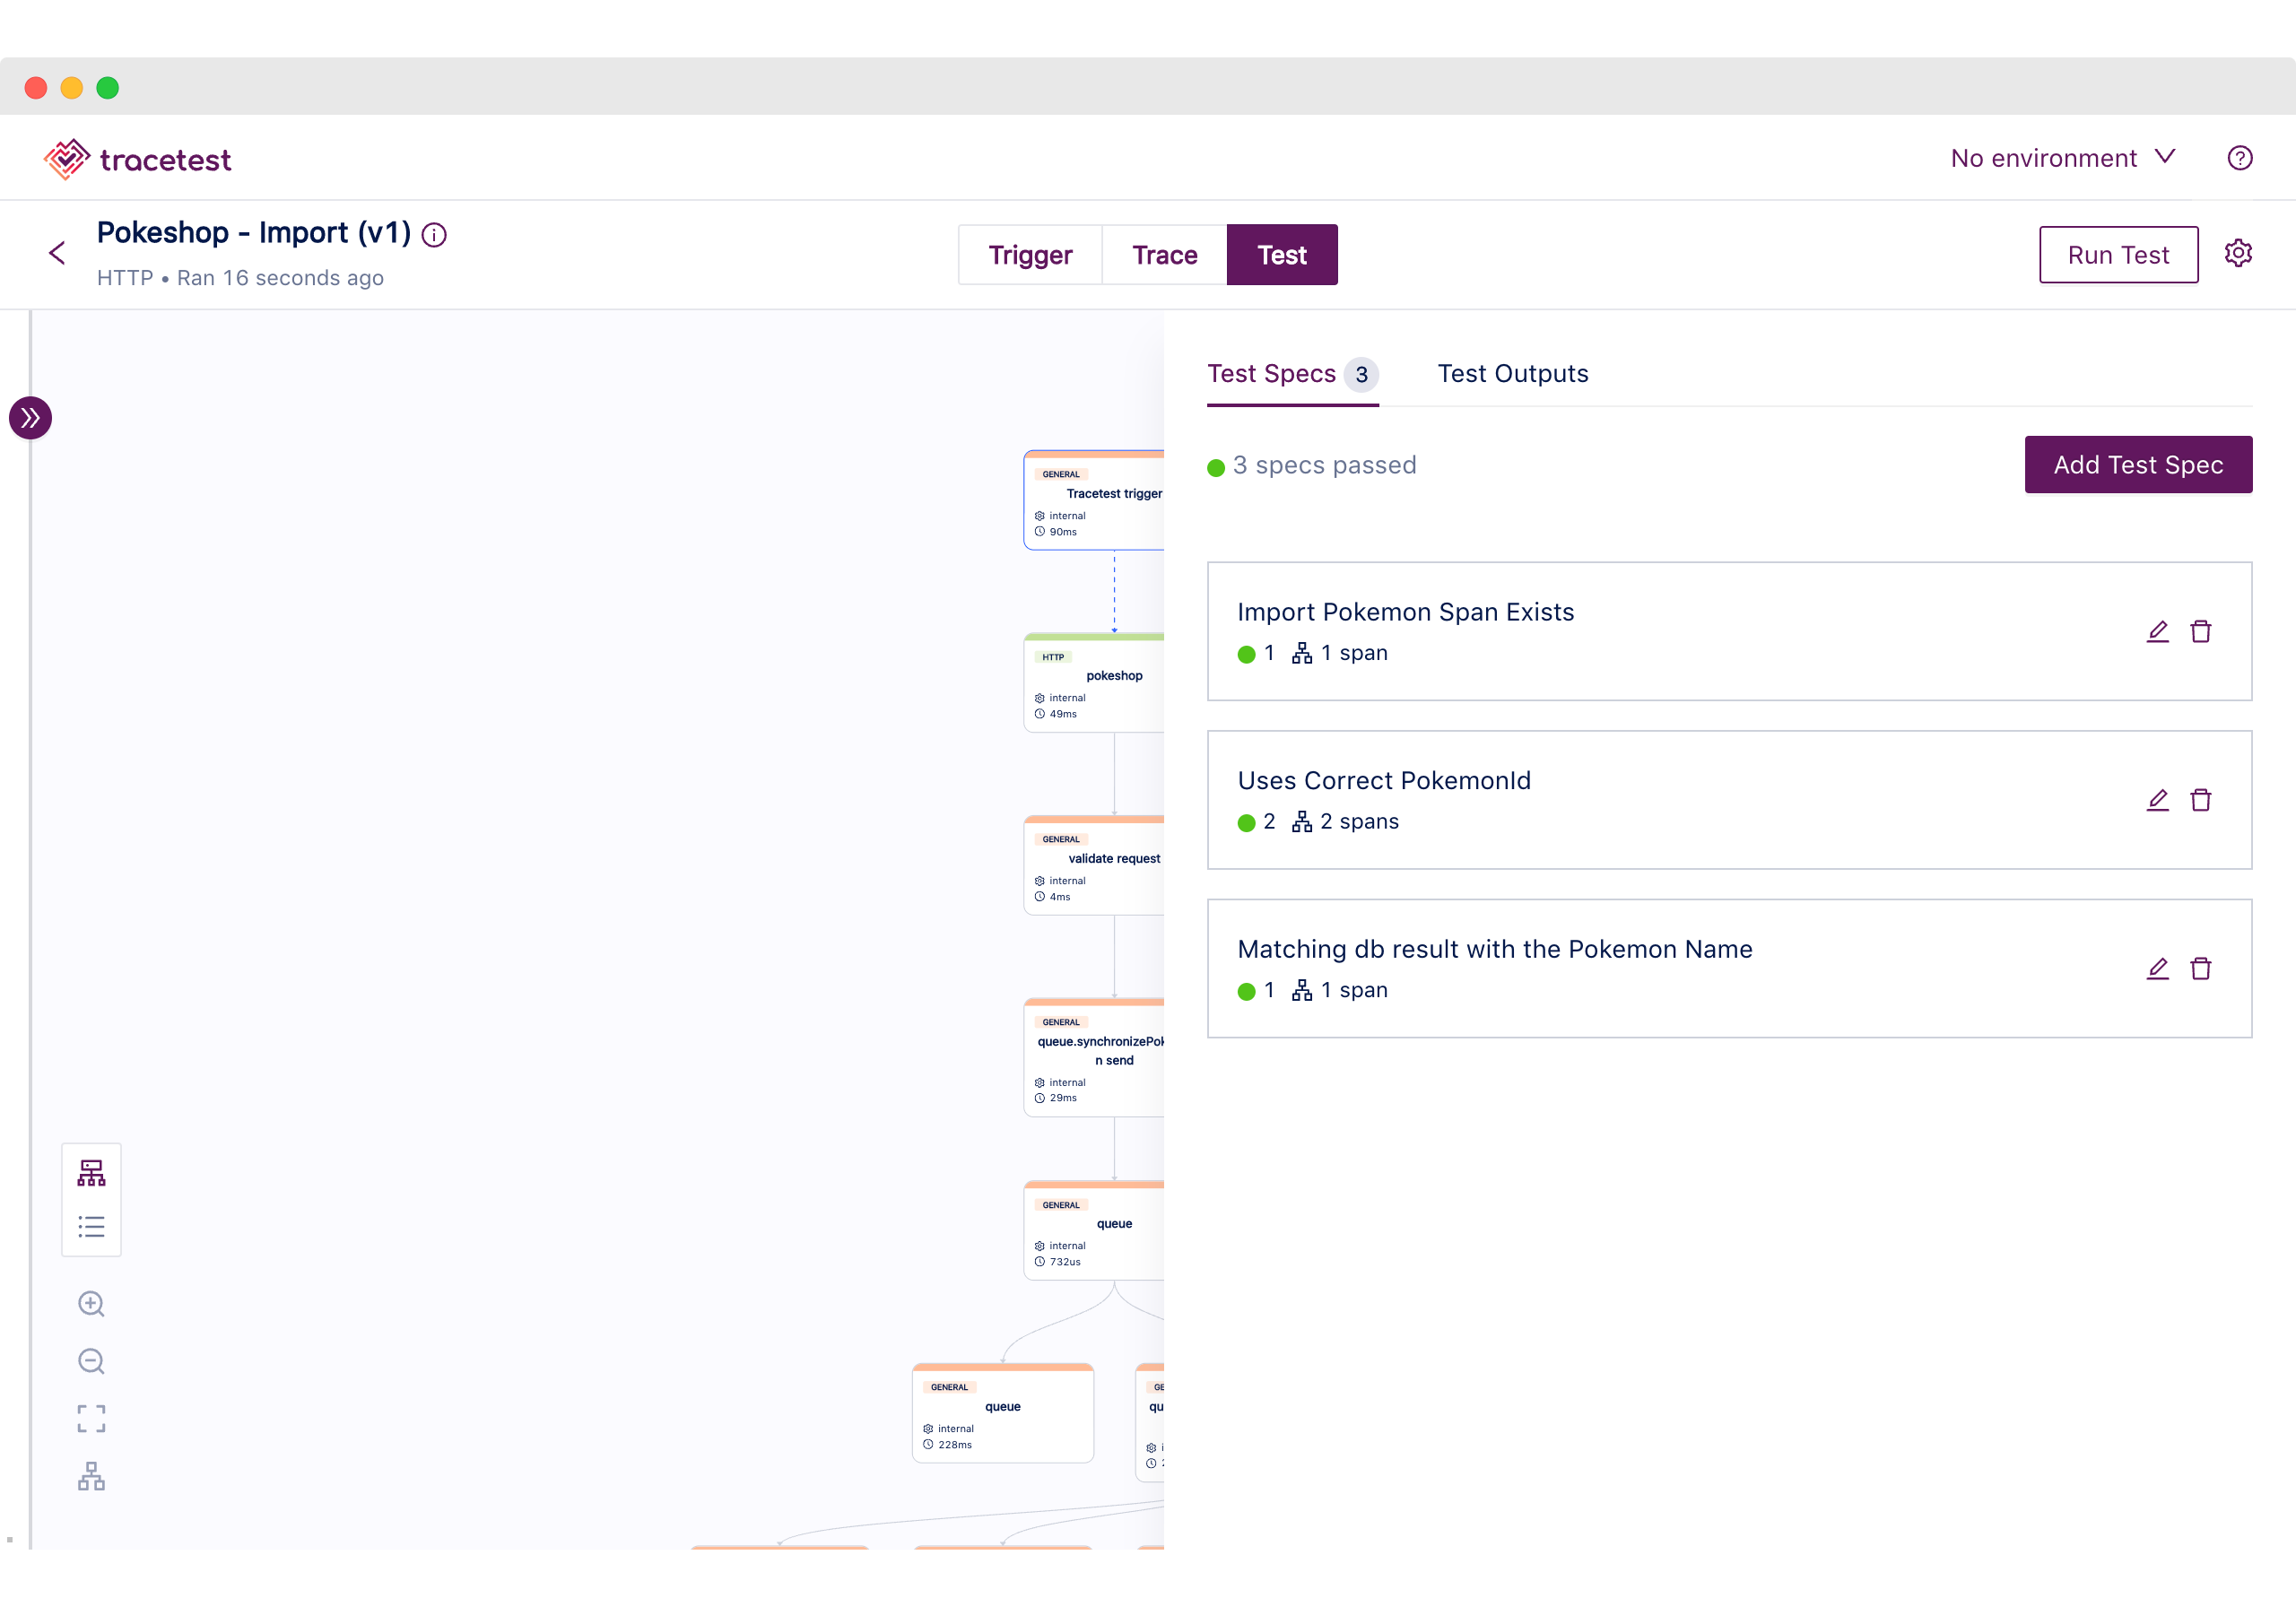
- name: Import Pokemon Span Exists
selector: span[tracetest.span.type="general" name="import pokemon"]
assertions:
- attr:tracetest.selected_spans.count = 1
- name: Uses Correct PokemonId
selector: span[tracetest.span.type="http" name="HTTP GET pokeapi.pokemon" http.method="GET"]
assertions:
- attr:http.url = "https://pokeapi.co/api/v2/pokemon/6"
- name: Matching db result with the Pokemon Name
selector: span[tracetest.span.type="general" name="postgres@postgres"]:first
assertions:
- attr:aws.xray.metadata.default contains "charizard"
```
The first step as before is to configure the Tracetest CLI:
```bash
tracetest configure --endpoint http://localhost:11633 --analytics
```
Then, we can create and run the test:
```bash
tracetest test run -d tests/test.yaml
✔ Pokeshop - Import (http://localhost:11633/test/-ao9stJVg/run/1/test)
```
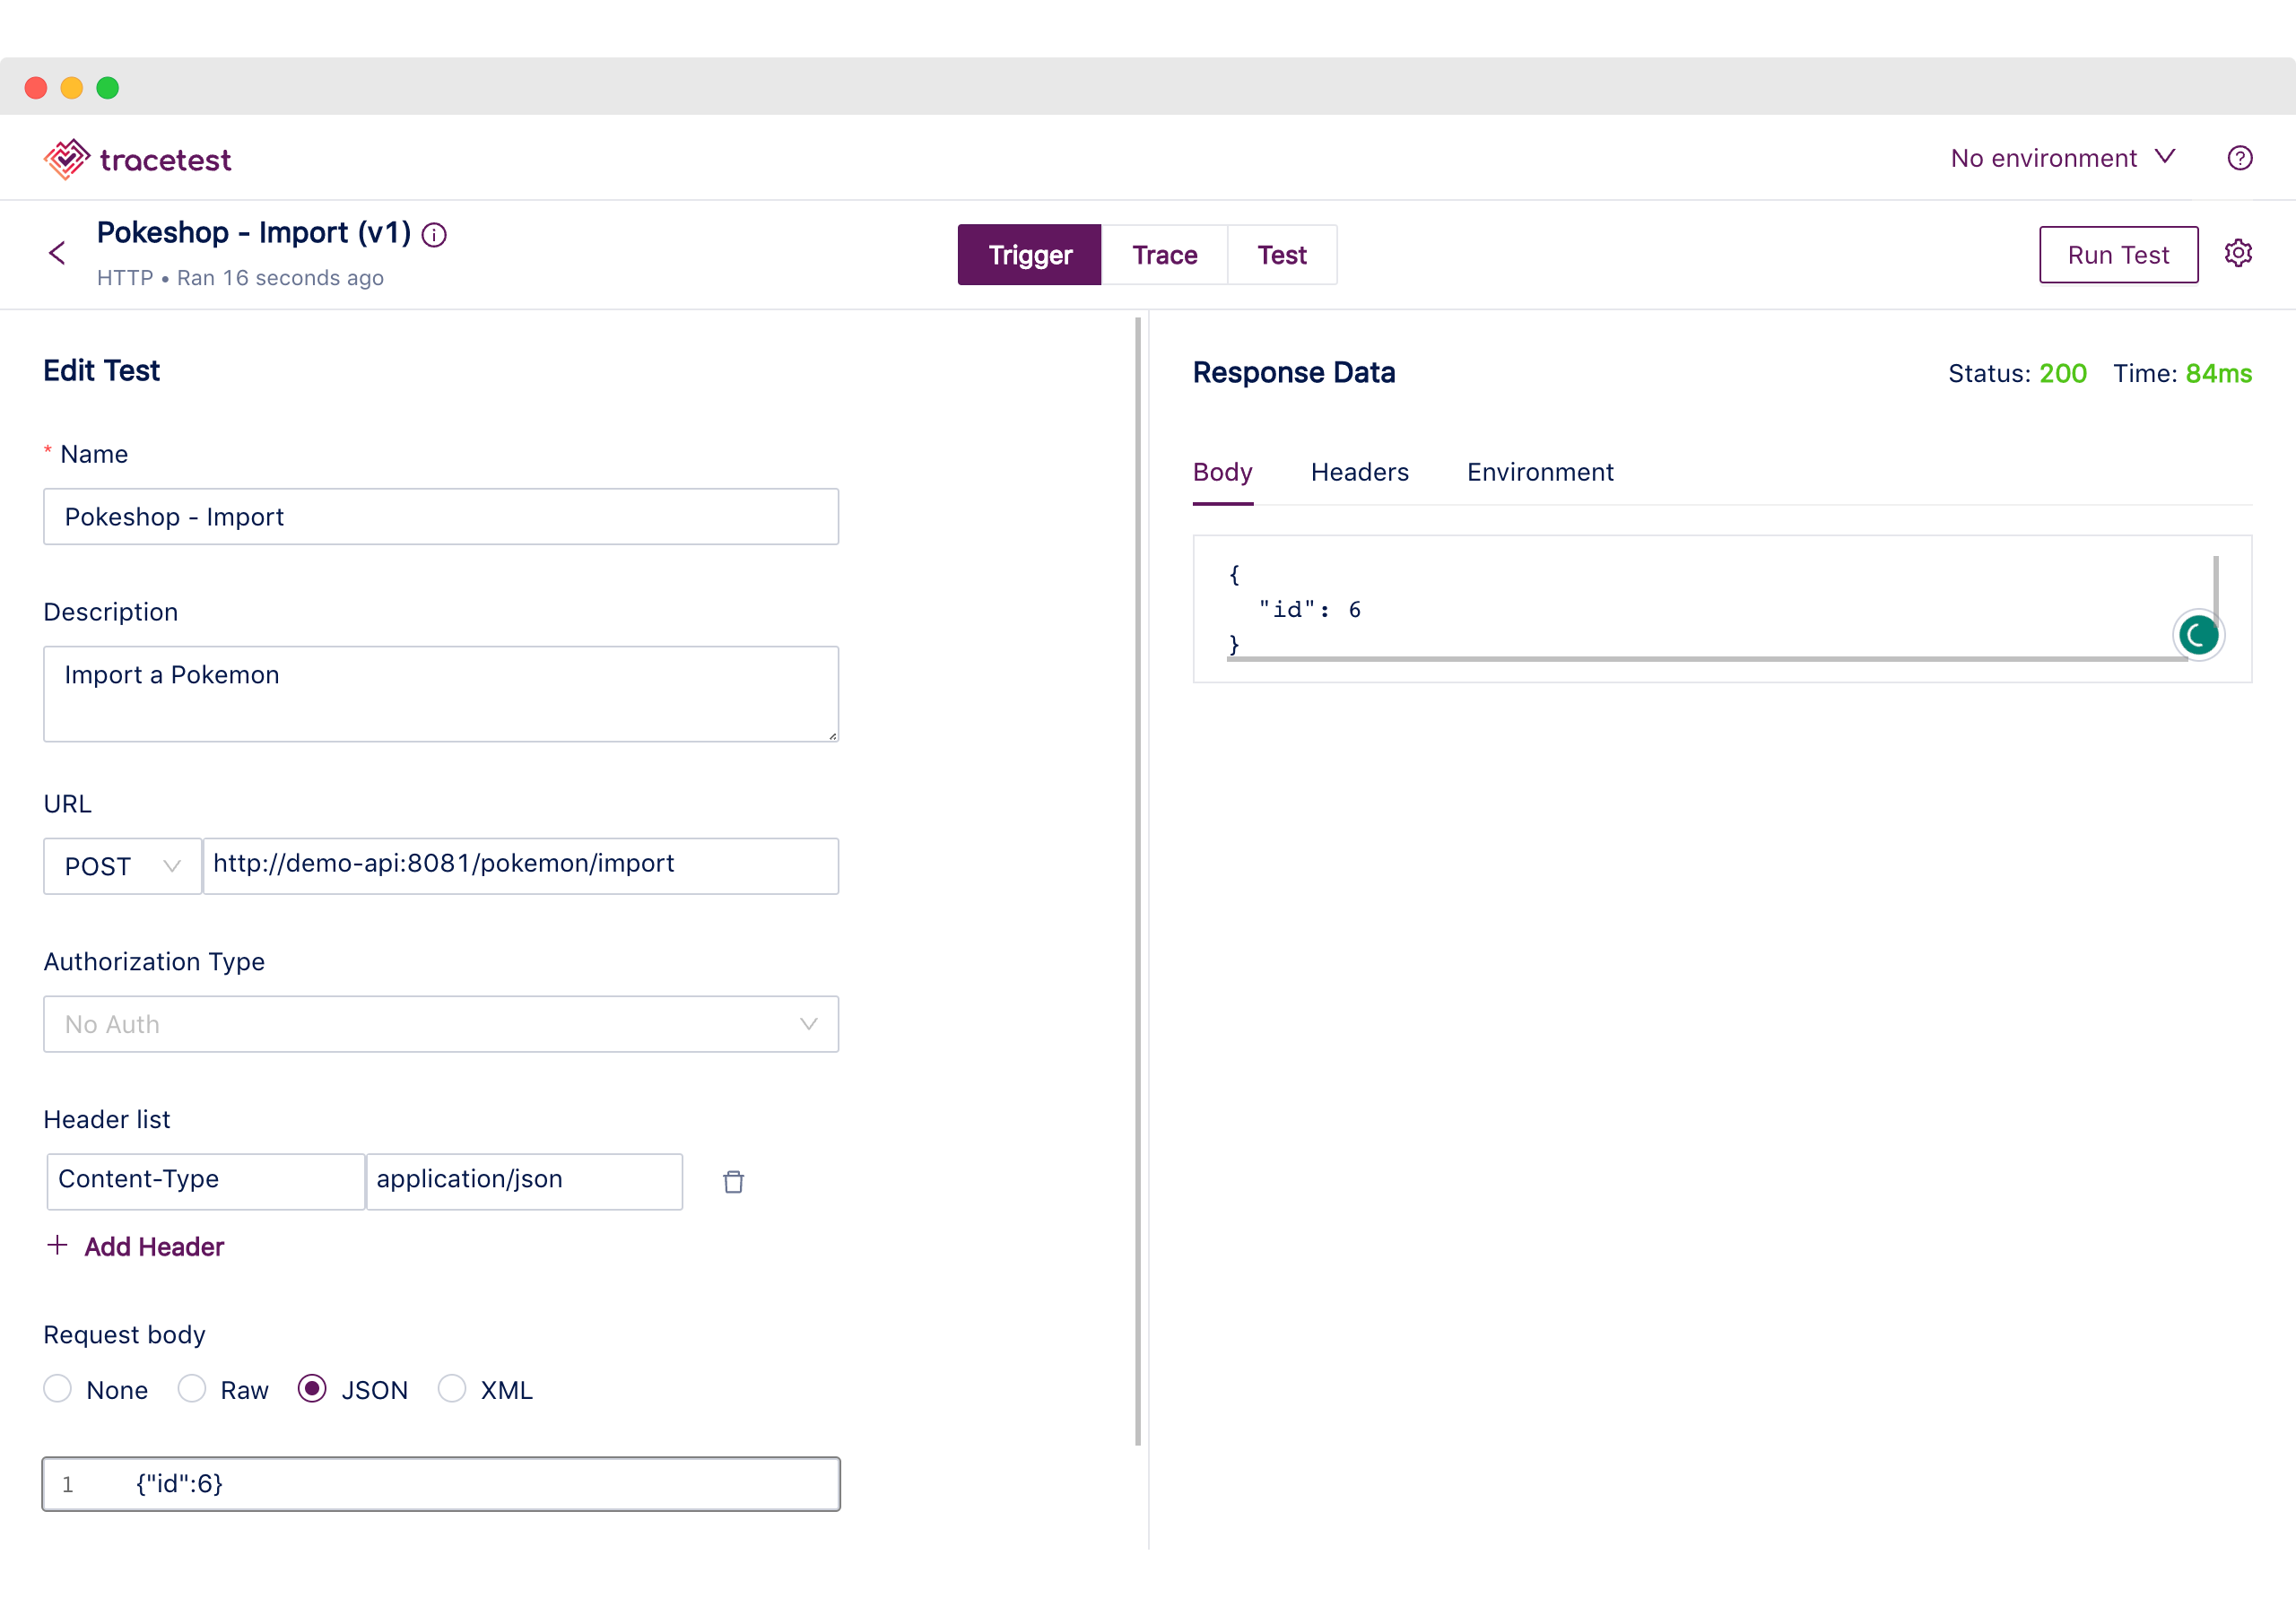
Once we have received the confirmation, the test has been successfully created and we can follow the link to find the trigger information.
A `POST` request is sent to the `/pokemon/import` endpoint with a JSON body including the Pokemon Id.
And the 201 response from the API echoes the ID that will be imported.
After that, we can move to the Trace tab to visualize the list of spans Tracetest got from the transaction.
There you can see the two different processes divided by the message queue spans, which marks the end of the initial request logic and the start of the worker processing the job.

Now we are ready to move to the Trace section to start looking at the test specs. These are focused on validating that the process was completed as expected beyond the initial request and response. Here’s the list of checks:
1. Validating if the Import Span exists, picking up the message from the queue.
2. Using the correct Pokemon ID from the initial request to grab the Pokemon info from the external service.
3. Checking that the database saves the Pokemon we expect by matching it to the name.
With this last use case, we have demonstrated the advantages that trace-based testing provides for testing distributed systems. These are scenarios where the important part to test is not the initial request and response as we want to look deeper into the processes.
## More about trace-based testing cloud-native apps
Well done! You have reached the end of the tutorial! 🎉
We at Tracetest hope that the information provided here is useful for you and your team. Most of us in the team have had situations where working with cloud-native systems became quite complex to debug. We all know about those late-night calls because some random microservice stopped working out of nowhere or the cache layer stopped working and now the database is down because of the number of requests.
With that in mind, a quick recap of this post is:
1. [Tracetest now supports AWS X-Ray!](https://docs.tracetest.io/configuration/connecting-to-data-stores/awsxray)
2. You set up three apps with three different ways of using X-Ray and Tracetest together, part of our core values is that Tracetest works with what you have.
3. You saw the power of Trace-Based Testing, by allowing you to test any part of the request, even if it is asynchronous.
4. Guide you through the three core sections of a Tracetest test run: Trigger, Trace, and Test.
Last, but not least - if would you like to learn more about Tracetest and what it brings to the table? Check the [docs](https://docs.tracetest.io/examples-tutorials/recipes/running-tracetest-with-lightstep/) and try it out by [downloading](https://tracetest.io/download) it today.
Also, please feel free to join our [Slack community](https://dub.sh/tracetest-community), give [Tracetest a star on GitHub](https://github.com/kubeshop/tracetest), or schedule a [time to chat 1:1](http://calendly.com/ken-kubeshop/otel-user-interview-w-tracetest).
.jpg)
.avif)
.avif)