
Trace-based Testing AWS Lambda with Tracetest
.avif)
%20(1).avif)
Learn how to instrument a Node.js Lambda function using OpenTelemetry, store tracing data in Jaeger, and run trace-based testing with Tracetest!
Table of Contents
Since the initial release of AWS Lambda back in 2014, developers have seen the great potential of having a FaaS (Function as a Service) distributed system. It avoided the pain of maintaining EC2 instances, load balancers, target groups and more. Soon enough, we saw the birth of frameworks like Serverless or SAM that make managing these serverless functions easier.
We started building REST APIs, creating workers and cron jobs using AWS CloudWatch and listening to different AWS services events like S3. However, we did not realize that at some point it would get complex to understand how all of these services interact with each other. It would get even harder to ensure full visibility of every step that is taken to complete several tasks that move through the distributed system.
Today, standard protocols like [OpenTelemetry](https://opentelemetry.io/) exist to help teams implement observability as part of the development process and provide a clear understanding of what their serverless application is doing.
After reading this blog post, you will learn how to instrument a basic Node.js Lambda function using OpenTelemetry to provide better insights into what the code is doing, store the tracing data in [Jaeger](https://www.jaegertracing.io/) where you can visualize and query the information and run [trace-based testing](https://thenewstack.io/trace-based-testing-for-a-distributed-world/) with Tracetest to include automated validations based on the generated telemetry data.
> You can also find a recipe for this use case in the Tracetest [official docs, here](https://docs.tracetest.io/examples-tutorials/recipes/running-tracetest-with-aws-terraform).
Let’s begin.
## Basic Concepts
First, let’s explain a few basic concepts to give you context and clarity about what we are going to do once we begin the setup.
## What is AWS Lambda?
[AWS Lambda](https://www.google.com/search?q=aws+lambda&rlz=1C5CHFA_enBA989BA989&oq=aws+lambda&aqs=chrome.0.0i512l5j69i60l3.918j0j7&sourceid=chrome&ie=UTF-8) is a computing service that lets you run code without provisioning or managing servers. Lambda runs your code on a high-availability compute infrastructure and performs all of the administration of the compute resources, including server and operating system maintenance, capacity provisioning and automatic scaling and logging. With Lambda, you can run code for virtually any type of application or back-end service. All you need to do is supply your code in one of the [languages that Lambda supports](https://docs.aws.amazon.com/lambda/latest/dg/lambda-runtimes.html).
Currently, there are several frameworks to manage Lambda functions by enabling a streamlined way for you to create APIs, workers, cron jobs, etc. So your team can focus on the product requirements and business logic. Some of them are:
- [Serverless](https://www.serverless.com/)
- [AWS SAM](https://aws.amazon.com/serverless/sam/)
- [AWS Chalice](https://github.com/aws/chalice)
- [Claudia.js](https://claudiajs.com/)
## What is AWS ECS Fargate?
[AWS Fargate](https://aws.amazon.com/fargate/) is a serverless, pay-as-you-go compute engine that lets you focus on building applications without managing servers. AWS Fargate is compatible [with both Amazon Elastic Container Service](https://aws.amazon.com/ecs/?pg=ln&sec=hiw) (ECS) and [Amazon Elastic Kubernetes Service](https://aws.amazon.com/eks/?pg=ln&sec=hiw) (EKS).
We are going to be using ECS Fargate as a streamlined way of deploying Tracetest to the AWS cloud.
## What is Terraform?
[HashiCorp Terraform](https://www.terraform.io/) is an infrastructure as code (IaC) tool that lets you define both cloud and on-prem resources in human-readable configuration files that you can version, reuse and share. You can then use a consistent workflow to provision and manage all of your infrastructure throughout its lifecycle. Terraform can manage low-level components like computing, storage and networking resources, as well as high-level components like DNS entries and SaaS features.
Terraform will be the base framework we’ll use to manage all AWS services, as well as package and deploy the Lambda function
## What is Tracetest?
[Tracetest](https://tracetest.io/) is an [open-source project](https://github.com/kubeshop/tracetest), part of the CNCF landscape. It allows you to quickly build integration and end-to-end tests, powered by your OpenTelemetry traces.
Tracetest uses your existing OpenTelemetry traces to power trace-based testing with assertions against your trace data at every point of the request transaction. You only need to point Tracetest to your existing trace data source, or send traces to Tracetest directly!
Tracetest makes it possible to:
- Define tests and assertions against every single microservice that a transaction goes through.
- Work with your existing distributed tracing solution, allowing you to build tests based on your already instrumented system.
- Define multiple transaction triggers, such as a GET against an API endpoint, a GRPC request, etc.
- Define assertions against both the response and trace data, ensuring both your response and the underlying processes worked correctly, quickly and without errors.
- Save and run the tests manually or via CI build jobs with the Tracetest CLI.
## Setting up the AWS Infrastructure
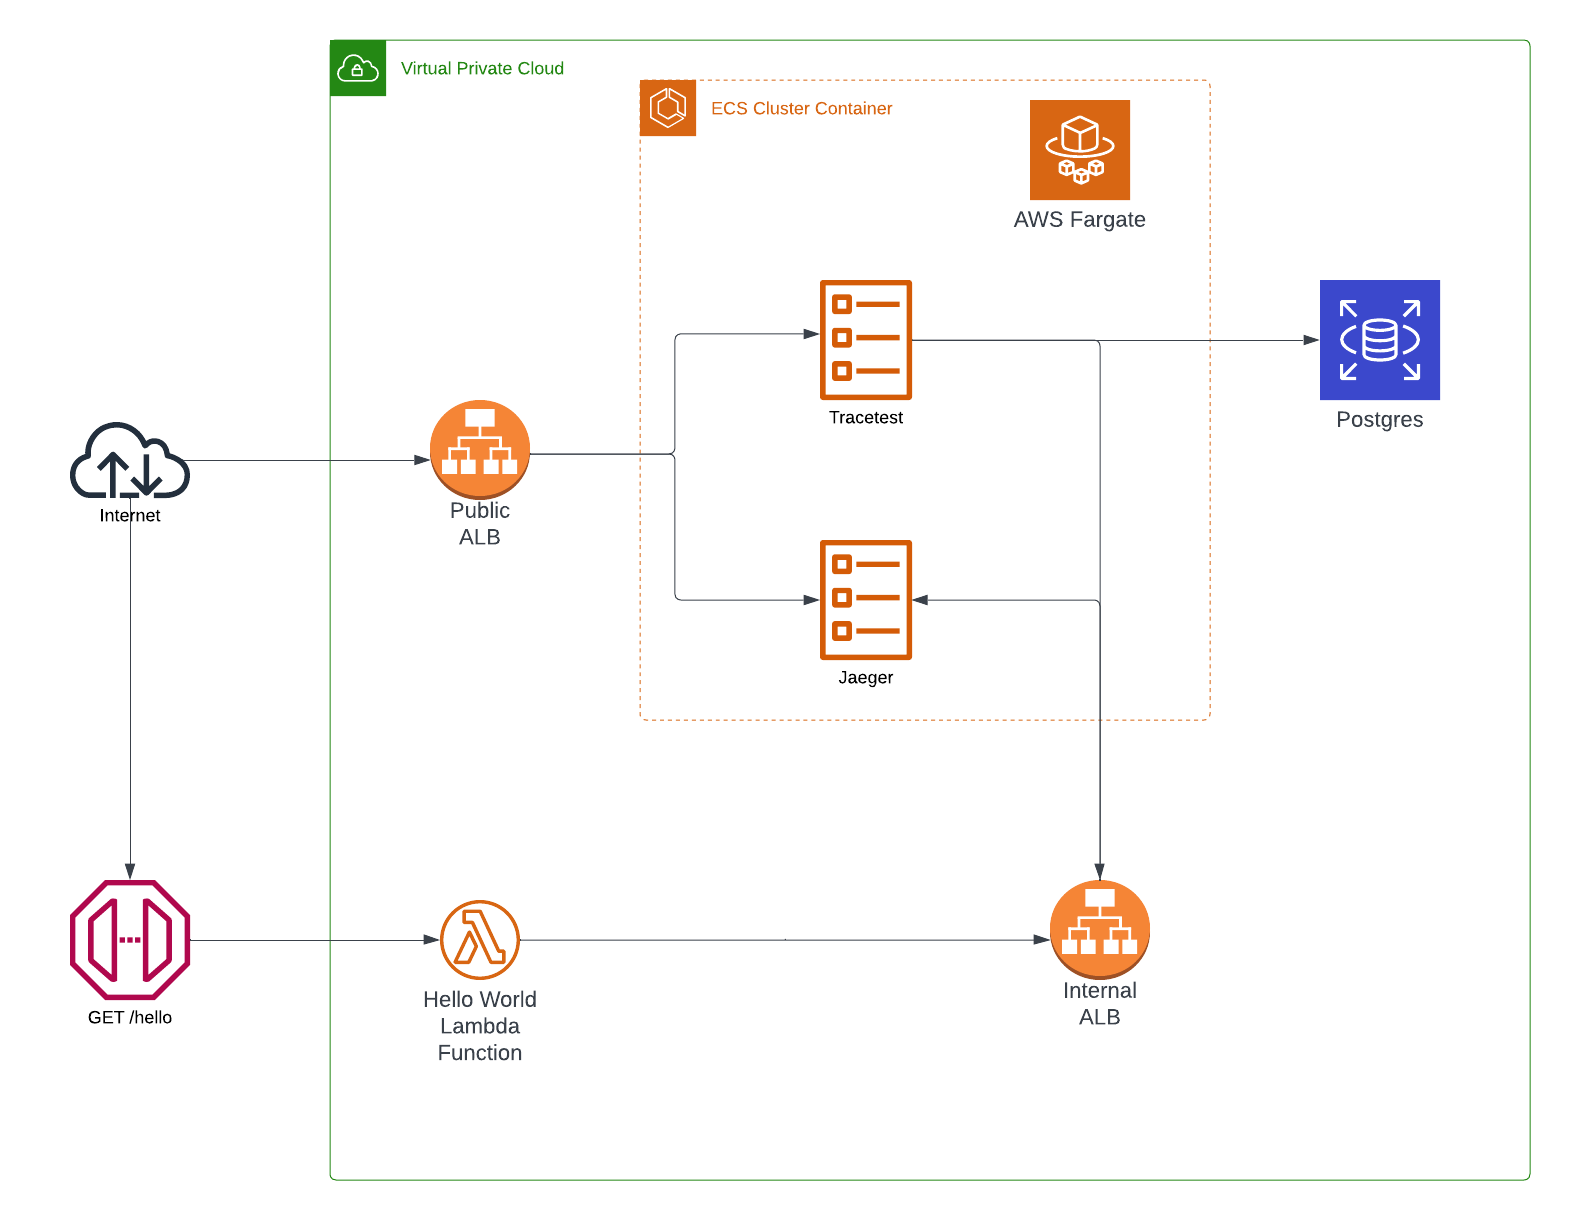
We are going to use Terraform to provision all of the required AWS infrastructure. It includes:
1. **Networking.** VPCs, Security Groups, Internal, and Public Load Balancers.
2. **The REST API**. Lambda, API Gateway, S3 bucket.
3. **Telemetry Side Cart.** ECS Cluster, Fargate Task definitions, Jaeger, Tracetest.
### Cloud Infrastructure Diagram
## What do I need to run the Use Case?
Here are the requirements to run the use case:
1. [Terraform](https://developer.hashicorp.com/terraform/cli/commands)
2. [AWS Access](https://registry.terraform.io/providers/hashicorp/aws/latest/docs)
3. [Tracetest CLI](https://docs.tracetest.io/getting-started/installation/)
## Initial Terraform Definitions
To encourage a better understanding of the Terraform code definitions, we’ll be using external and local variables defined in the [`variables.tf`](https://github.com/kubeshop/tracetest/blob/main/examples/tracetest-aws-terraform-serverless/variables.tf) file, which also, includes the initial setup for the required providers such as AWS.
```terraform
// variables.tf
// defining the dependencies and packages
terraform {
required_providers {
aws = {
source = "hashicorp/aws"
version = "4.55.0"
}
tls = {
source = "hashicorp/tls"
version = "4.0.4"
}
}
}
provider "aws" {
region = local.region
}
data "aws_caller_identity" "current" {}
data "aws_availability_zones" "available" {}
// external variables
variable "aws_region" {
type = string
default = "us-west-2"
}
variable "tracetest_version" {
type = string
default = "latest"
}
variable "environment" {
type = string
default = "dev"
}
// prefixes, naming convention and static variables
locals {
name = "tracetest"
region = var.aws_region
tracetest_image = "kubeshop/tracetest:${var.tracetest_version}"
environment = var.environment
db_name = "postgres"
db_username = "postgres"
vpc_cidr = "192.168.0.0/16"
azs = slice(data.aws_availability_zones.available.names, 0, 3)
// used to provision the Tracetest server
provisioning = <<EOF
---
type: PollingProfile
spec:
name: default
strategy: periodic
default: true
periodic:
retryDelay: 5s
timeout: 10m
---
type: DataStore
spec:
name: jaeger
type: jaeger
jaeger:
endpoint: ${aws_lb.internal_tracetest_alb.dns_name}:16685
tls:
insecure_skip_verify: true
EOF
tags = {
Name = local.name
Example = local.name
}
}
```
In the following Terraform definition files, you’ll find references to the local variables defined in this file.
## Network Definitions
First, we need to set up the base definitions that will allow communication between the different services we will be generating. Part of this section is to provide public access to certain services like the Serverless API, Jaeger UI and Tracetest as well as ensure VPC protection for others like the RDS Postgres instance.
```terraform
// network.tf
// creating the main VPC resources, including private and public subnets
module "network" {
source = "cn-terraform/networking/aws"
name_prefix = local.name
vpc_cidr_block = local.vpc_cidr
availability_zones = ["${local.region}a", "${local.region}b", "${local.region}c", "${local.region}d"]
public_subnets_cidrs_per_availability_zone = ["192.168.0.0/19", "192.168.32.0/19", "192.168.64.0/19", "192.168.96.0/19"]
private_subnets_cidrs_per_availability_zone = ["192.168.128.0/19", "192.168.160.0/19", "192.168.192.0/19", "192.168.224.0/19"]
}
// configuration pieces for the public ALB
module "tracetest_alb_security_group" {
source = "terraform-aws-modules/security-group/aws"
version = "~> 4.0"
name = local.name
description = "Load balancer security group"
vpc_id = module.network.vpc_id
ingress_with_cidr_blocks = [
{
from_port = 11633
to_port = 11633
protocol = "tcp"
description = "HTTP access for Tracetest"
cidr_blocks = "0.0.0.0/0"
}, {
from_port = 16686
to_port = 16686
protocol = "tcp"
description = "HTTP access for Jaeger UI"
cidr_blocks = "0.0.0.0/0"
}, {
from_port = 16685
to_port = 16685
protocol = "tcp"
description = "HTTP access for Jaeger API"
cidr_blocks = "0.0.0.0/0"
}]
egress_with_cidr_blocks = [
{
from_port = 0
to_port = 65535
protocol = "-1"
description = "HTTP access to anywhere"
cidr_blocks = "0.0.0.0/0"
}]
}
resource "aws_lb" "tracetest-alb" {
name = "tracetest-alb"
internal = false
load_balancer_type = "application"
security_groups = [module.tracetest_alb_security_group.security_group_id]
subnets = module.network.public_subnets_ids
enable_deletion_protection = false
tags = local.tags
}
// creation of the internal ALB
module "internal_tracetest_alb_security_group" {
source = "terraform-aws-modules/security-group/aws"
version = "~> 4.0"
name = local.name
description = "Internal Load balancer security group"
vpc_id = module.network.vpc_id
ingress_with_cidr_blocks = [
{
from_port = 16685
to_port = 16685
protocol = "tcp"
description = "HTTP access for Jaeger API"
cidr_blocks = local.vpc_cidr
}, {
from_port = 4318
to_port = 4318
protocol = "tcp"
description = "HTTP access for Jaeger Collector"
cidr_blocks = local.vpc_cidr
}]
egress_with_cidr_blocks = [
{
from_port = 0
to_port = 65535
protocol = "-1"
description = "HTTP access to Anywhere"
cidr_blocks = "0.0.0.0/0"
}]
}
resource "aws_lb" "internal_tracetest_alb" {
name = "tracetest-internal-alb"
internal = true
load_balancer_type = "application"
security_groups = [module.internal_tracetest_alb_security_group.security_group_id]
subnets = module.network.private_subnets_ids
enable_deletion_protection = false
tags = local.tags
}
// security groups for services
module "lambda_security_group" {
source = "terraform-aws-modules/security-group/aws"
version = "~> 4.0"
name = "${local.name}_lambda_security_group"
description = "Lambda security group"
vpc_id = module.network.vpc_id
ingress_with_cidr_blocks = [
{
from_port = 0
to_port = 65535
protocol = "-1"
description = "HTTP access from anywhere"
cidr_blocks = "0.0.0.0/0"
}]
egress_with_cidr_blocks = [
{
from_port = 0
to_port = 65535
protocol = "-1"
description = "HTTP access to anywhere"
cidr_blocks = "0.0.0.0/0"
}]
}
module "tracetest_ecs_service_security_group" {
source = "terraform-aws-modules/security-group/aws"
version = "~> 4.0"
name = "tracetest_ecs_service_security_group"
description = "ECS Service security group"
vpc_id = module.network.vpc_id
ingress_with_cidr_blocks = [
{
from_port = 0
to_port = 65535
protocol = "tcp"
description = "HTTP access from VPC"
cidr_blocks = local.vpc_cidr
}]
egress_with_cidr_blocks = [
{
from_port = 0
to_port = 65535
protocol = "-1"
description = "HTTP access to anywhere"
cidr_blocks = "0.0.0.0/0"
}]
}
```
## REST API Definitions
The REST API is composed of two major sections. The first section contains the Node.js handler code for the Lambda functions. The second covers the creation of AWS resources.
Let’s start with the Node.js handler code and the instrumentation code to enable distributed tracing.
> *You can find the code described in this section in the [Tracetest GitHub repo under the examples](https://github.com/kubeshop/tracetest/tree/main/examples/tracetest-aws-terraform-serverless) folder. There you can find the [src](https://github.com/kubeshop/tracetest/tree/main/examples/tracetest-aws-terraform-serverless/src) and [api.tf](https://github.com/kubeshop/tracetest/blob/main/examples/tracetest-aws-terraform-serverless/api.tf) files.*
>
The handler code for this use case is included in the `src` folder and is composed of the `package.json` file, the main handler function called `hello.js` and the `tracing.js` file which includes the OpenTelemetry instrumentation.
### The Node.js Handler Code for the Lambda Function
In this case, we’ll be building a pretty basic Javascript function that returns a “Hello, World!” message on each request.
```javascript
// src/hello.js
const handler = async (event) => {
console.log("Event: ", event);
let responseMessage = "Hello, World!";
return {
statusCode: 200,
headers: {
"Content-Type": "application/json",
},
body: JSON.stringify({
message: responseMessage,
}),
};
};
module.exports.handler = handler;
```
### Instrumenting the Handler Function with OpenTelemetry
Next, let’s add a second Javascript file that will include all of the setup and configuration to enable automated instrumentation for distributed tracing with OpenTelemetry.
```javascript
// src/tracing.js
const { Resource } = require("@opentelemetry/resources");
const api = require("@opentelemetry/api");
const { BatchSpanProcessor } = require("@opentelemetry/sdk-trace-base");
const { OTLPTraceExporter } = require("@opentelemetry/exporter-trace-otlp-http");
const { NodeTracerProvider } = require("@opentelemetry/sdk-trace-node");
const { registerInstrumentations } = require("@opentelemetry/instrumentation");
const { getNodeAutoInstrumentations } = require("@opentelemetry/auto-instrumentations-node");
const { SemanticResourceAttributes } = require("@opentelemetry/semantic-conventions");
const provider = new NodeTracerProvider({
resource: new Resource({
[SemanticResourceAttributes.SERVICE_NAME]: "tracetest",
}),
});
const spanProcessor = new BatchSpanProcessor(new OTLPTraceExporter());
provider.addSpanProcessor(spanProcessor);
provider.register();
registerInstrumentations({
instrumentations: [
getNodeAutoInstrumentations({
"@opentelemetry/instrumentation-aws-lambda": {
disableAwsContextPropagation: true,
eventContextExtractor: (event) => {
// Tracetest sends the traceparent header as Traceparent
// passive aggressive author comment 🥴 The propagators doesn't care about changing the casing before matching
event.headers.traceparent = event.headers.Traceparent;
const eventContext = api.propagation.extract(api.context.active(), event.headers);
return eventContext;
},
},
}),
],
});
```
### Installing the Dependencies
Now that we have the base JavaScript code ready, its time to include the required modules to run the app, this is the `package.json` we are going to be using:
```json
# src/package.json
{
"name": "tracetest-aws",
"version": "1.0.0",
"description": "",
"main": "hello.js",
"scripts": {
"test": "echo \"Error: no test specified\" && exit 1"
},
"author": "",
"license": "ISC",
"dependencies": {
"@opentelemetry/auto-instrumentations-node": "^0.36.3",
"@opentelemetry/instrumentation": "^0.35.1",
"@opentelemetry/resources": "^1.9.1",
"@opentelemetry/sdk-node": "^0.35.1",
"@opentelemetry/sdk-trace-node": "^1.9.1",
"@opentelemetry/semantic-conventions": "^1.9.1"
}
}
```
> To match the Lambda Node.js versions, switch any 12.x version to install the packages
Then, the last step is to run the `npm install` command to have all of the packages installed.
### Provision a Serverless API with Terraform
To finalize the API section, we will define the required services using Terraform.
```terraform
// api.tf
resource "aws_lambda_function" "hello_world" {
function_name = "HelloWorld"
s3_bucket = aws_s3_bucket.lambda_bucket.id
s3_key = aws_s3_object.lambda_hello_world.key
runtime = "nodejs12.x"
handler = "hello.handler"
timeout = 30
// This allows the tracing.js file to be loaded before the handler hello.js function
/ // to ensure the tracing logic is the first piece of code to be executed
environment {
variables = {
NODE_OPTIONS = "--require tracing.js"
OTEL_EXPORTER_OTLP_ENDPOINT = "http://${aws_lb.internal_tracetest_alb.dns_name}:4318"
}
}
source_code_hash = data.archive_file.lambda_hello_world.output_base64sha256
vpc_config {
subnet_ids = module.network.public_subnets_ids
security_group_ids = [module.lambda_security_group.security_group_id]
}
role = aws_iam_role.lambda_exec.arn
}
resource "aws_cloudwatch_log_group" "hello_world" {
name = "/aws/lambda/${aws_lambda_function.hello_world.function_name}"
retention_in_days = 30
}
resource "aws_iam_role" "lambda_exec" {
name = "${local.name}_serverless_lambda"
assume_role_policy = jsonencode({
Version = "2012-10-17"
Statement = [{
Action = "sts:AssumeRole"
Effect = "Allow"
Sid = ""
Principal = {
Service = "lambda.amazonaws.com"
}
}
]
})
}
resource "aws_iam_role_policy_attachment" "lambda_policy" {
role = aws_iam_role.lambda_exec.name
policy_arn = "arn:aws:iam::aws:policy/service-role/AWSLambdaBasicExecutionRole"
}
resource "aws_iam_role_policy_attachment" "lambda_network_policy_attachment" {
role = aws_iam_role.lambda_exec.name
policy_arn = aws_iam_policy.lambda_network_policy.arn
}
resource "aws_iam_policy" "lambda_network_policy" {
name = "${local.name}_network_policy"
policy = <<EOF
{
"Version": "2012-10-17",
"Statement": [
{
"Effect": "Allow",
"Action": [
"ec2:DescribeNetworkInterfaces",
"ec2:CreateNetworkInterface",
"ec2:DeleteNetworkInterface",
"ec2:DescribeInstances",
"ec2:AttachNetworkInterface"
],
"Resource": "*"
}
]
}
EOF
}
resource "aws_apigatewayv2_api" "lambda" {
name = "${local.name}_lambda_gw"
protocol_type = "HTTP"
}
resource "aws_apigatewayv2_stage" "lambda" {
api_id = aws_apigatewayv2_api.lambda.id
name = local.environment
auto_deploy = true
access_log_settings {
destination_arn = aws_cloudwatch_log_group.api_gw.arn
format = jsonencode({
requestId = "$context.requestId"
sourceIp = "$context.identity.sourceIp"
requestTime = "$context.requestTime"
protocol = "$context.protocol"
httpMethod = "$context.httpMethod"
resourcePath = "$context.resourcePath"
routeKey = "$context.routeKey"
status = "$context.status"
responseLength = "$context.responseLength"
integrationErrorMessage = "$context.integrationErrorMessage"
}
)
}
}
resource "aws_apigatewayv2_integration" "hello_world" {
api_id = aws_apigatewayv2_api.lambda.id
integration_uri = aws_lambda_function.hello_world.invoke_arn
integration_type = "AWS_PROXY"
integration_method = "POST"
}
resource "aws_apigatewayv2_route" "hello_world" {
api_id = aws_apigatewayv2_api.lambda.id
route_key = "GET /hello"
target = "integrations/${aws_apigatewayv2_integration.hello_world.id}"
}
resource "aws_cloudwatch_log_group" "api_gw" {
name = "/aws/api_gw/${aws_apigatewayv2_api.lambda.name}"
retention_in_days = 30
}
resource "aws_lambda_permission" "api_gw" {
statement_id = "AllowExecutionFromAPIGateway"
action = "lambda:InvokeFunction"
function_name = aws_lambda_function.hello_world.function_name
principal = "apigateway.amazonaws.com"
source_arn = "${aws_apigatewayv2_api.lambda.execution_arn}/*/*"
}
resource "random_id" "server" {
byte_length = 8
}
resource "aws_s3_bucket" "lambda_bucket" {
bucket = "${local.name}-${random_id.server.hex}"
}
resource "aws_s3_bucket_acl" "bucket_acl" {
bucket = aws_s3_bucket.lambda_bucket.id
acl = "private"
}
data "archive_file" "lambda_hello_world" {
type = "zip"
source_dir = "${path.module}/src"
output_path = "${path.module}/src.zip"
}
resource "aws_s3_object" "lambda_hello_world" {
bucket = aws_s3_bucket.lambda_bucket.id
key = "src.zip"
source = data.archive_file.lambda_hello_world.output_path
etag = filemd5(data.archive_file.lambda_hello_world.output_path)
}
```
This file includes packaging the JavaScript source code, creating the [AWS S3](https://aws.amazon.com/s3/) bucket, uploading the package to S3, creating the Lambda functions, and the [AWS API Gateway](https://aws.amazon.com/api-gateway/) requirements to expose the functionality to the public using REST.
## Telemetry Side Cart Definitions
In this section, we’ll focus on creating the infrastructure to handle telemetry data on AWS. We’ll be following a serverless containerized approach using ECS Fargate to run tasks.
### The ECS Cluster
The first thing we need to do is create the cluster to include all the tasks and services we need for the side cart.
```terraform
# cluster.tf
// creating the ecs cluster
resource "aws_ecs_cluster" "tracetest-cluster" {
name = "tracetest"
tags = local.tags
}
// generic task execution role for both jaeger and tracetest
resource "aws_iam_role" "tracetest_task_execution_role" {
name = "tracetest_task_execution_role"
assume_role_policy = jsonencode({
Version = "2012-10-17"
Statement = [
{
Action = "sts:AssumeRole"
Effect = "Allow"
Sid = ""
Principal = {
Service = ["ecs-tasks.amazonaws.com", "ecs.amazonaws.com"]
}
},
]
})
managed_policy_arns = ["arn:aws:iam::aws:policy/service-role/AmazonEC2ContainerServiceRole"]
tags = local.tags
}
resource "aws_iam_role_policy" "tracetest_task_execution_role_policy" {
name = "tracetest_task_execution_role_policy"
role = aws_iam_role.tracetest_task_execution_role.id
policy = jsonencode({
Version = "2012-10-17"
Statement = [
{
Action = [
"logs:PutLogEvents",
"logs:CreateLogGroup",
"logs:CreateLogStream",
"logs:DescribeLogStreams",
"logs:DescribeLogGroups",
]
Effect = "Allow"
Resource = "*"
},
]
})
}
```
### Creating the Jaeger Service and Task
Once the cluster is defined, we can focus on adding all services and tasks we need for our telemetry data. In this case, we’ll use the `[jaeger-all-in-one` Docker image](https://www.jaegertracing.io/docs/1.43/getting-started/#all-in-one) as it provides everything we need for a basic demo.
```terraform
// jaeger.tf
// creating the task definition
resource "aws_ecs_task_definition" "jaeger" {
family = "${local.name}_jaeger"
requires_compatibilities = ["FARGATE"]
network_mode = "awsvpc"
cpu = 1024
memory = 2048
execution_role_arn = aws_iam_role.tracetest_task_execution_role.arn
container_definitions = jsonencode([
{
"name" : "jaeger",
# using the all in one docker image
"image" : "jaegertracing/all-in-one:1.42",
"cpu" : 1024,
"memory" : 2048,
"essential" : true,
// enabling the OTLP listeners
"environment" : [{
"name" : "COLLECTOR_OTLP_ENABLED",
"value" : "true"
}],
// exposing the required ports
"portMappings" : [
{
"hostPort" : 14269,
"protocol" : "tcp",
"containerPort" : 14269
},
{
"hostPort" : 14268,
"protocol" : "tcp",
"containerPort" : 14268
},
{
"hostPort" : 6832,
"protocol" : "udp",
"containerPort" : 6832
},
{
"hostPort" : 6831,
"protocol" : "udp",
"containerPort" : 6831
},
{
"hostPort" : 5775,
"protocol" : "udp",
"containerPort" : 5775
},
{
"hostPort" : 14250,
"protocol" : "tcp",
"containerPort" : 14250
},
{
"hostPort" : 16685,
"protocol" : "tcp",
"containerPort" : 16685
},
{
"hostPort" : 5778,
"protocol" : "tcp",
"containerPort" : 5778
},
{
"hostPort" : 16686,
"protocol" : "tcp",
"containerPort" : 16686
},
{
"hostPort" : 9411,
"protocol" : "tcp",
"containerPort" : 9411
},
{
"hostPort" : 4318,
"protocol" : "tcp",
"containerPort" : 4318
},
{
"hostPort" : 4317,
"protocol" : "tcp",
"containerPort" : 4317
}
],
"logConfiguration" : {
"logDriver" : "awslogs",
"options" : {
"awslogs-create-group" : "true",
"awslogs-group" : "/ecs/jaeger",
"awslogs-region" : "us-west-2",
"awslogs-stream-prefix" : "ecs"
}
},
}
])
}
// creating the jaeger service
resource "aws_ecs_service" "jaeger_service" {
name = "jaeger-service"
cluster = aws_ecs_cluster.tracetest-cluster.id
task_definition = aws_ecs_task_definition.jaeger.arn
desired_count = 1
launch_type = "FARGATE"
// defining three entry points to the Jaeger task using albs
load_balancer {
target_group_arn = aws_lb_target_group.tracetest-jaeger-tg.arn
container_name = "jaeger"
container_port = 16686
}
load_balancer {
target_group_arn = aws_lb_target_group.tracetest-jaeger-api-tg.arn
container_name = "jaeger"
container_port = 16685
}
load_balancer {
target_group_arn = aws_lb_target_group.tracetest-jaeger-collector-tg.arn
container_name = "jaeger"
container_port = 4318
}
network_configuration {
subnets = module.network.private_subnets_ids
security_groups = [module.tracetest_ecs_service_security_group.security_group_id]
assign_public_ip = false
}
}
resource "aws_lb_target_group" "tracetest-jaeger-api-tg" {
name = "tracetest-jaeger-api-tg"
port = 16685
protocol = "HTTP"
protocol_version = "GRPC"
vpc_id = module.network.vpc_id
target_type = "ip"
}
resource "aws_lb_target_group" "tracetest-jaeger-collector-tg" {
name = "tracetest-jaeger-collector-tg"
port = 4318
protocol = "HTTP"
vpc_id = module.network.vpc_id
target_type = "ip"
health_check {
path = "/"
port = "4318"
protocol = "HTTP"
healthy_threshold = 2
matcher = "200-499"
}
}
resource "aws_lb_target_group" "tracetest-jaeger-tg" {
name = "tracetest-jaeger-tg"
port = 16686
protocol = "HTTP"
vpc_id = module.network.vpc_id
target_type = "ip"
}
// alb listeners for the public and internal ALBS, depending on port
resource "aws_lb_listener" "tracetest-jaeger-alb-listener" {
load_balancer_arn = aws_lb.tracetest-alb.arn
port = "16686"
protocol = "HTTP"
default_action {
type = "forward"
target_group_arn = aws_lb_target_group.tracetest-jaeger-tg.arn
}
}
resource "aws_lb_listener" "tracetest-jaeger-collector-alb-listener" {
load_balancer_arn = aws_lb.internal_tracetest_alb.arn
port = "4318"
protocol = "HTTP"
default_action {
type = "forward"
target_group_arn = aws_lb_target_group.tracetest-jaeger-collector-tg.arn
}
}
resource "aws_lb_listener" "tracetest-jaeger-api-alb-listener" {
load_balancer_arn = aws_lb.internal_tracetest_alb.arn
port = "16685"
protocol = "HTTPS"
certificate_arn = aws_acm_certificate.cert.arn
default_action {
type = "forward"
target_group_arn = aws_lb_target_group.tracetest-jaeger-api-tg.arn
}
}
resource "tls_private_key" "tracetest_private_key" {
algorithm = "RSA"
}
resource "tls_self_signed_cert" "tracetest_self_signed_cert" {
private_key_pem = tls_private_key.tracetest_private_key.private_key_pem
subject {
common_name = "tracetest.com"
organization = "Tracetest"
}
validity_period_hours = 720
allowed_uses = [
"key_encipherment",
"digital_signature",
"server_auth",
]
}
resource "aws_acm_certificate" "cert" {
private_key = tls_private_key.tracetest_private_key.private_key_pem
certificate_body = tls_self_signed_cert.tracetest_self_signed_cert.cert_pem
}
```
> *To enable Jaeger’s gRPC OTLP endpoint and expose it through an Application Load Balancer (ALB), you have to provide a valid certificate, as ALBs require HTTPS as protocol and a valid cert to work with GRPC.*
### Deploying Tracetest to ECS Fargate
One of Tracetest’s biggest goals is to provide numerous easy ways to deploy a Tracetest instance anywhere. The goal is to fit into any user’s current setup with minimal edits, or none at all. The case of ECS Fargate is no different. It’s a user request that was turned into a use case!
When deploying Tracetest in a container-based infrastructure you can configure the Docker image using environment variables. This makes the process easier, because you do not need to provide any configuration files.
```terraform
// tracetest.tf
// creating the Tracetest task definition
resource "aws_ecs_task_definition" "tracetest" {
family = "tracetest"
requires_compatibilities = ["FARGATE"]
network_mode = "awsvpc"
cpu = 1024
memory = 2048
execution_role_arn = aws_iam_role.tracetest_task_execution_role.arn
container_definitions = jsonencode([
{
"name" : "${local.name}",
"image" : "${local.tracetest_image}",
"cpu" : 1024,
"memory" : 2048,
"essential" : true,
"portMappings" : [
{
"containerPort" : 11633,
"hostPort" : 11633,
"protocol" : "tcp"
}
],
// configuring and provisioning Tracetest using env variables
"environment" : [
{
"name" : "TRACETEST_POSTGRES_HOST",
"value" : "${module.db.db_instance_address}"
},
{
"name" : "TRACETEST_POSTGRES_PORT",
"value" : "${tostring(module.db.db_instance_port)}"
},
{
"name" : "TRACETEST_POSTGRES_DBNAME",
"value" : "${module.db.db_instance_name}"
},
{
"name" : "TRACETEST_POSTGRES_USER",
"value" : "${module.db.db_instance_username}"
},
{
"name" : "TRACETEST_POSTGRES_PASSWORD",
"value" : "${module.db.db_instance_password}"
},
{
"name" : "TRACETEST_PROVISIONING",
"value" : base64encode(local.provisioning),
}
],
"logConfiguration" : {
"logDriver" : "awslogs",
"options" : {
"awslogs-create-group" : "true",
"awslogs-group" : "/ecs/tracetest",
"awslogs-region" : "us-west-2",
"awslogs-stream-prefix" : "ecs"
}
},
}
])
}
// tracetest service
resource "aws_ecs_service" "tracetest-service" {
name = "${local.name}-service"
cluster = aws_ecs_cluster.tracetest-cluster.id
task_definition = aws_ecs_task_definition.tracetest.arn
desired_count = 1
launch_type = "FARGATE"
// exposing the UI and API listeners using ALB
load_balancer {
target_group_arn = aws_lb_target_group.tracetest-tg.arn
container_name = "tracetest"
container_port = 11633
}
network_configuration {
subnets = module.network.private_subnets_ids
security_groups = [module.tracetest_ecs_service_security_group.security_group_id]
assign_public_ip = false
}
}
// Postgres RDS instance used as main store
module "db" {
source = "terraform-aws-modules/rds/aws"
identifier = local.name
engine = "postgres"
engine_version = "14"
family = "postgres14"
major_engine_version = "14"
instance_class = "db.t4g.micro"
allocated_storage = 20
max_allocated_storage = 100
db_name = local.db_name
username = local.db_username
port = 5432
create_db_subnet_group = true
subnet_ids = module.network.private_subnets_ids
vpc_security_group_ids = [module.db_security_group.security_group_id]
deletion_protection = false
tags = local.tags
}
module "db_security_group" {
source = "terraform-aws-modules/security-group/aws"
version = "~> 4.0"
name = local.name
description = "PostgreSQL security group"
vpc_id = module.network.vpc_id
ingress_with_cidr_blocks = [
{
from_port = 5432
to_port = 5432
protocol = "tcp"
description = "PostgreSQL access from within VPC"
cidr_blocks = local.vpc_cidr
},
]
tags = local.tags
}
resource "aws_lb_target_group" "tracetest-tg" {
name = "tracetest-tg"
port = 11633
protocol = "HTTP"
vpc_id = module.network.vpc_id
target_type = "ip"
}
// allowing public access to Tracetest
resource "aws_lb_listener" "tracetest-alb-listener" {
load_balancer_arn = aws_lb.tracetest-alb.arn
port = "11633"
protocol = "HTTP"
default_action {
type = "forward"
target_group_arn = aws_lb_target_group.tracetest-tg.arn
}
}
```
Take a moment to look at this part of the file:
```terraform
{
"name" : "TRACETEST_PROVISIONING",
"value" : base64encode(local.provisioning),
}
```
The provisioning configuration for Tracetest can be found in [the `variables.tf` file](https://github.com/kubeshop/tracetest/blob/main/examples/tracetest-aws-terraform-serverless/variables.tf) under the `locals` configuration which uses the internal load balancer DNS endpoint to build the data store entry.
```terraform
provisioning = <<EOF
---
type: PollingProfile
spec:
name: default
strategy: periodic
default: true
periodic:
retryDelay: 5s
timeout: 10m
---
type: DataStore
spec:
name: jaeger
type: jaeger
jaeger:
endpoint: ${aws_lb.internal_tracetest_alb.dns_name}:16685
tls:
insecure_skip_verify: true
EOF
tags = {
Name = local.name
Example = local.name
}
}
EOF
```
This file is base64 encoded and passed into the `TRACETEST_PROVISIONING` environment variable. To learn more about provisioning a Tracetest service, [check out the official docs](https://docs.tracetest.io/configuration/provisioning/).
### Defining Terraform Outputs
The final setup step is to generate outputs to provide links that we can use to reach the generated services.
```terraform
// outputs.tf
output "api_endpoint" {
value = "${aws_apigatewayv2_stage.lambda.invoke_url}/hello"
description = "The API endpoint"
}
output "tracetest_url" {
value = "http://${aws_lb.tracetest-alb.dns_name}:11633"
description = "Tracetest public URL"
}
output "jaeger_ui_url" {
value = "http://${aws_lb.tracetest-alb.dns_name}:16686"
description = "Jaeger public URL"
}
output "internal_jaeger_api_url" {
value = "${aws_lb.internal_tracetest_alb.dns_name}:16685"
description = "Jaeger internal API URL"
}
```
## Provisioning the AWS Infra
Finally! We have written down every required definition piece we need to generate the AWS resources, now it's time to take it to the next level by actually creating them using the Terraform CLI.
The first step is to initialize the Terraform project and install dependencies.
```bash
terraform init
[Output]
Initializing modules...
Initializing the backend...
Initializing provider plugins...
- Reusing previous version of hashicorp/tls from the dependency lock file
- Reusing previous version of hashicorp/random from the dependency lock file
- Reusing previous version of hashicorp/archive from the dependency lock file
- Reusing previous version of hashicorp/aws from the dependency lock file
- Using previously-installed hashicorp/aws v4.55.0
- Using previously-installed hashicorp/tls v4.0.4
- Using previously-installed hashicorp/random v3.4.3
- Using previously-installed hashicorp/archive v2.3.0
Terraform has been successfully initialized!
You may now begin working with Terraform. Try running "terraform plan" to see
any changes that are required for your infrastructure. All Terraform commands
should now work.
If you ever set or change modules or backend configuration for Terraform,
rerun this command to reinitialize your working directory. If you forget, other
commands will detect it and remind you to do so if necessary.
```
The second step is to run the `apply` command.
```bash
terraform apply
```
This is going to prompt you with the question to continue or not, as well as show a list of changes it will execute.
```bash
Plan: 100 to add, 0 to change, 0 to destroy.
Changes to Outputs:
+ tracetest_url = (known after apply)
+ jaeger_ui_url = (known after apply)
+ internal_jaeger_api_url = (known after apply)
+ api_endpoint = (known after apply)
Do you want to perform these actions?
Terraform will perform the actions described above.
Only 'yes' will be accepted to approve.
Enter a value:
```
By explicitly typing `yes` and hitting `enter`, the provisioning process will start.
This is where you can go grab lunch, walk your dog or do any pending chores… or just stare at the Terminal until it’s done 😅.
You will see something similar to this when the provisioning is done.
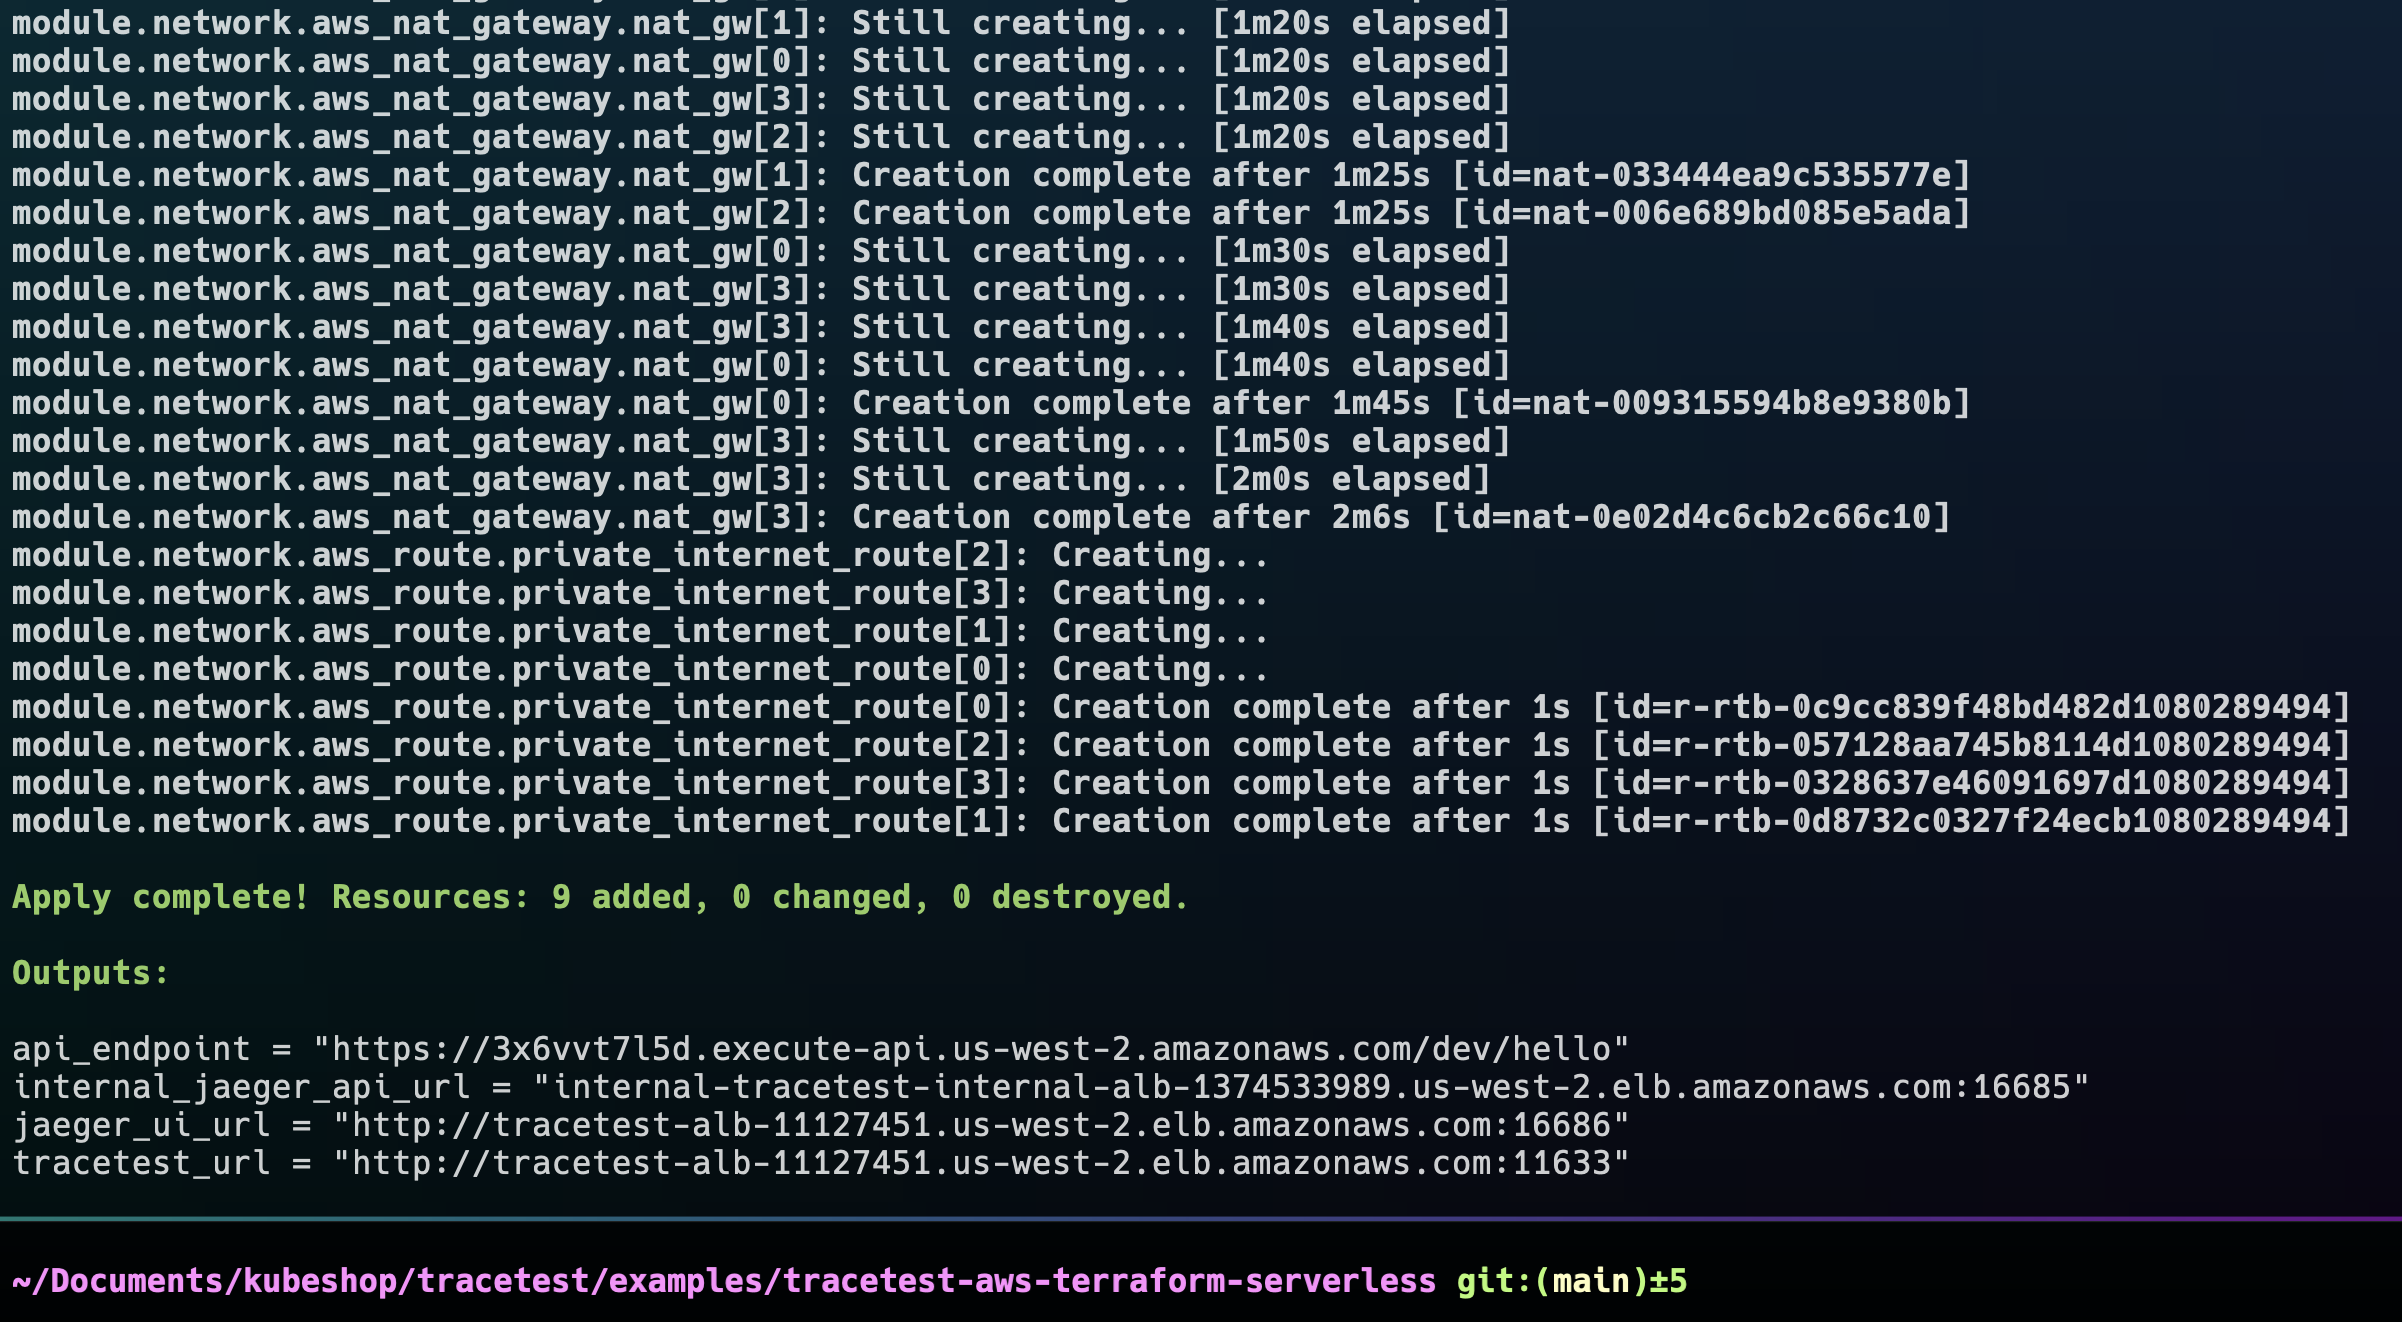
You’ll see four URLs as outputs, the same ones we defined in the Terraform files.
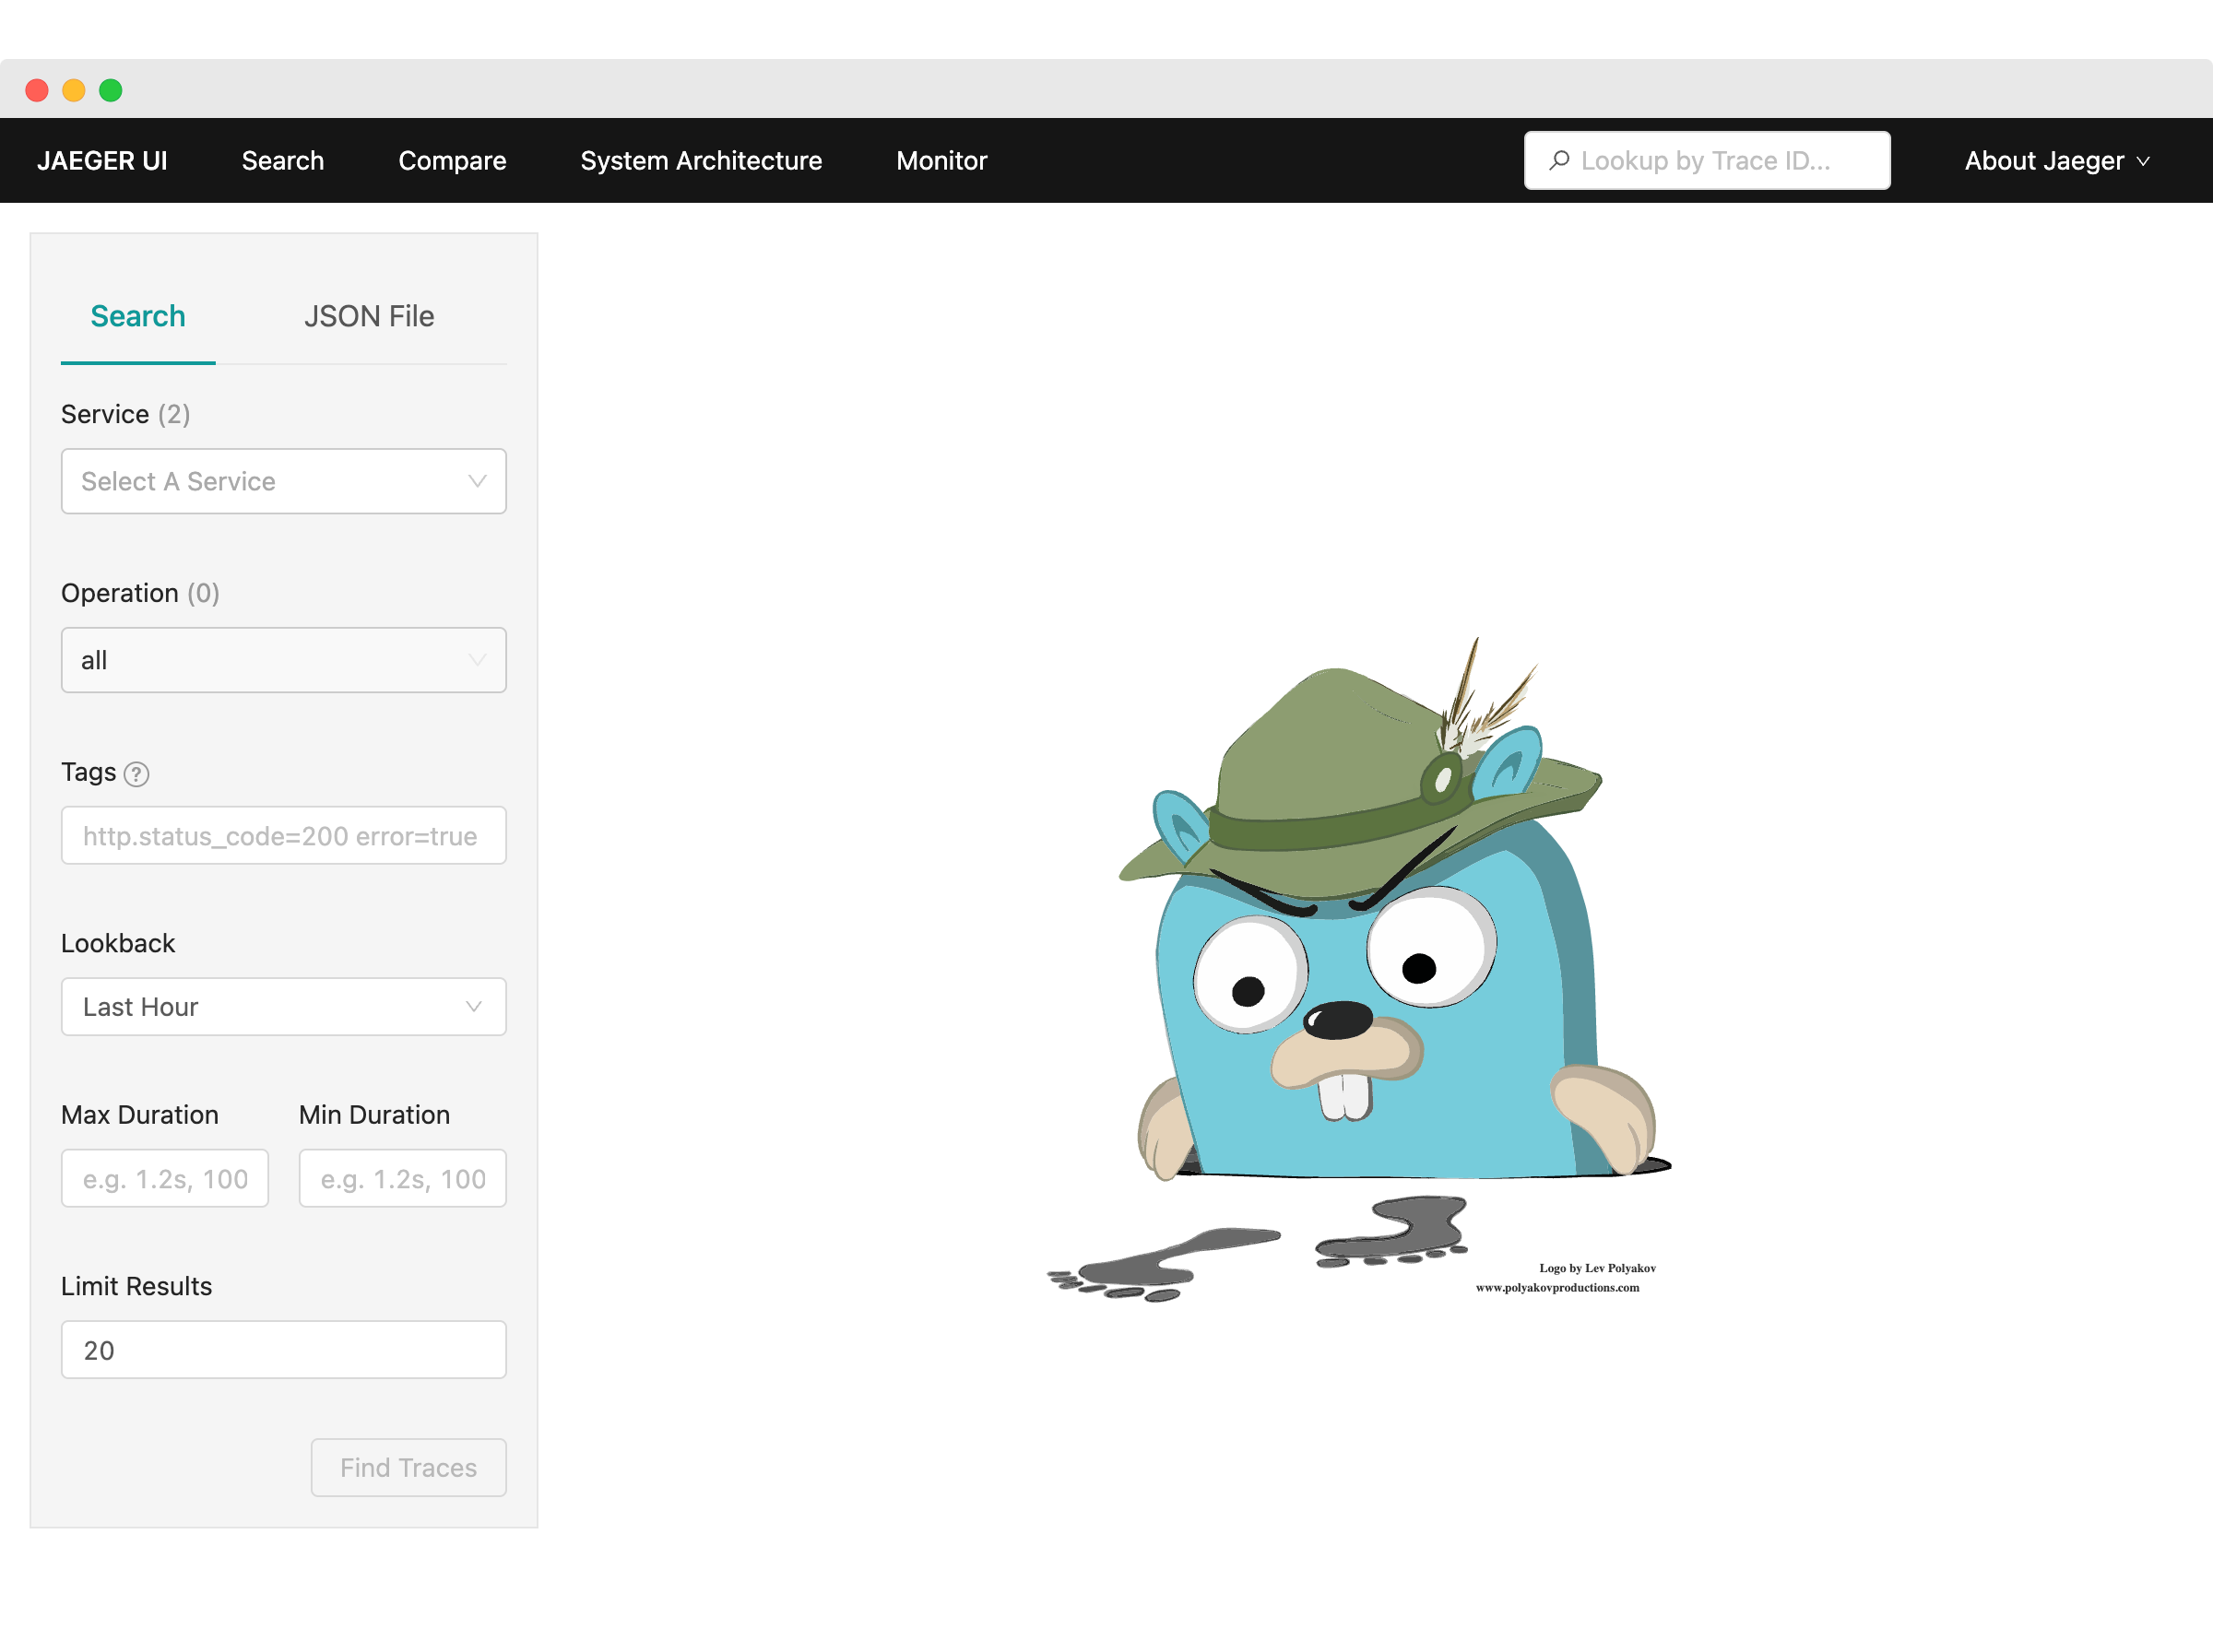
We can go one by one to validate that everything is working as expected. First, let’s try following the `jaeger_ui_url`. You should be able to see the angry Gopher and the Jaeger search page.
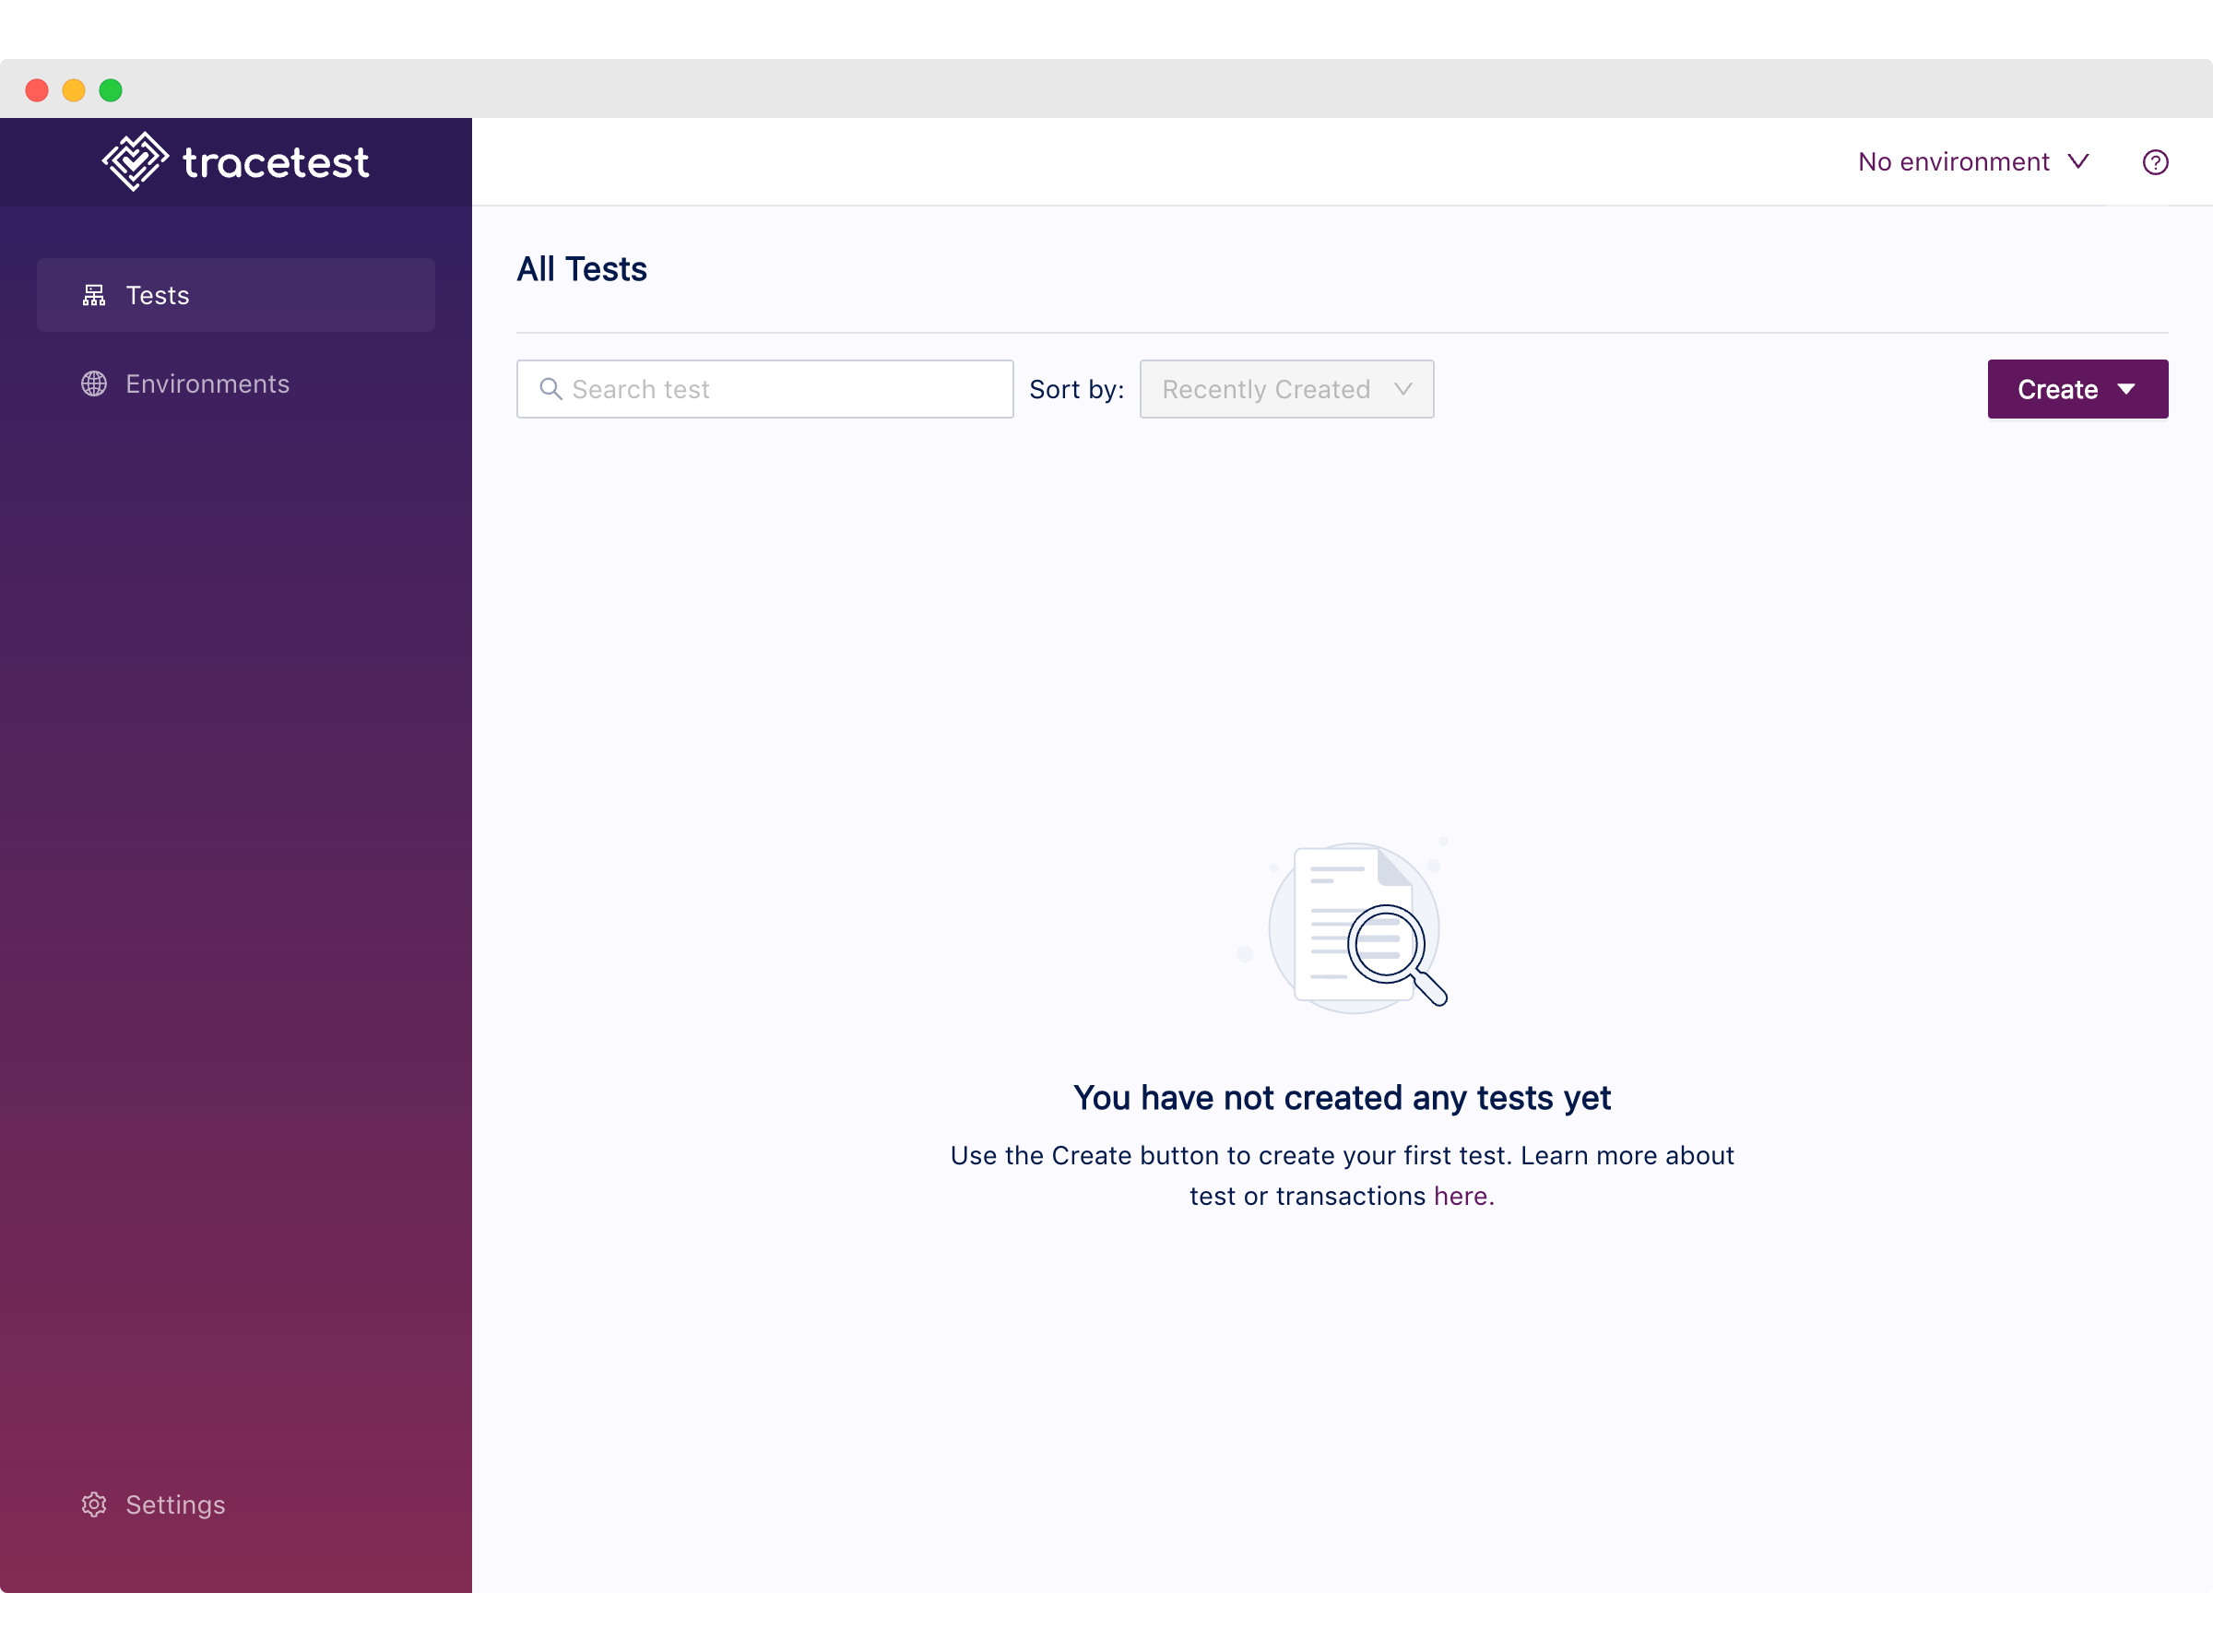
After that, we can continue with the `tracetest_url`, where you should see the Tracetest dashboard page with an empty test list.
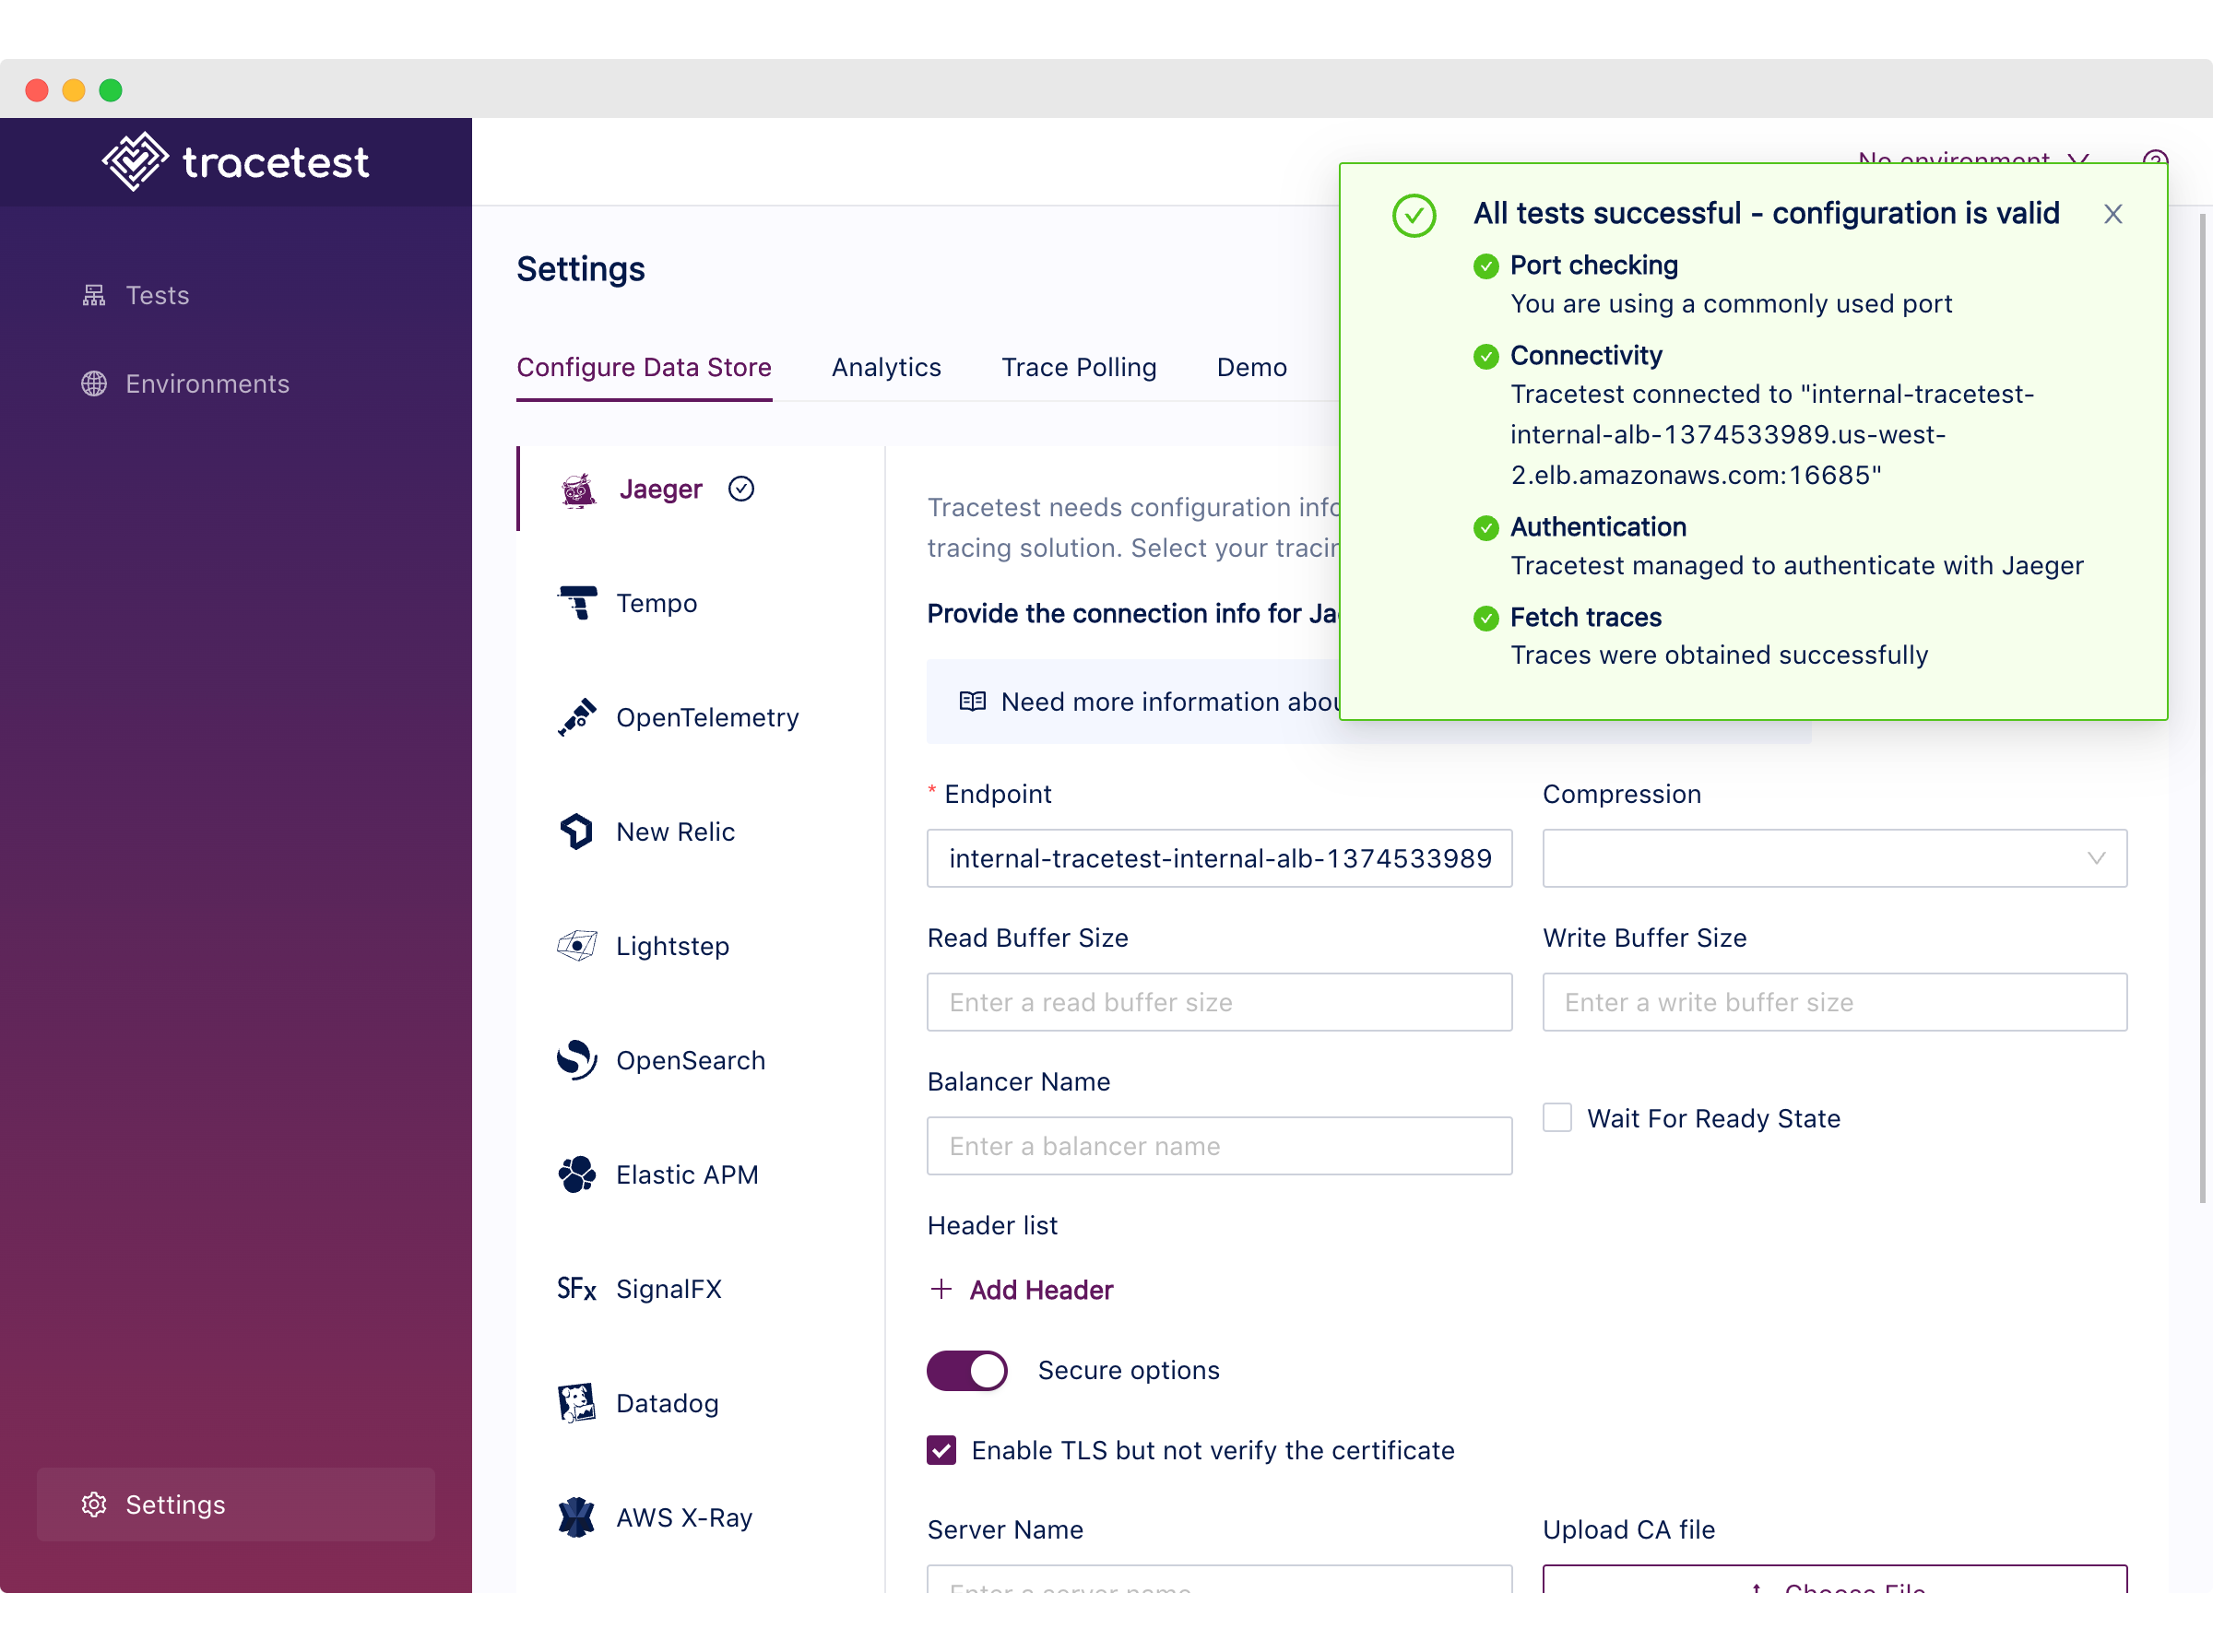
From the `/settings` page we can validate that Tracetest has access to the Jaeger GRPC endpoint by clicking the `Test Connection` button.
Lastly, we can use the following CURL command to validate the `api_endpoint`.
```bash
curl <api_endpoint>
[Output]
{"message": "Hello, World!"}
```
Good job 🎉! With this set of steps, we have validated that the AWS Infrastructure is ready. In the following section, we’ll move on to validating the tracing data.
## Trace-based Testing with Tracetest
You made it! You’ve crossed the desert of creating the Terraform definitions and conquered the fires of waiting an eternity to provision AWS services. Now it’s time to have some fun!
Let’s add some validations based on the Node.js Lambda telemetry. To do so, we’ll create a test based on the following checks:
1. There should be one span of type FaaS (Function as a Service) called `HelloWorld`.
2. The `HelloWorld` span should take less than 1 second.
```bash
# tests/test.yaml
type: Test
spec:
id: 4iiL0j1Vg
name: Hello World
trigger:
type: http
httpRequest:
url: <your_api_endpoint>
method: GET
headers:
- key: Content-Type
value: application/json
specs:
- selector: span[tracetest.span.type="faas" name="HelloWorld"]
assertions:
- attr:tracetest.selected_spans.count = 1
- attr:tracetest.span.duration < 1s
```
Save this file in your `tests` folder as `test.yaml`.
> Remember to update the `<your_api_endpoint` section of the test with the `api_endpoint` Terraform output.
>
### Running the Trace-based Test
First, [configure the Tracetest CLI](https://docs.tracetest.io/cli/configuring-your-cli) to point to the proper public ALB and Tracetest port, using the following:
```bash
# Replace the <tracetest_url> placeholder for the Terraform output
tracetest configure --endpoint <tracetest_url> --analytics
```
Then, create and run the test with this command:
```bash
tracetest test run -d tests/test.yaml
[Output]
✔ Hello World (<tracetest_url>/test/4iiL0j1Vg/run/1/test)
```
Finally, follow the output response URL from the run command to find the test run alongside the test specs we just created.
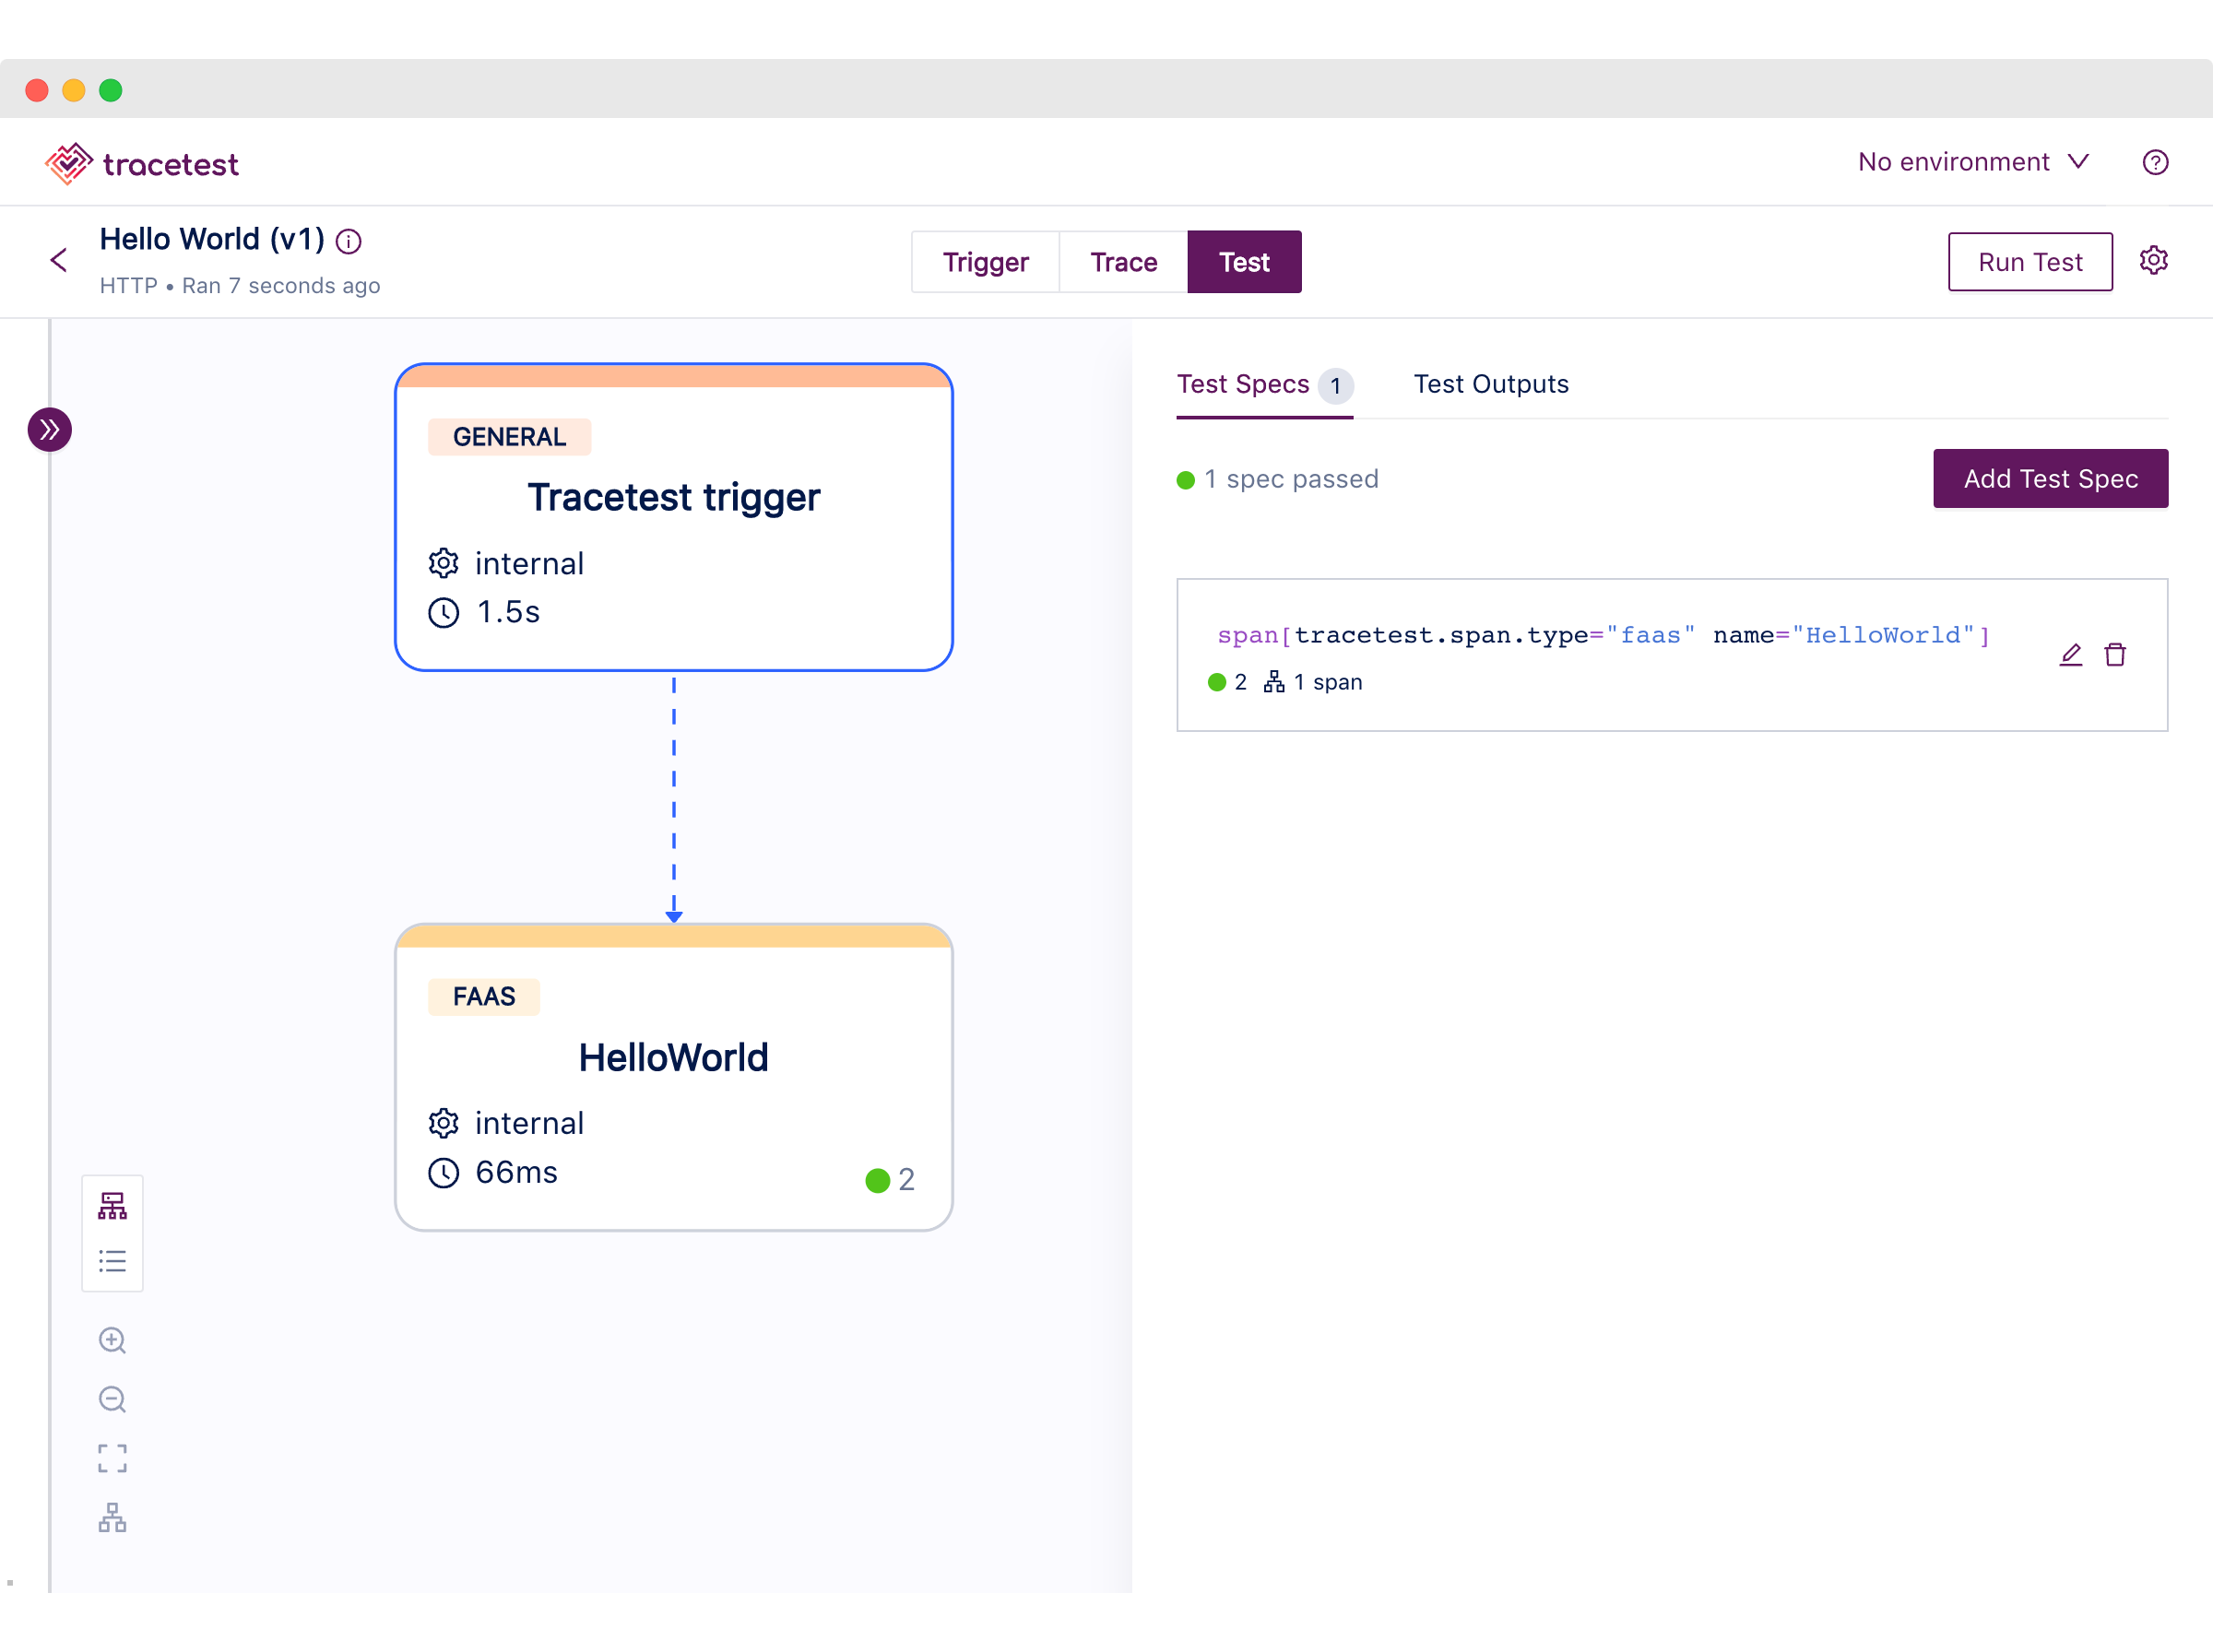
Tracetest allows you to create assertions against any span from the trace, using the [selector query language](https://docs.tracetest.io/concepts/selectors) to pick exactly the spans you want to validate to then add checks based on attributes from the matched spans.
Not only that, but you can create, [run and validate your trace-based tests entirely from the CLI](https://docs.tracetest.io/cli/running-tests), enabling your team to have them be part of your CI/CD pipelines.
## Conclusion
At Tracetest we share a mix of different technical backgrounds, we have team members like the awesome [Matheus](https://www.linkedin.com/in/matheusnogueira/) with distributed Mobile Game services experience, or [Jorge](https://www.linkedin.com/in/jorgeepc/) with experience in huge enterprise front-end applications.
Every single one of us has been in a position where we are moments away from throwing our computer in the air to test if airplane mode actually transforms it into an actual plane! It always boils down to wishing we could have better ways of understanding what’s happening in the code.
With that in mind, I wanted to display the power of trace-based testing and how it can help teams deliver quality software and alleviate those nightmare scenarios we have all been through.
In summary, you’ve learned how to:
1. Provision an Observability side cart with Tracetest and Jaeger on AWS Fargate using Terraform.
2. Write, provision and instrument an AWS Lambda function with Node.js using OpenTelemetry and Terraform.
3. Use trace-based testing with Tracetest to validate the generated telemetry data.
Last, but not least - if would you like to learn more about Tracetest and what it brings to the table? Check the [docs](https://docs.tracetest.io/examples-tutorials/recipes/running-tracetest-with-lightstep/) and try it out by [downloading](https://tracetest.io/download) it today!
Also, please feel free to join our [Slack community](https://dub.sh/tracetest-community), give [Tracetest a star on GitHub](https://github.com/kubeshop/tracetest), or schedule a [time to chat 1:1](http://calendly.com/ken-kubeshop/otel-user-interview-w-tracetest).
.jpg)
.avif)
.avif)