Top 9 Commercial Distributed Tracing Tools


Read about the top 9 commercial distributed tracing solutions from both Observability & APM vendors as well as Cloud providers, and hear what sets them apart.
Table of Contents
As a back-end developer who’s responsible for instrumenting your applications with observability platforms and creating end-to-end tests, you’re under pressure to build systems for ensuring the quality of every deployment, from code commit to the end of the full CI/CD pipeline.
In response to these demands, you’re probably researching which testing features you could add to your toolkit, or maybe even scoping the landscape of commercial **distributed tracing** tools, trying to figure out which to invest in.
## What is Distributed Tracing?
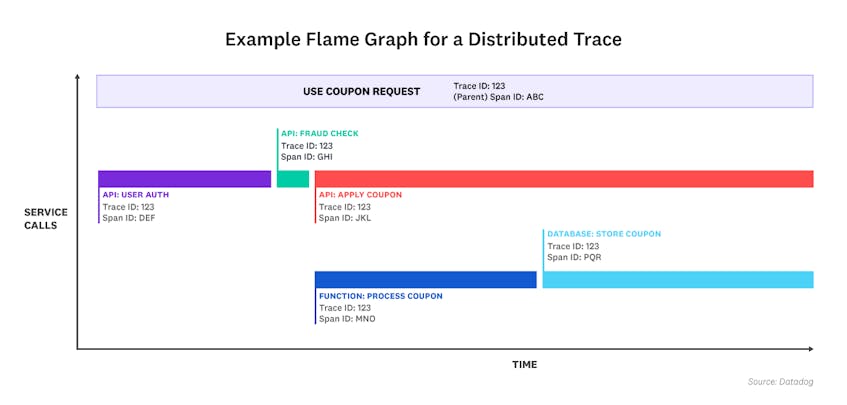
Distributed tracing is the practice of recording the paths and context around each request as it propagates through your application, APIs, databases, and more—all data you can store and use later to leverage diagnosing errors, slow response times, and more. This data is particularly useful when you’re building ephemeral back-end services in distributed environments, like Kubernetes, where a pod’s data and logs only exist until the cluster destroys it.
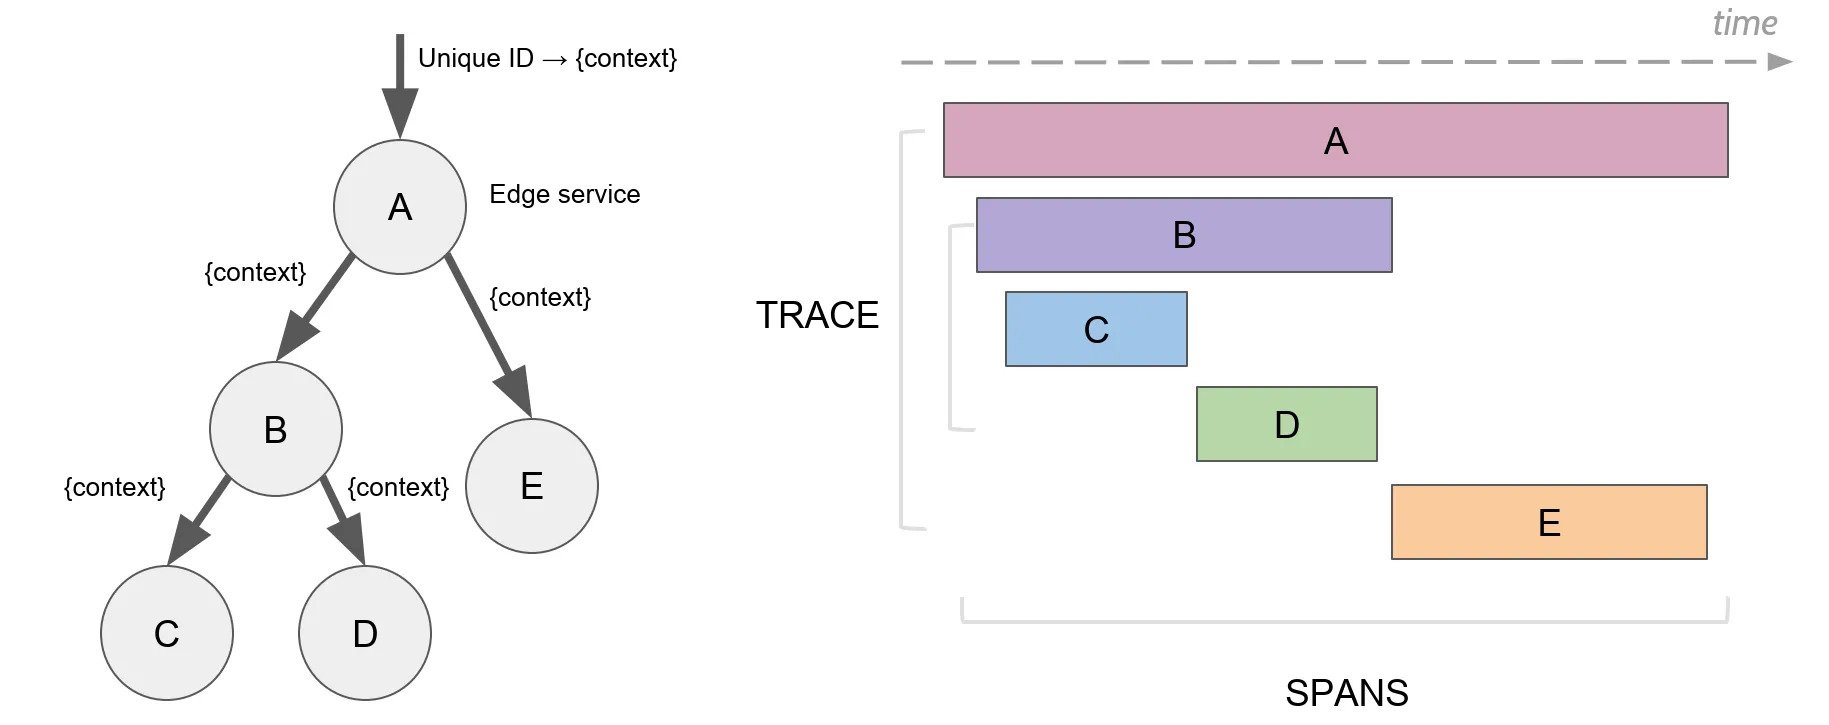
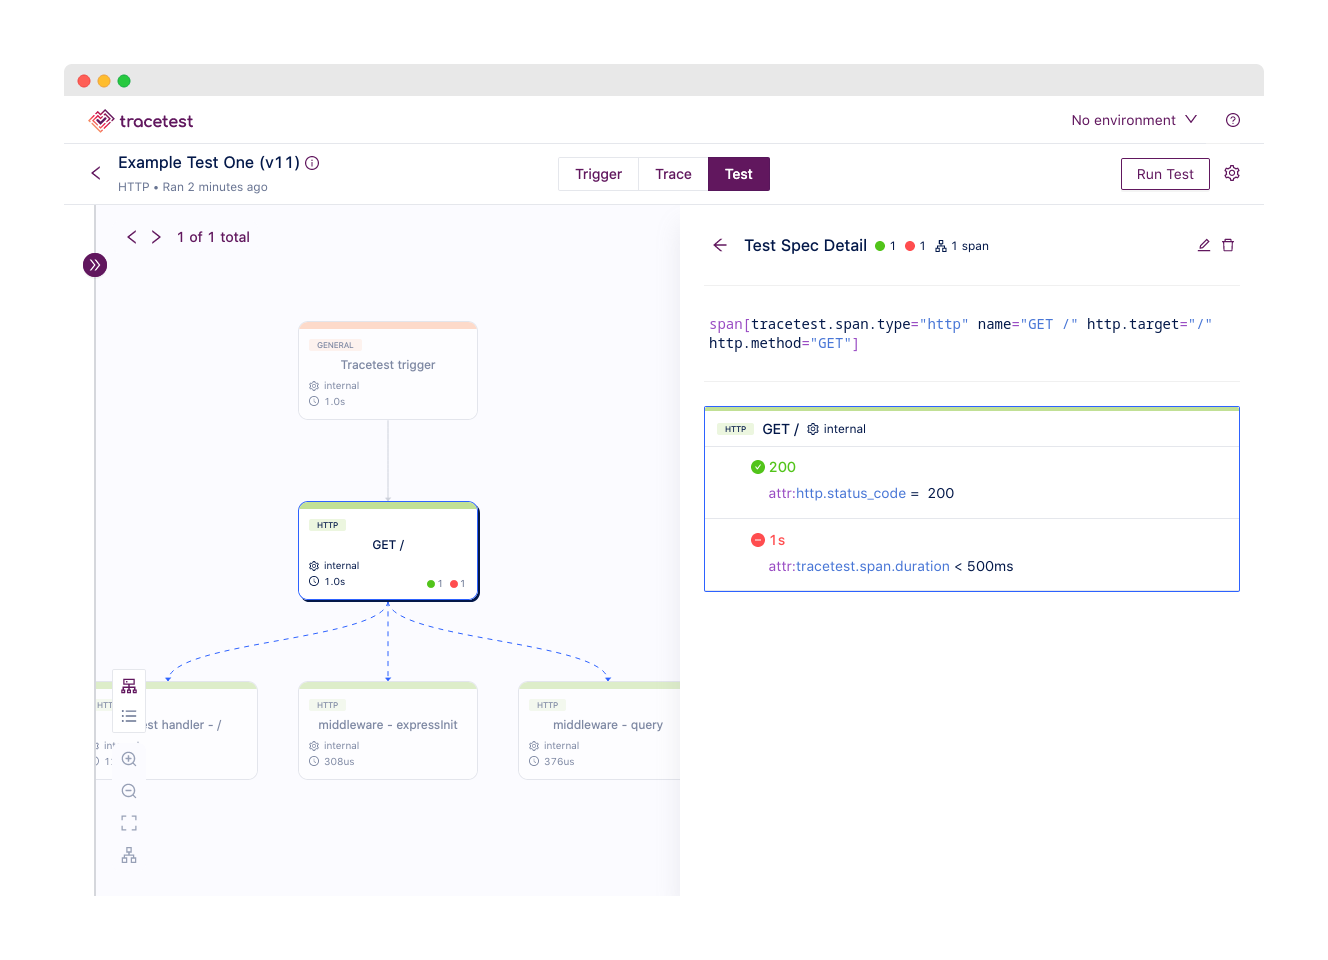
On its own, distributed tracing is a powerful tool for troubleshooting your back-end code, but [**trace-based testing**](https://docs.tracetest.io/concepts/what-is-trace-based-testing) goes an important step further by codifying your quality standards for back-end code and automating the process of ensuring each new code change meets those requirements.
But not every tracing tool offers the testing features you need for trace-based testing, which is where a platform like [Tracetest](https://tracetest.io/) comes into play. Tracetest integrates with all the tracing tools we’ll mention here, giving you a solid foundation to add trace-based tests to all your back-end code no matter how micro-sized or ephemeral they might be.
## AWS OpenSearch Service
AWS OpenSearch Service is a managed service for distributed search and analytics, based around the open-source [OpenSearch project](https://opensearch.org/), for real-time application monitoring, real-time visualizations, and more. AWS OpenSearch Service has an OpenSearch Observability plugin, which in turn has a feature called [Trace Analytics](https://opensearch.org/docs/latest/observing-your-data/trace/index/), which can analyze trace data from distributed applications.
You might have heard about OpenSearch generally when AWS responded to Elastic changing the licensing models for their popular Elasticsearch and Kibana projects by forking them into OpenSearch and OpenSearch Dashboards.
### What sets AWS OpenSearch Service apart?
Instantly access [APM (Application Performance Management/Monitoring)](https://en.wikipedia.org/wiki/Application_performance_management) data like average latency, error rate, and trends associated with a specific operation, such as a specific API call.
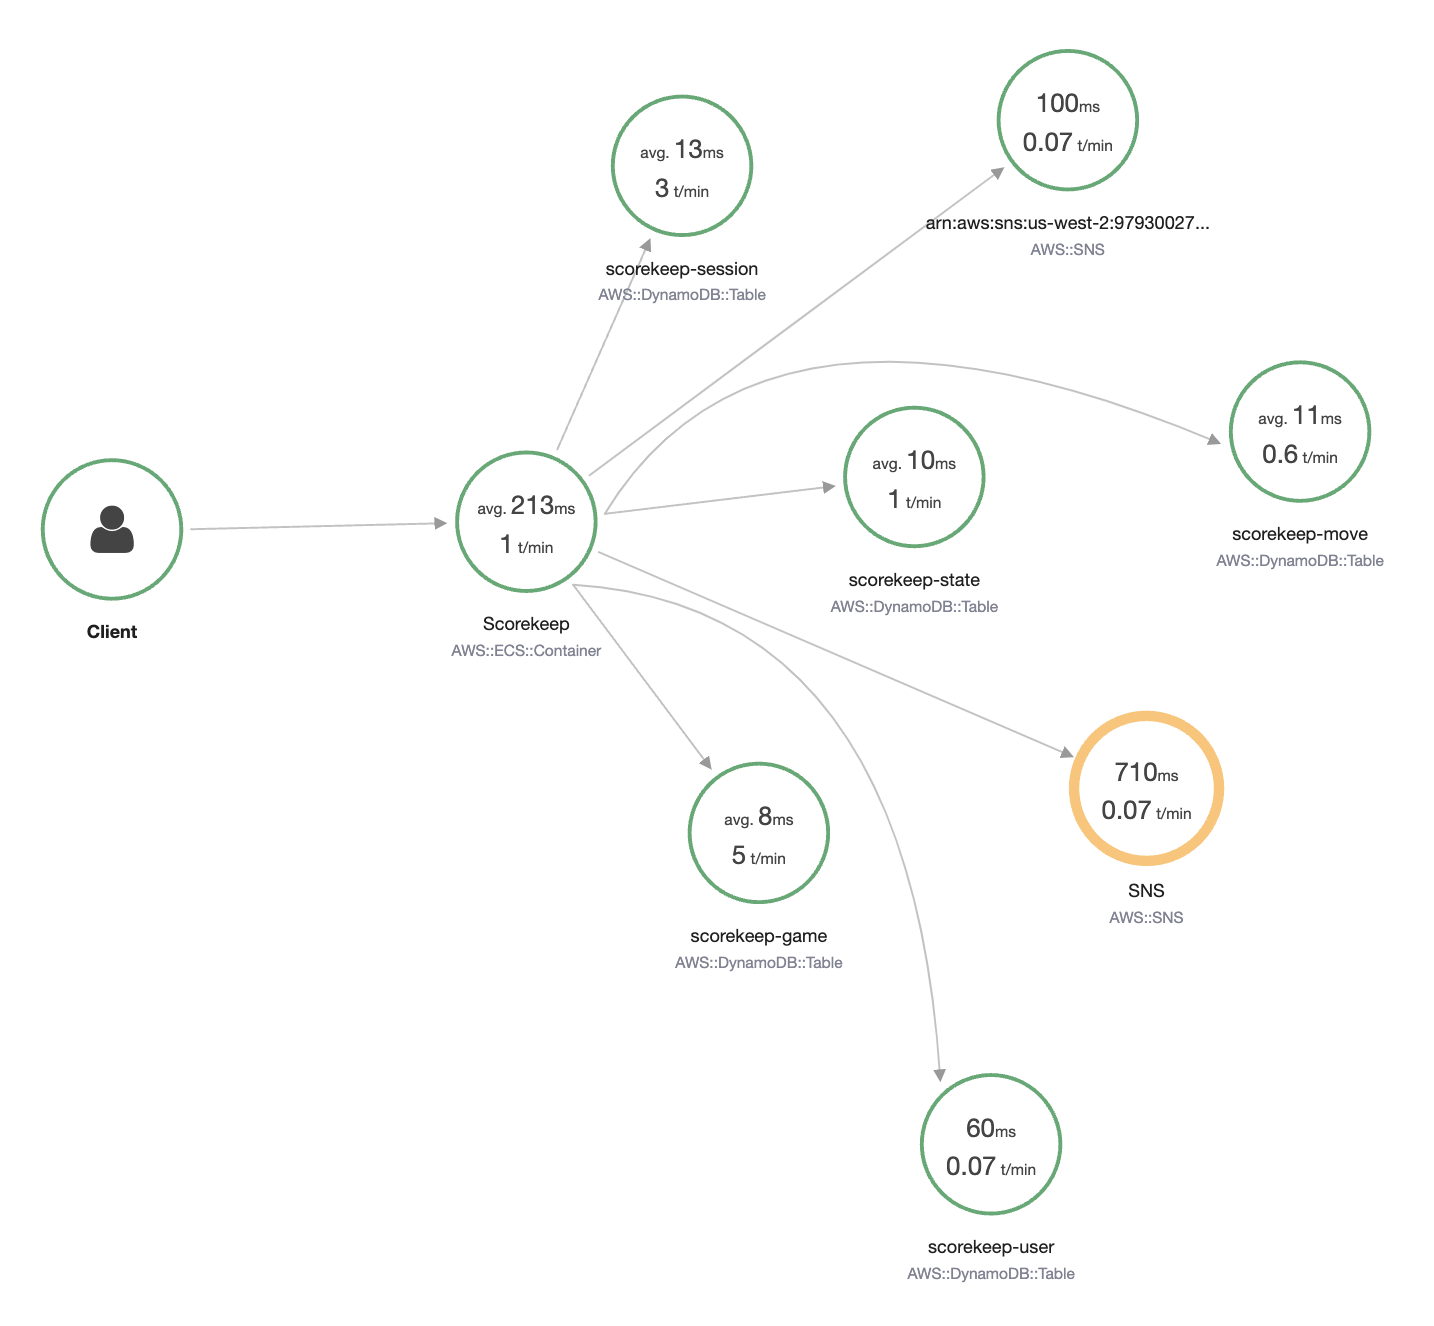
View an interactive service map that shows how your back-end services are connected to one another, helping you identify problems based on those relationships when you sort by error rate or latency.
## Elastic Cloud
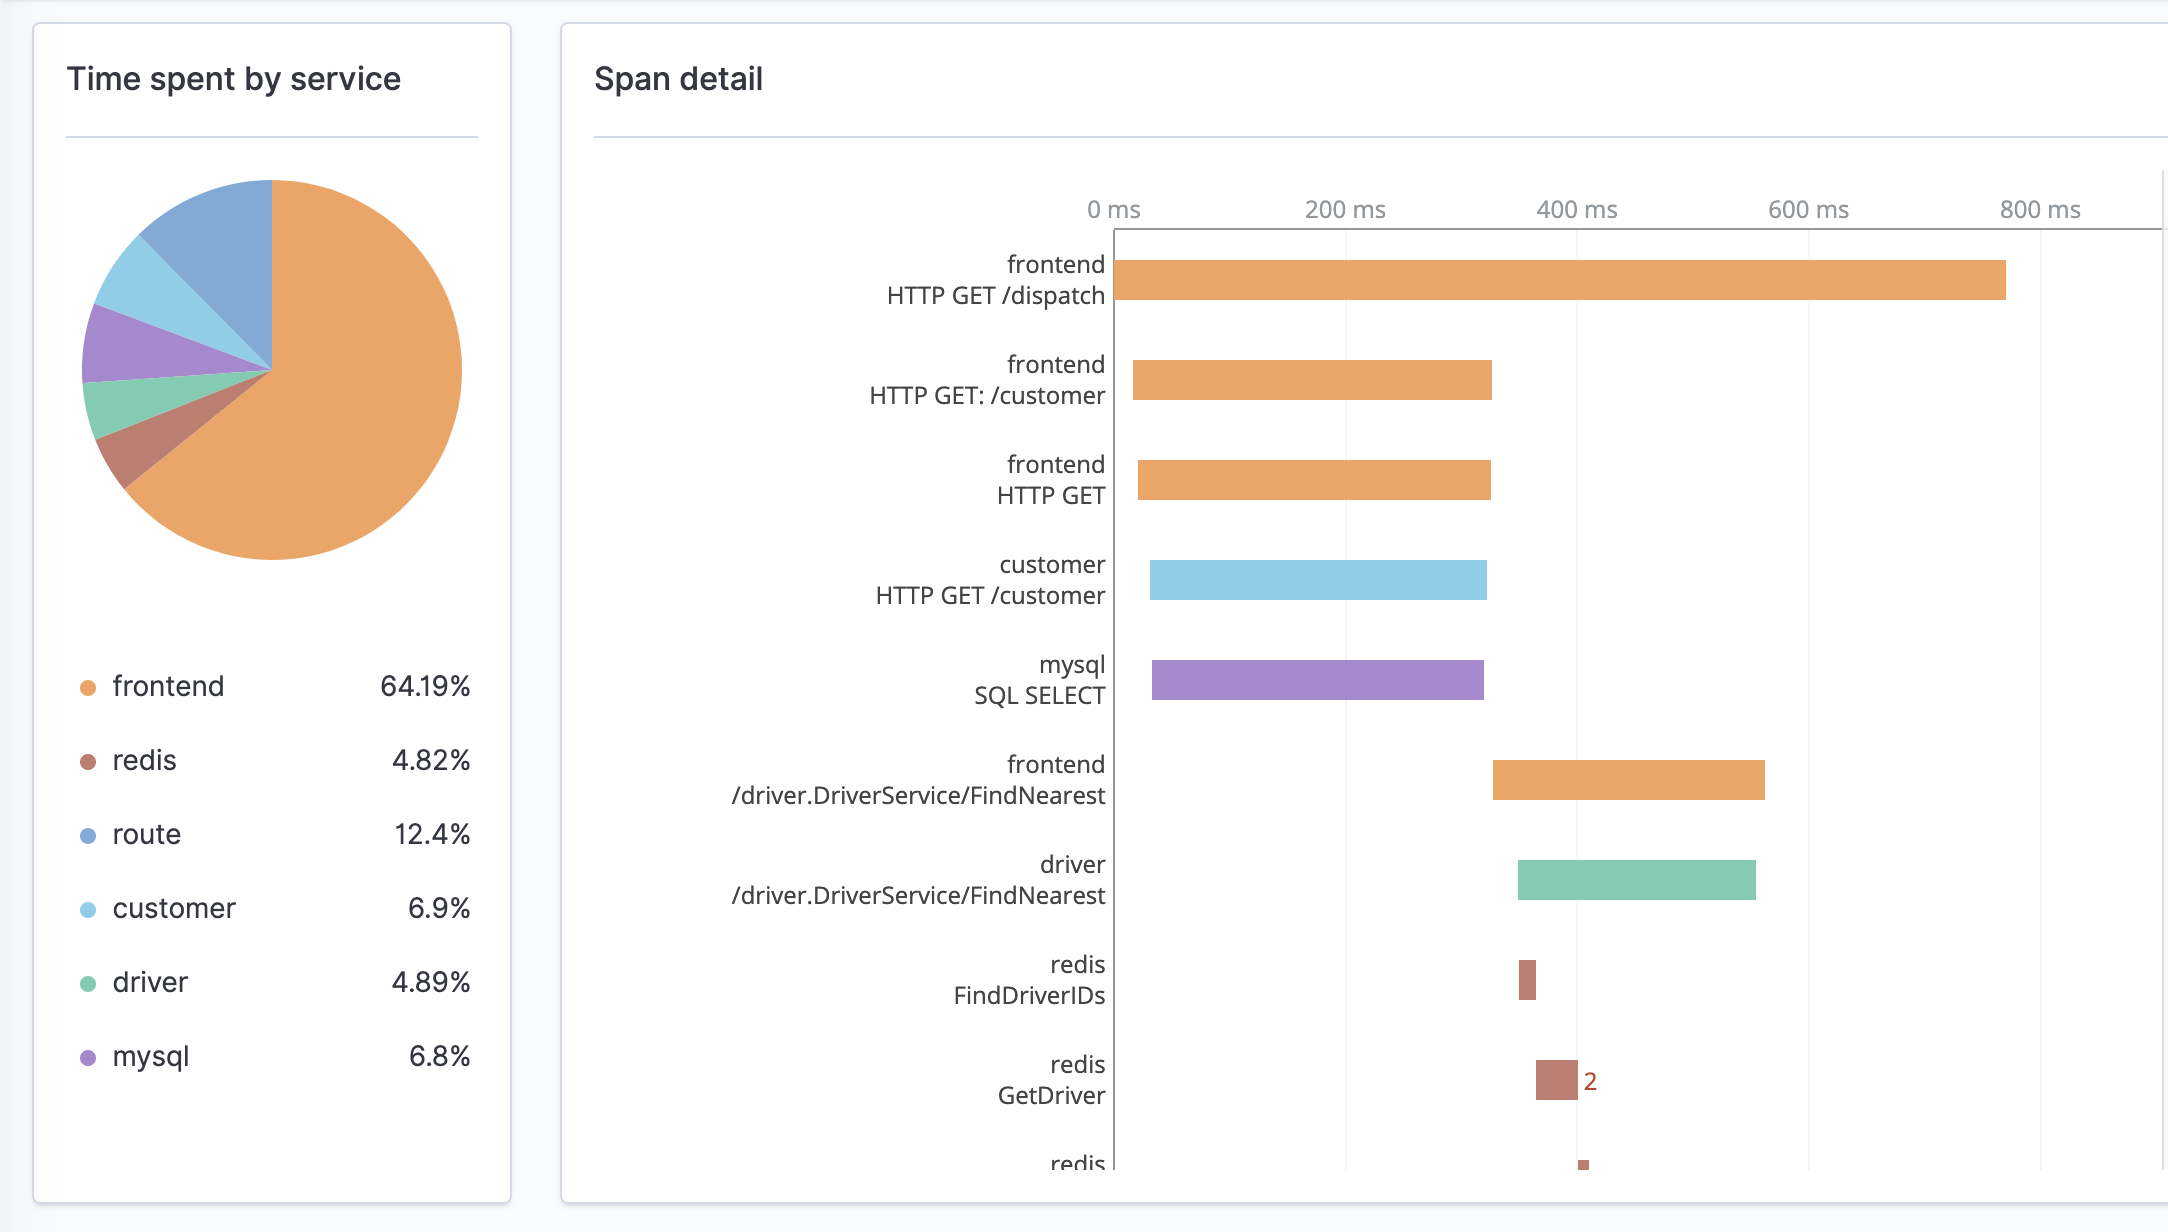
[Elastic Cloud](https://www.elastic.co/cloud/) is the cloud version of the Elasticsearch and Kibana projects we mentioned in the last section. When you use Elastic Cloud, you can quickly deploy a service called [Elastic APM](https://www.elastic.co/observability/application-performance-monitoring) (application performance monitoring), which supports distributed tracing and other observability features, like correlating metrics and logs with traces, if those are appealing to you.
### What sets Elastic Cloud tracing apart?
Automatically instrument distributed trace data, like timing database queries, to get started faster.
Re-use your existing OpenTelemetry instrumentation to create Elastic APM transactions and spans.
Use Elastic’s popular open-source Kibana tool to create valuable timeline visualizations or dashboards with business KPIs, like overall latency or error rates, to keep a focus on the end-user experience.

## AWS X-Ray
[AWS X-Ray](https://aws.amazon.com/xray/) is the first tracing-specific platform on this list. X-Ray focuses on troubleshooting and debugging use cases enabled by distributed tracing, such as identifying latency bottlenecks or diagnosing the root cause of unusual behavior, particularly in microservices/serverless architectures.
### What sets AWS X-Ray tracing apart?
Deploy the [AWS Distro for OpenTelemetry](https://docs.aws.amazon.com/xray/latest/devguide/xray-services-adot.html), an AWS distribution based around the open-source OpenTelemetry project, which helps you instrument your applications and send distributed traces and correlated metrics from AWS Lambda or Amazon Elastic Container Service (ECS) to multiple monitoring services.
Get 100,000 traces recorded free per month.
Leverage any data protection, security, or compliance rules you might have already established in AWS.
## Splunk
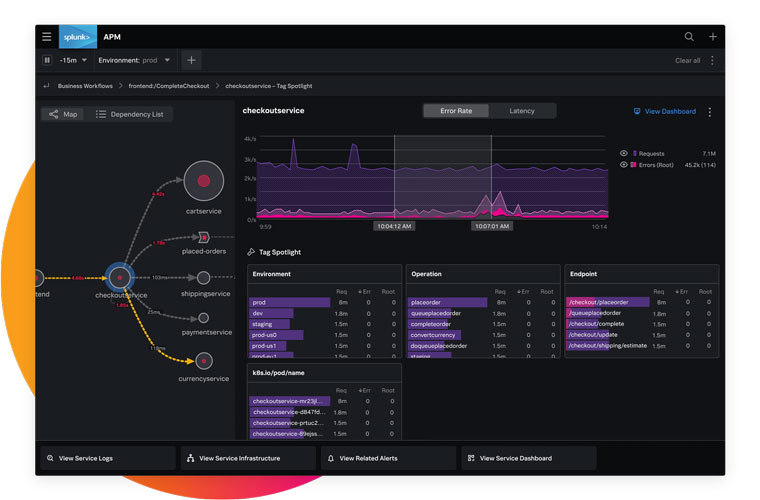
[Splunk](https://www.splunk.com/) is a cloud data platform for security and observability. When it comes to tracing, Splunk has an [APM solution](https://www.splunk.com/en_us/products/apm-application-performance-monitoring.html) that integrates distributed tracing. And also has logs and metrics, for diagnosing and fixing issues in distributed applications.
As with all the other platforms we’ve covered thus far, Splunk’s APM solution integrates with OpenTelemetry, including the APIs, exporters, SDKs, and collector, to streamline your observability work and allow you to switch between vendors without re-instrumenting your back-end services.
### What sets Splunk tracing apart?
Store all of your observability data, not just a downsampled subset of it, to ensure fast-running or ephemeral anomalies don’t fly under your radar.
Access continuous code profiling with the [AlwaysOn](https://www.splunk.com/en_us/blog/devops/announcing-the-ga-of-splunk-apm-s-alwayson-profiling.html) service, which analyzes code-level performance using trace data to help you fix service bottlenecks and identify where you could continuously optimize your code or environment.
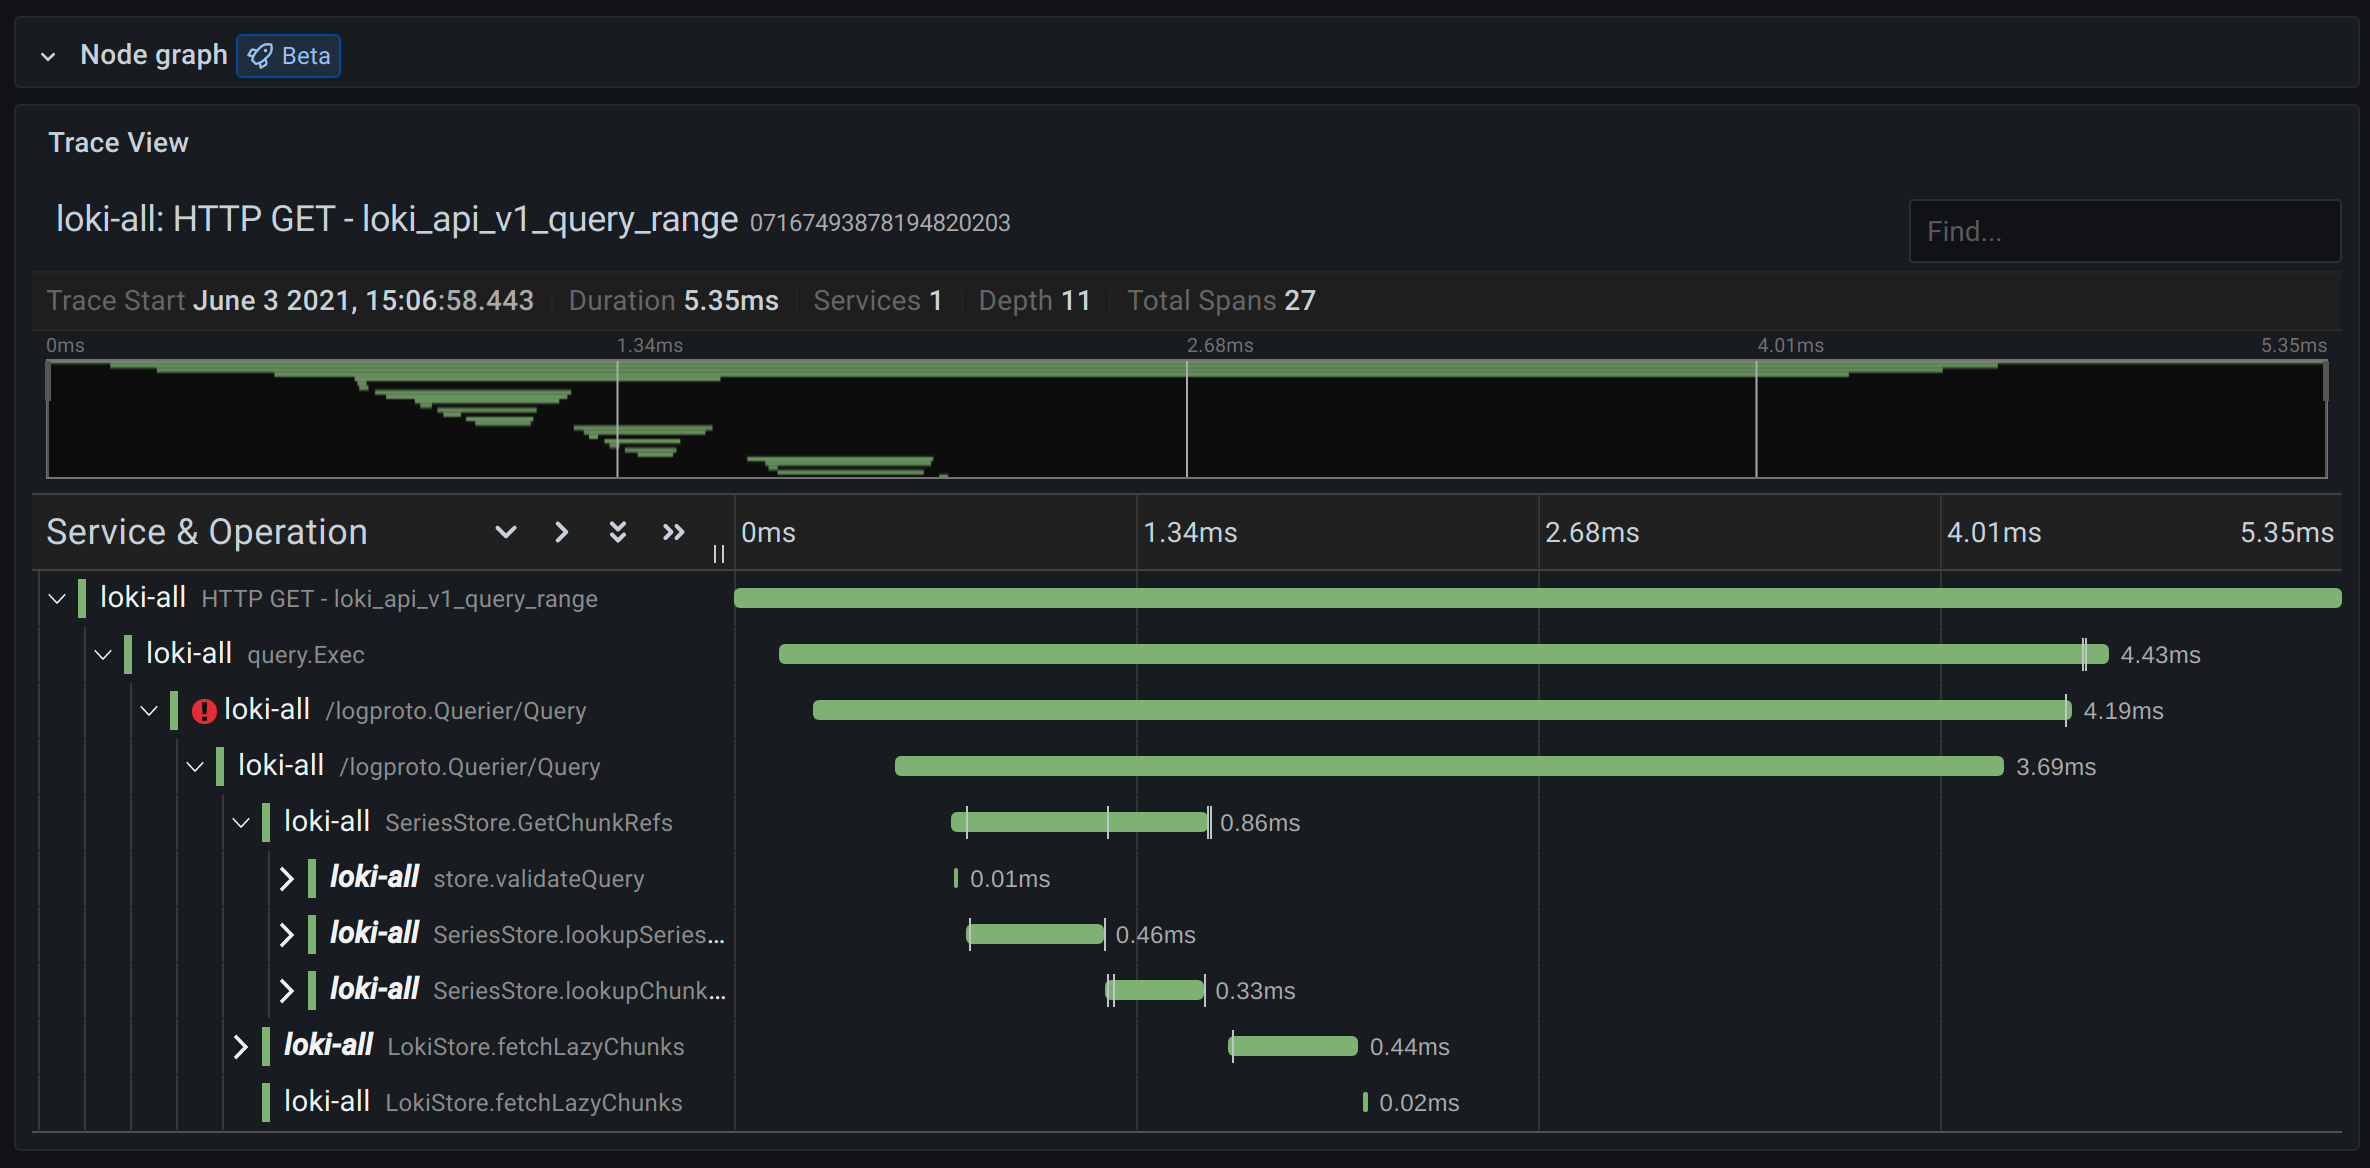
## Grafana Traces
[Grafana Traces](https://grafana.com/traces/) is a fully managed cloud service from Grafana and part of its “LGTM stack,” which also includes logs, visualizations, and metrics. Grafana is best known for the open-source [query/visualization/alerting project of the same name](https://github.com/grafana/grafana), which is often used as the visualization back end for both commercial and open-source observability stacks.
Unlike many of the other platforms and solutions on this list, Grafana Traces is based entirely on [Grafana Tempo](https://grafana.com/oss/tempo/), an open-source distributed tracing back end, which can ingest and store common tracing protocols like OpenTelemetry.
### What sets Grafana Traces tracing apart?
Store “orders of magnitude” more trace data for the cost of other observability platforms, according to Grafana, without the need for sampling.
Create powerful custom dashboards and pivot between metrics, logs, and traces during troubleshooting with the Grafana visualization tooling.
Dive deep into intermittent bugs or specific customer traces.
Integrate Grafana Traces with a different logging back end, like Elasticsearch (Elastic Cloud) or Splunk, and correlate your logging data with the traces you collect and store within Tempo.
## Datadog
[Datadog](https://www.datadoghq.com/) is a SaaS analytics platform for monitoring and security. Since its founding in 2010, it went through numerous funding rounds, raising hundreds of millions before going public in 2019.
Like Splunk, the company has a discrete [Datadog APM service](https://www.datadoghq.com/product/apm/#auto-instrumentation) responsible for APM and distributed tracing. By correlating distributed traces and front/back-end data, you can monitor latency, errors, and health metrics on databases all the way down to individual lines of code.
### What sets Datadog tracing apart?
Follow the entire lifecycle of a single user’s session as they interact with serverless functions, databases, and more.
Connect specific traces to infrastructure metrics for more seamless troubleshooting.
Automatically instrument your back-end services with frameworks and libraries for Java, PHP, Nodes.js, Python, Go, and more.
Support for data created by OpenTelemetry-based instrumentation.
## New Relic
[New Relic](https://newrelic.com/) is a developer-focused platform for observability, monitoring, and debugging across your full stack of distributed applications, services, and environments. The company has followed a similar path as Datadog, albeit more accelerated, with only six years between its founding and its initial public offering in 2014.
New Relic’s [APM platform](https://newrelic.com/platform/application-monitoring) puts your telemetry—distributed tracing and beyond—into a single context, helping you visualize the path of any service request and pivot to other telemetry data, like logs or errors tracking.
### What sets New Relic tracing apart?
Utilize scatter charts and waterfall visualizations, plus filtering to find traces by a combination of attributes, to debug errors faster.
Pay for actual usage, instead of peak usage, for more predictable costs month-to-month.
Instantly instrument your back-end services with automatic New Relic agents, which support popular languages and frameworks like Go, Node.js, PHP, Python, and more, or choose the vendor-agnostic route with full support for OpenTelemetry.

## Lightstep
[Lightstep](https://lightstep.com/) bills itself as a platform for the reliability of cloud-native applications. The people behind Lightstep co-founded OpenTelemetry and OpenTracing, which gives them a unique perspective on the use cases of distributed tracing and the value of having a vendor-neutral tracing data format.
In May 2021, ServiceNow announced its [acquisition of Lightstep](https://techcrunch.com/2021/05/10/servicenow-leaps-into-applications-performance-monitoring-with-lightstep-acquisition/) for an undisclosed amount, folding the platform into its existing suite of enterprise software products. For now, Lightstep operates as a discrete entity, allowing you to sign up for just their service.
### What sets Lightstep tracing apart?
Find root causes of anomalies or errors faster with the exact logs, metrics, and distributed traces you need.
Connect your tracing data to troubleshooting notebooks to reduce your mean time to resolution (MTTR) or just get more proactive with application performance improvements.
Start collecting trace data faster with automatic instrumentation for popular programming languages using OpenTelemetry, with no code changes required and no vendor lock-in.

## Honeycomb
Last but not least, [Honeycomb](https://www.honeycomb.io/) is one of the newer players in the SaaS observability platform space, founded in 2016. Unlike many of the other platforms on this list, Honeycomb puts distributed tracing at the heart of their solution, leveraging that data for their alerting, anomaly detection and service map features.
### What sets Honeycomb tracing apart?
Combine traces with Honeycomb’s [BubbleUp](https://www.honeycomb.io/bubbleup) anomaly detection tool to identify exactly which traces, and their all-important attributes, are tied to bad end-user experiences.
Get automatic alerts from [Service Level Objectives (SLOs)](https://www.honeycomb.io/slos) when Honeycomb detects a quickly-debuggable performance issue, then tracks the effects of your changes using tracing data to verify your fix works.
Leverage Honeycomb’s language-specific distributions, receivers, and templates to quickly instrument your back-end services, or integrate instantly with anything you’ve already instrumented with OpenTelemetry.

## Learn more about trace-based testing
We’ve covered a ton of information in these last nine sections. While they all offer some degree of distributed tracing, their platforms operate under dramatically different philosophies on how you should utilize tracing data in your day-to-day life as a back-end engineer.
If you’re still feeling overwhelmed by the tracing choices ahead of you, it’s important to remember two common threads all these solutions share:
First, they support instrumenting, generating, ingesting, and storing trace data created by the open-source, community-driven OpenTelemetry project. You only need to instrument your back-end services once to send data to one or more of these commercial tracing tools, which lets you focus on the visualizations and features that work best for you.
Second, none of them support connecting distributed tracing data with testing. If you’re at all interested in automating how you can enforce the quality of your back-end services by leveraging trace data, you’ll need to look elsewhere.
That’s exactly where [Tracetest](https://tracetest.io/) comes in. Tracetest works alongside OpenTelemetry and any of these commercial tracing tools to enable integration, system, and end-to-end testing across your distributed system.
You get the best of both worlds—you can use trace-based testing at any point in your software development lifecycle, even in your CI/CD pipeline, to catch errors and enforce quality before deployment. And, for those pesky bugs that do reach production, you have one of these commercial tracing/observability platforms for full and real-time visibility.
We’ve even published guides on our integrations with a few of the commercial tracing tools above:
- [AWS OpenSearch Service](https://tracetest.io/blog/observability-trace-based-testing-aws-serverless-opensearch-tracetest)
- [Elastic Cloud + APM](https://tracetest.io/blog/tracetest-integration-elastic-trace-based-testing-application-performance-monitoring)
- [Lightstep](https://tracetest.io/blog/tracetest-integration-with-lightstep)
These tutorials also start you down the road of practicing [observability-driven development](https://tracetest.io/blog/the-difference-between-tdd-and-odd) (ODD), which is a development practice of building applications and instrumenting them with tracing at the same time. When you practice ODD, you can understand the entire lifecycle of an HTTP request, even in production, to uncover and fix the “unknown unknowns” of deploying distributed systems. If you need a refresher, check out [this guide](https://tracetest.io/blog/the-difference-between-tdd-and-odd) to learn more about the differences between test-driven development (TDD) and ODD.
As soon as you start instrumenting your applications with OpenTelemetry, be sure to give [Tracetest](https://tracetest.io/) a try to immediately maximize the value you get from collecting and storing tracing data. And if you like the concepts of trace-based testing or observability-driven development, be sure to trace us down on [Slack](https://dub.sh/tracetest-community) or [GitHub](https://github.com/kubeshop/tracetest) to see what we’re working on next. You might as well give us a star too. ;-)


.jpg)
.avif)
.avif)