
The Power of Traces: Learn by Contributing to OpenTelemetry
.avif)

Today you’ll learn how to contribute to the OpenTelemetry Demo repo safely, by learning to write OpenTelemetry code instrumentation and testing your contributions by writing trace-based tests.
Table of Contents
I want to provide a comprehensive understanding of OpenTelemetry, and demystify using it to help the community make meaningful contributions to the OpenTelemetry project.
These are the four questions you’ll know how to answer by the end of this tutorial.
1. What is Observability?
2. What is OpenTelemetry?
3. What is the OpenTelemetry Demo repo?
4. How to contribute to the OpenTelemetry Demo repo?
5. What is trace-based testing and how do you run trace-based tests?
I’ll provide explanations for each of these questions and explain the challenges faced by maintainers when merging pull requests, often leading to broken features and telemetry.
Let’s jump in!
You can also watch this live stream on this topic below.
## What is Observability?
Observability refers to the ability to gain insights into the internal state and behavior of a system through its outputs. In the context of OpenTelemetry, observability focuses on distributed tracing, which allows you to trace requests as they flow through a system and understand the interactions between various components.
To learn more about observability and distributed tracing, refer to the [OpenTelemetry observability primer](https://opentelemetry.io/docs/concepts/observability-primer/#what-is-observability).
### Understanding Distributed Tracing
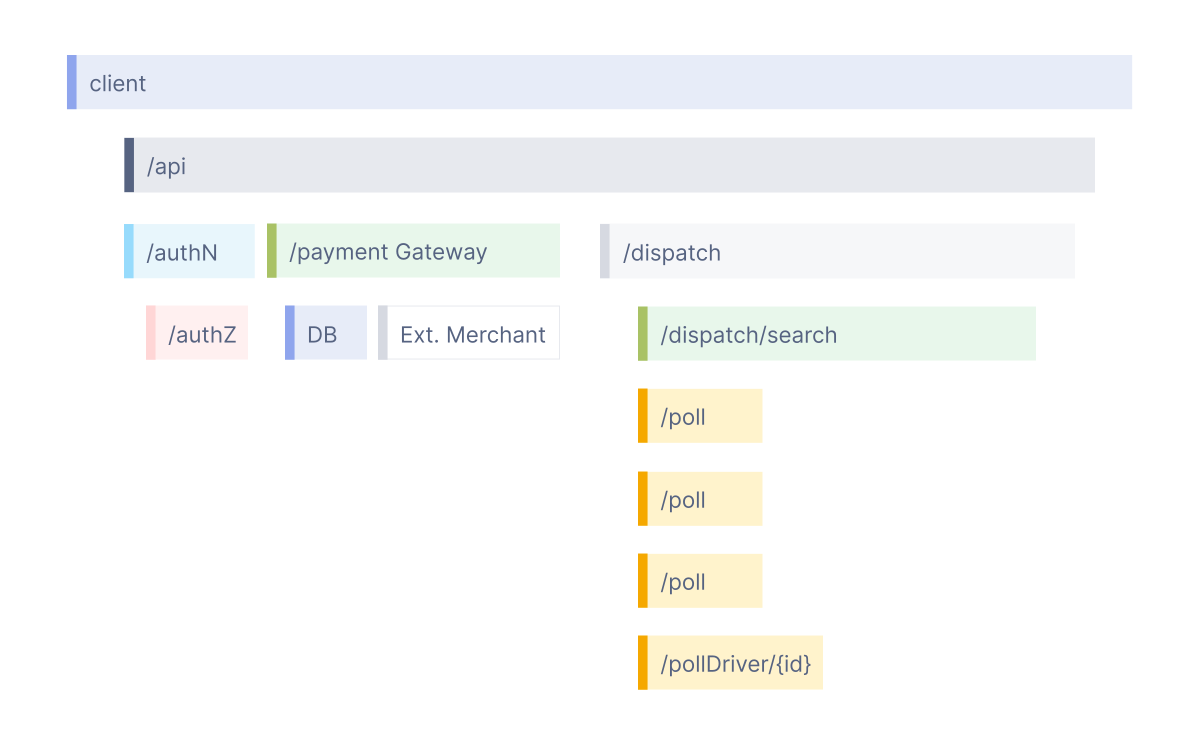
A distributed trace has four components:
1. The trace
2. Spans representing each step
3. Attributes associated to each span
4. Events associated to each span
A trace consists of one or more spans, with the initial span as the root, representing the entire request journey. Subsequent spans provide a detailed context of the steps in a request.
A distributed trace, or simply a trace, traces the path of a request in multi-service architectures like microservices and serverless apps.
Without tracing, pinpointing performance issues in a distributed system is challenging. Tracing enhances visibility in applications, making debugging elusive issues easy.
It simplifies the daunting task of debugging and understanding complex distributed systems by breaking down the sequence of events within a request.
## What is OpenTelemetry?
[OpenTelemetry](https://opentelemetry.io/) is a powerful observability framework that enables the collection, analysis, and export of telemetry data from applications. It provides a standardized approach for instrumenting code, allowing developers to gain valuable insights into application performance and behavior. With OpenTelemetry, monitoring and troubleshooting systems, identifying bottlenecks, and optimizing application performance becomes easier.
### Demystifying OpenTelemetry
Let's demystify OpenTelemetry together and embark on a journey of active contribution to the OpenTelemetry Demo. By doing so, we can collectively advance the state of observability and empower developers worldwide to build more reliable and performant applications.
### Understanding Code Instrumentation
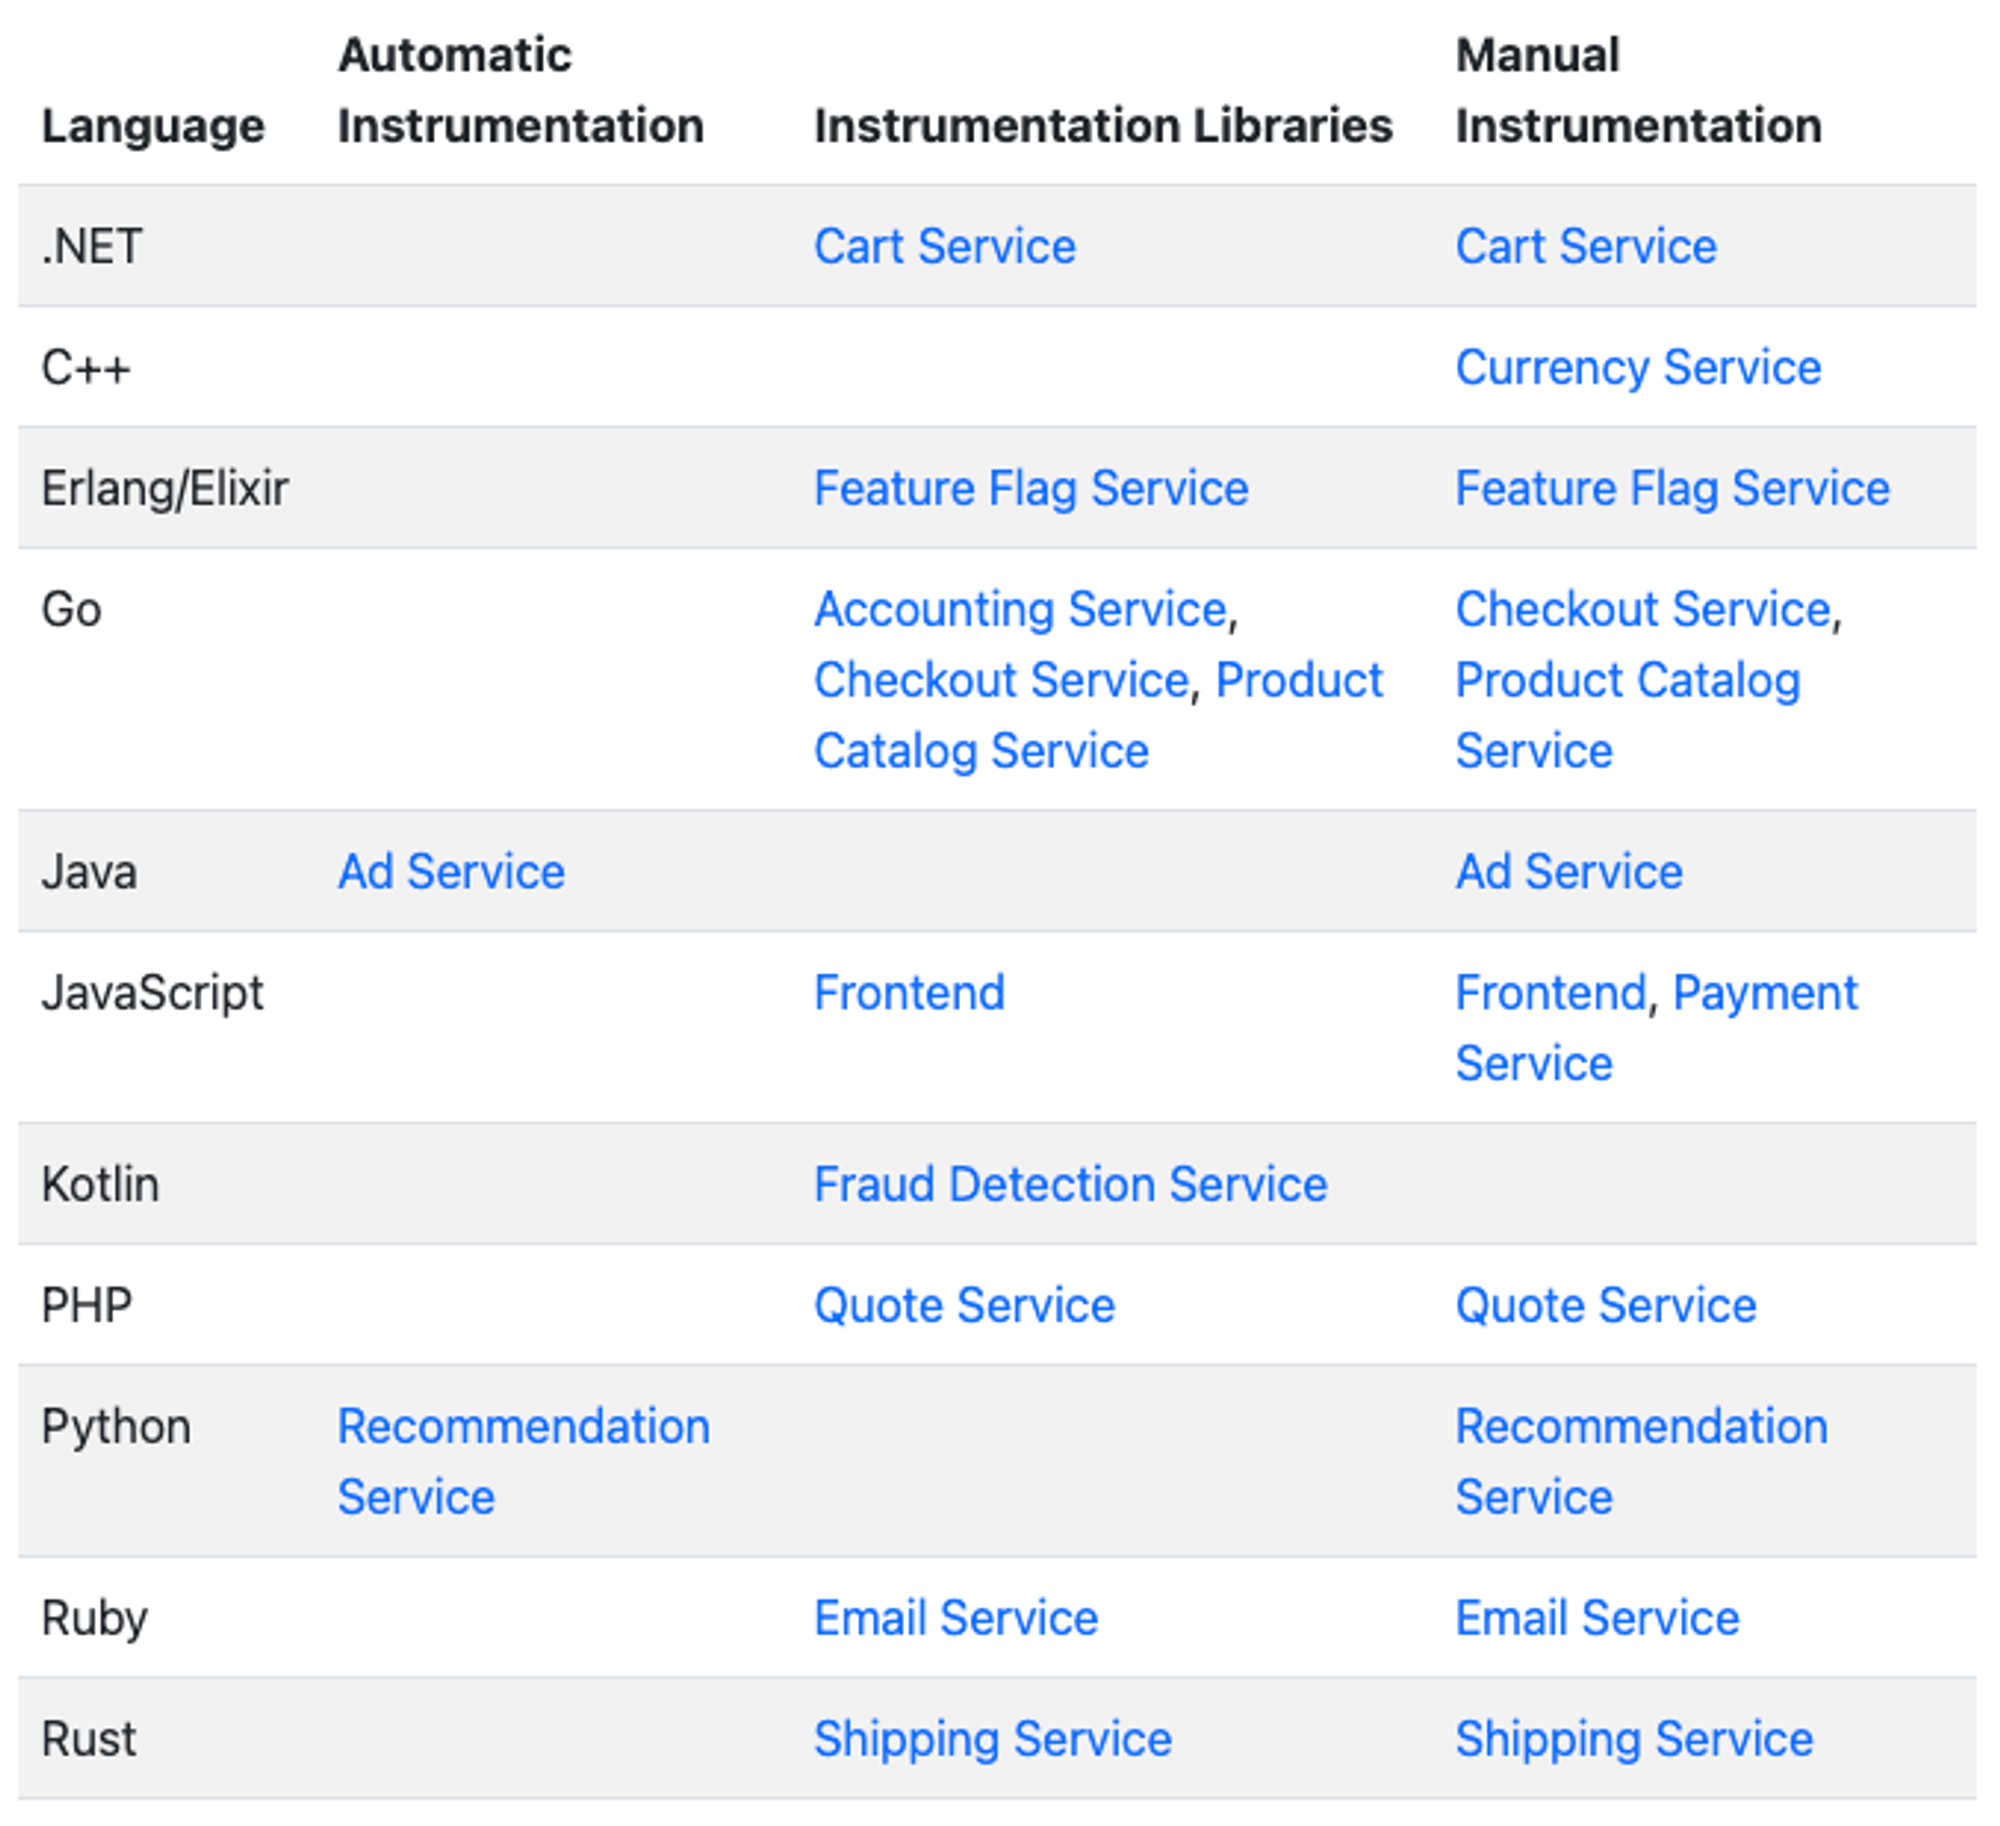
OpenTelemetry code instrumentation is available for a wide range of popular programming languages.
OpenTelemetry code [instrumentation](https://opentelemetry.io/docs/concepts/instrumentation/) is supported for [11+ languages](https://opentelemetry.io/docs/instrumentation/#status-and-releases). The topics covered may vary depending on the language and can include the following:
- [Automatic instrumentation](https://opentelemetry.io/docs/concepts/instrumentation/automatic/)
- [Manual instrumentation](https://opentelemetry.io/docs/concepts/instrumentation/manual/)
- Exporting data
If you are using Kubernetes, you can use the [OpenTelemetry Operator for Kubernetes](https://opentelemetry.io/docs/kubernetes/operator/) to automatically inject instrumentation libraries for .NET, Java, Node.js, Python, and Go into your application.
### Adding OpenTelemetry Automatic Instrumentation
This is the *magical* auto instrumentation feature, which allows you to generate traces without making any code changes. Further down in the tutorial I will demonstrate how [auto instrumentation works in Node.js](https://opentelemetry.io/docs/instrumentation/js/getting-started/nodejs/) using the `paymentservice` from the OpenTelemetry Demo, which is conveniently written in Node.js.
The `paymentservice` is part of the OpenTelemetry Demo. Let me move on and explain what the OpenTelemetry Demo is and why it exists.
## What is the OpenTelemetry Demo?
In April 2021, the OpenTelemetry Project created a demo app to illustrate how to instrument a diverse distributed system.
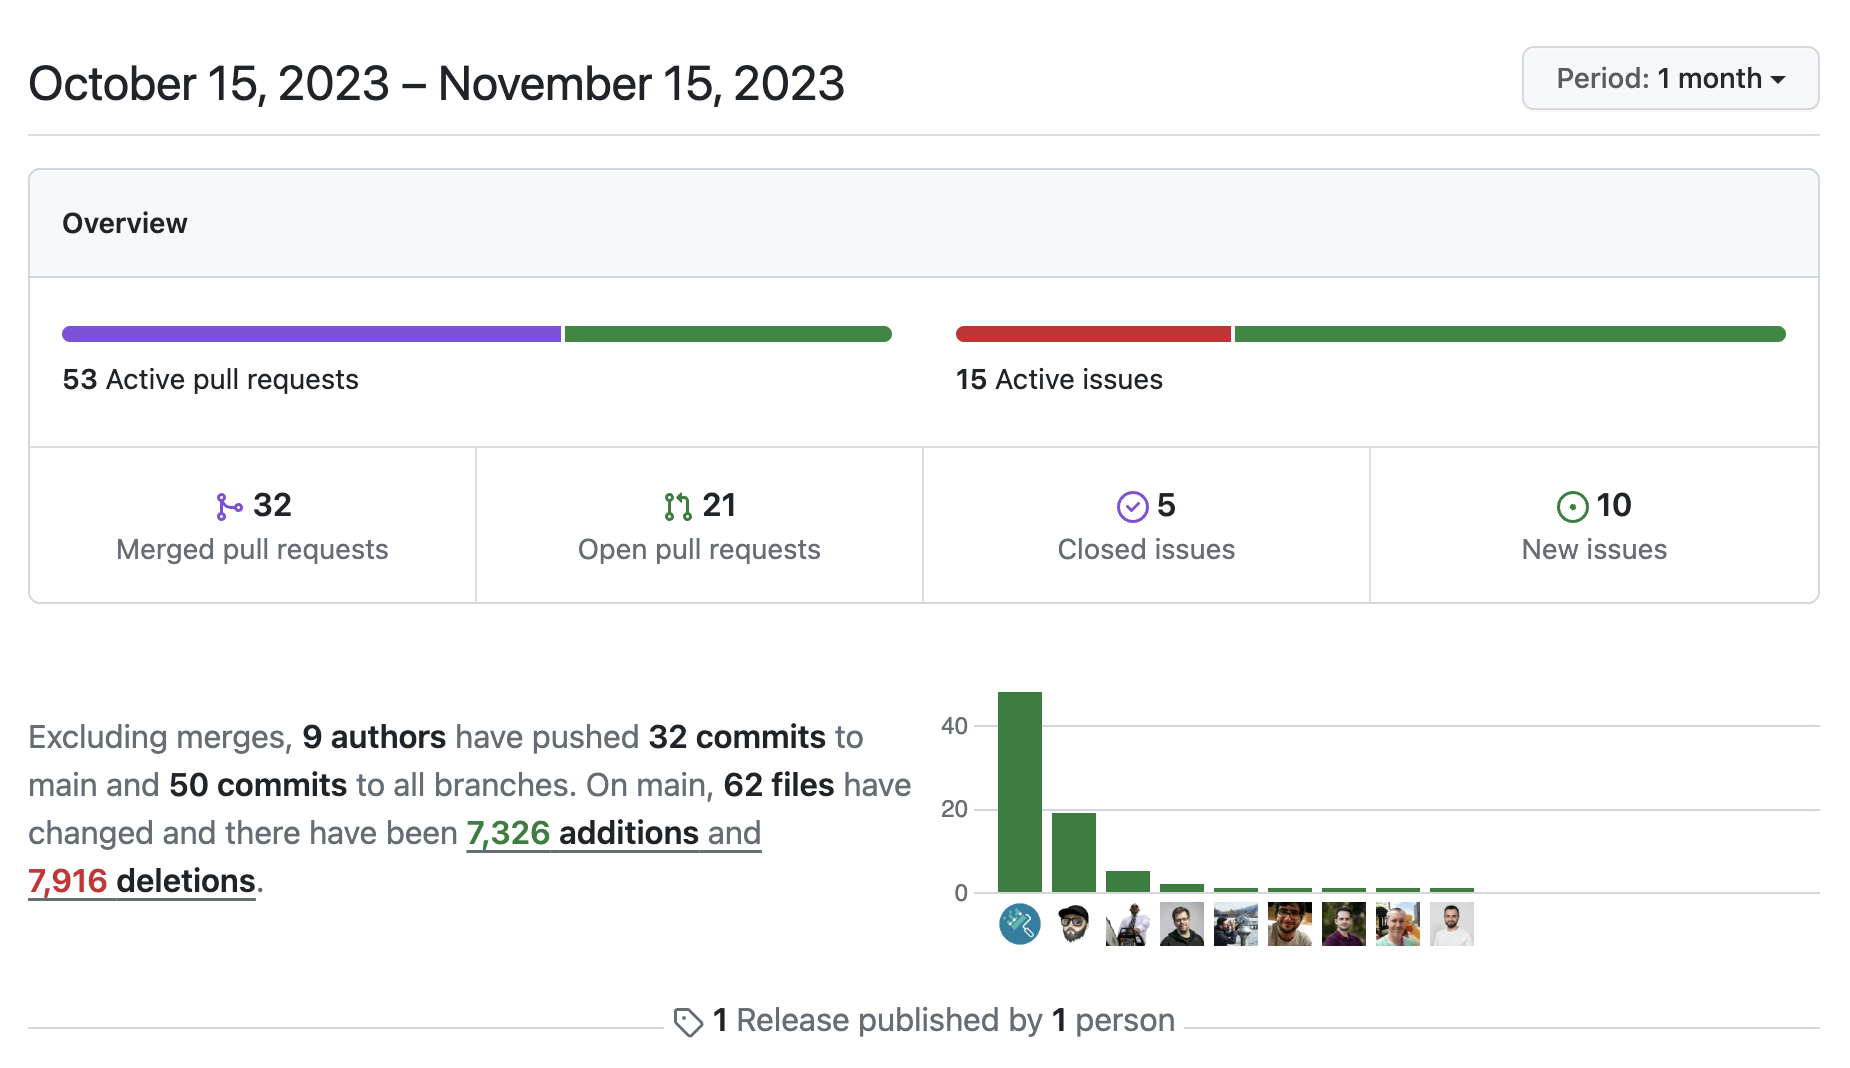
The project is widely popular, with 1.1k stars and 500 forks on [GitHub](https://github.com/open-telemetry/opentelemetry-demo). It has 89 contributors from around the world, and in the last month alone, 9 developers merged 32 pull requests into the repository.
Contributing to the [OpenTelemetry Demo](https://github.com/open-telemetry/opentelemetry-demo) is a great way to get involved and showcase your skills in the OpenTelemetry community. It's a real-world example of OpenTelemetry in action, and by actively contributing, you enhance your understanding and improve the project's quality.
The microservice app, centered around the observability theme of the OTel project, is an Astronomy Store Front, supporting [11 languages and 12 services](https://opentelemetry.io/docs/demo/#language-feature-reference) with both automatic and manual instrumentation.
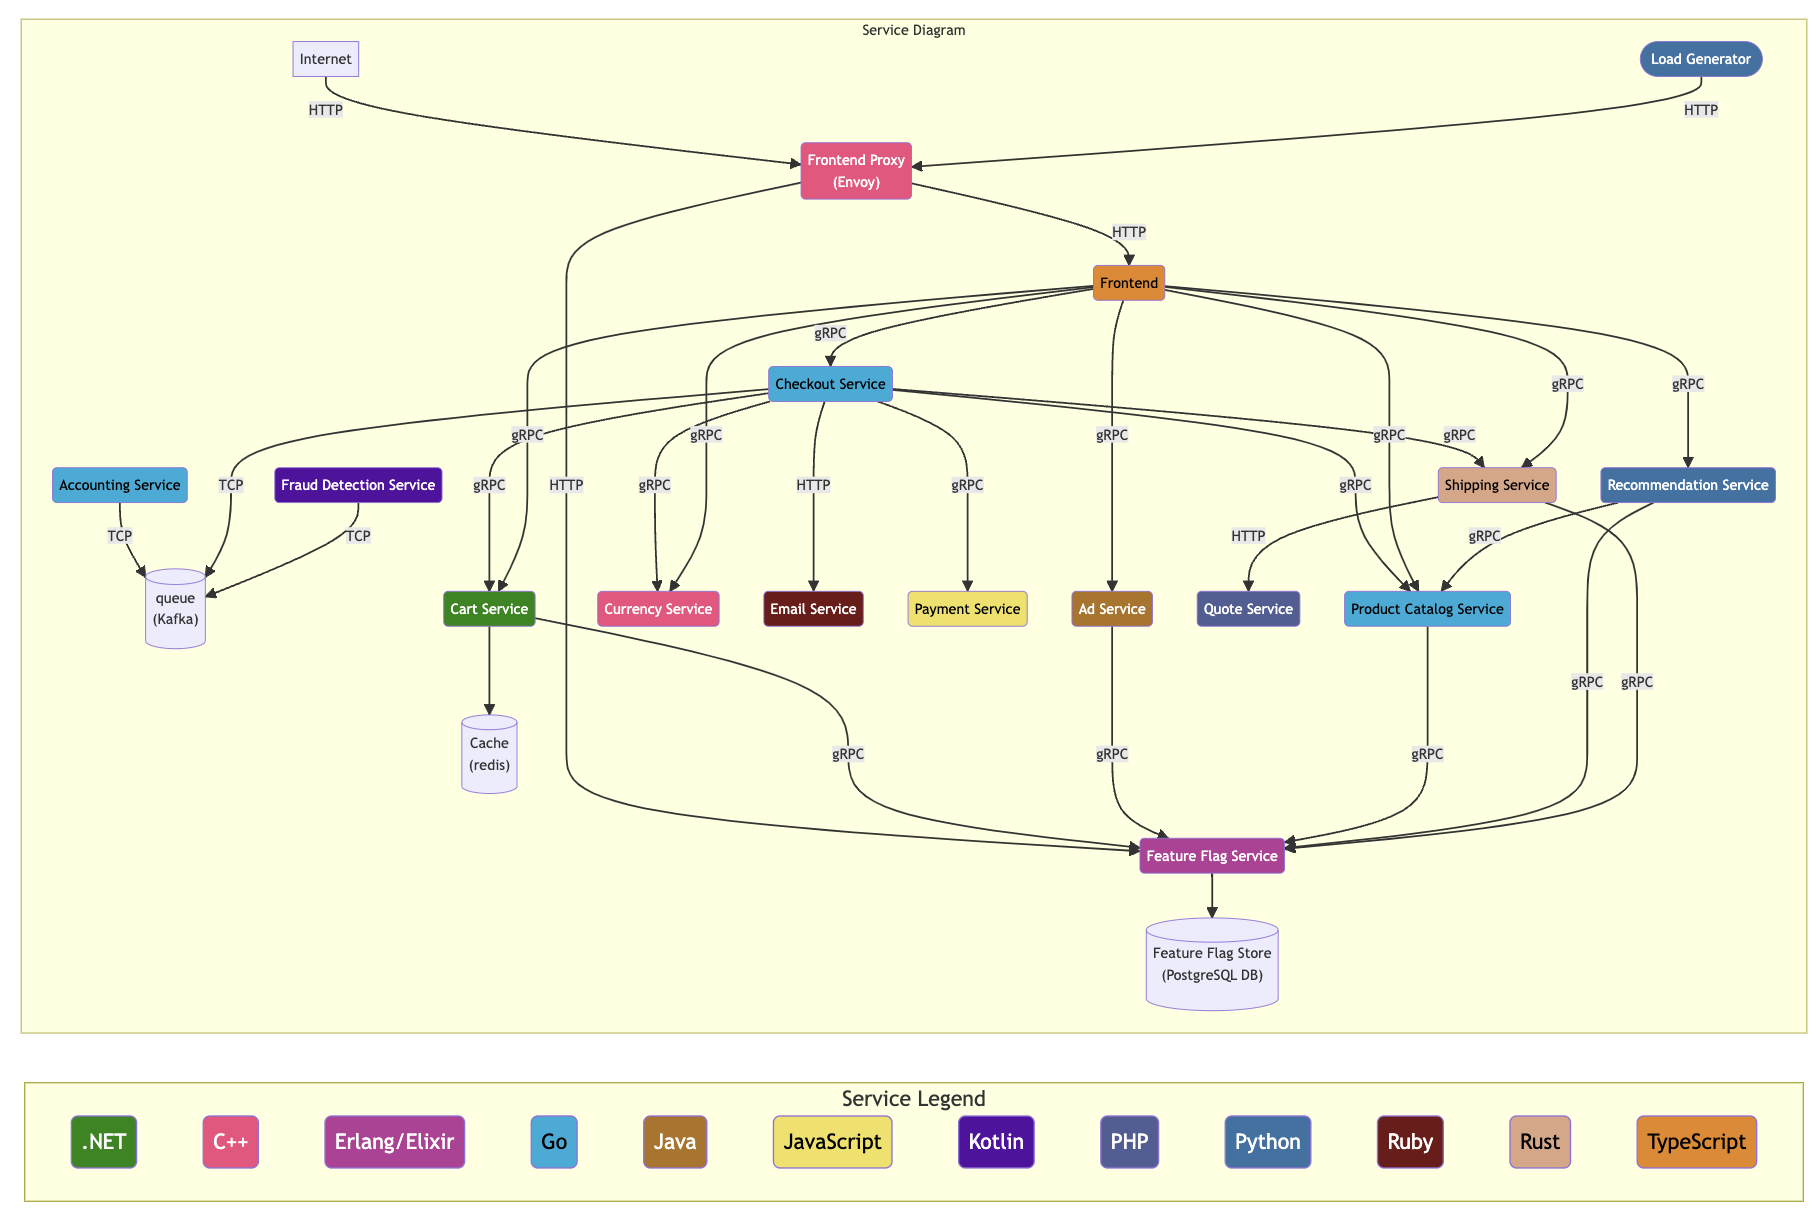
The OpenTelemetry Demo is composed of microservices written in different programming languages that talk to each other over gRPC and HTTP; and a load generator which uses [Locust](https://locust.io/) to fake user traffic.
You’re wondering, why all the complexity? Well, you want to mimic real life as closely as possible. That’s what you get! Having to manage such a distributed system makes it hard to reliably merge new features. There are 4 main pain points.
- It’s easy to introduce regressions.
- It’s easy to break telemetry.
- It’s easy to break service-to-service communication.
- It’s hard to test.
Now, once you have a clear understanding of what the OpenTelemetry Demo is, let me move on and explain how you can contribute by running all services, editing code and adding trace-based tests!
## Contributing to the **OpenTelemetry Demo**
You can install and run the OpenTelemetry Demo in Docker [with these commands](https://docs.tracetest.io/live-examples/opentelemetry-store/overview/#get-and-run-the-demo):
```bash
git clone https://github.com/open-telemetry/opentelemetry-demo.git
cd opentelemetry-demo/
make start
```
> *💡 Note: If you're running on Apple Silicon, run `make build` in order to create local images vs. pulling them from the repository.*
>
Let’s start with the [`docker-compose.yml`](https://github.com/kubeshop/opentelemetry-demo/blob/main/docker-compose.yml). It contains four types of services.
- Core Demo Services
- Dependent Services
- Telemetry Components
- Tests
### Core Demo Services
These are the core services that make up the demo itself. The shopping cart, the front end, ads, accounting, and much more. It’s the complete feature set of the “Astronomy Shop” website!
### Dependent Services
These services are required and used by the Core Demo Services. They include Postgres, Kafka, and Redis.
### Telemetry Components
These services are solely focused on observability. Meaning, collecting, storing, and visualizing telemetry data. They include Jaeger, Grafana, OpenSearch, Prometheus, and OpenTelemetry Collector.
### Tests
The test services cover front-end, integration, and trace-based tests. Including the Tracetest Server that runs the trace-based tests.
### Docker Compose Services Match the Architecture
Since the `docker-compose.yml` file is too large to embed in its entirety within a web page, [I’ve linked it here for you to check out](https://github.com/open-telemetry/opentelemetry-demo/blob/main/docker-compose.yml).
Looking at the `docker-compose.yml` you can also see the sections match the architecture overview from above.
Another cool thing to note in the `docker-compose.yml` is the `tests` profile.
> Profiles (in Docker Compose) help you adjust the Compose application model for various uses and environments by selectively starting services. This is achieved by assigning each service to zero or more profiles. If unassigned, the service is always started but if assigned, it is only started if the profile is activated.
*— [Docker Compose Website](https://docs.docker.com/compose/profiles/)*
>
This is convenient because you can start all services excluding the tests by running this command.
```bash
docker compose up
```
But, if you want to include the tests, then adding a `--profile` flag will start them as well.
```bash
docker compose --profile tests up
```
Finally, if you want to enable API observability-driven testing, you use another profile called `odd`.
```bash
docker compose --profile odd up
```
### Use the Makefile
The `makefile` contains all the shorthand commands to build, run, and test the OpenTelemetry Demo.
To start it, you run:
```bash
make start
```
Then you have more commands to stop it, build the images, and run tests.
```bash
make stop
make build
make run-tests
```
To run the trace-based tests alone, you can run this command.
```bash
make run-tracetesting
```
This command will start only the `traceBasedTests` Docker Compose service. Essentially, it’ll run:
```bash
docker compose run traceBasedTests ${SERVICES_TO_TEST}
```
Where the `${SERVICES_TO_TEST}` is a parameter you can pass to define which specific services to run tests against. In the `docker-compose.yml` you can see exactly what Dockerfile the `traceBasedTests` service uses.
```yaml
# [...]
traceBasedTests:
image: ${IMAGE_NAME}:${IMAGE_VERSION}-traceBasedTests
container_name: traceBasedTests
profiles:
- tests
build:
context: ./
dockerfile: ./test/tracetesting/Dockerfile
# [...]
```
The `Dockerfile` in the `test/tracetesting` folder installs the [Tracetest CLI](https://docs.tracetest.io/cli/cli-installation-reference) to run tests, and executes a Bash file called [`run.bash`](https://github.com/kubeshop/opentelemetry-demo/blob/main/test/tracetesting/run.bash).
```docker
# Dockerfile
# Copyright The OpenTelemetry Authors
# SPDX-License-Identifier: Apache-2.0
FROM alpine
WORKDIR /app
RUN apk --update add bash jq curl
RUN curl -L https://raw.githubusercontent.com/kubeshop/tracetest/main/install-cli.sh | bash -s -- ${TRACETEST_IMAGE_VERSION}
WORKDIR /app/test/tracetesting
ENTRYPOINT ["/bin/bash", "/app/test/tracetesting/run.bash"]
```
The `run.bash` file will dynamically either run tests against all services or just the ones you pass as parameters. It will also generate an env file for Tracetest to know how to reach the different services in order to test them. It grabs the values from [the `.env` file from the root](https://github.com/kubeshop/opentelemetry-demo/blob/main/.env) of the repository.
With that, you’re ready to run your first tests. Start by only running the `paymentservice` tests.
```bash
docker compose run traceBasedTests "payment-service"
# OR
make run-tracetesting SERVICES_TO_TEST="payment-service"
```
After a few minutes you’ll see this in your terminal.
```bash
make run-tracetesting SERVICES_TO_TEST="payment-service"
[ Output ]
docker compose run traceBasedTests payment-service
[+] Creating 21/0
✔ Container jaeger Running 0.0s
✔ Container kafka Running 0.0s
✔ Container tracetest-postgres Running 0.0s
✔ Container postgres Running 0.0s
✔ Container redis-cart Running 0.0s
✔ Container feature-flag-service Running 0.0s
✔ Container otel-col Running 0.0s
✔ Container currency-service Running 0.0s
✔ Container cart-service Running 0.0s
✔ Container payment-service Running 0.0s
✔ Container tracetest-server Running 0.0s
✔ Container quote-service Running 0.0s
✔ Container accounting-service Running 0.0s
✔ Container frauddetection-service Running 0.0s
✔ Container product-catalog-service Running 0.0s
✔ Container ad-service Running 0.0s
✔ Container email-service Running 0.0s
✔ Container recommendation-service Running 0.0s
✔ Container shipping-service Running 0.0s
✔ Container checkout-service Running 0.0s
✔ Container frontend Running 0.0s
[+] Running 3/3
✔ Container postgres Healthy 0.5s
✔ Container kafka Healthy 0.5s
✔ Container tracetest-postgres Healthy 0.5s
Starting tests...
Running trace-based tests...
✔ Payment Service (http://tracetest-server:11633/testsuite/payment-service-all/run/2)
✔ Payment: valid credit card (http://tracetest-server:11633/test/payment-valid-credit-card/run/2/test) - trace id: 7774d4754957e5fa5b916e4d6d5880e7
✔ It should call Charge method successfully
✔ It should return a transaction ID
✔ It should return a valid credit card
✔ Payment: invalid credit card (http://tracetest-server:11633/test/payment-invalid-credit-card/run/2/test) - trace id: a20c1d166cd6edf4d8f288e407e76623
✔ It should call Charge method and receive a gRPC error
✔ It should return a return an gRPC error code to the caller
✔ Payment: Amex credit card not allowed (http://tracetest-server:11633/test/payment-amex-credit-card-not-allowed/run/2/test) - trace id: a5812bf50ac61a387dc991ba0dd3020a
✔ It should call Charge method and receive a gRPC error
✔ It should return a return an gRPC error code to the caller
✔ Payment: expired credit card (http://tracetest-server:11633/test/payment-expired-credit-card/run/2/test) - trace id: fecb6368104b0fc27e7806136fc1ab1c
✔ It should call Charge method and receive a gRPC error
✔ It should return a return an gRPC error code to the caller
Tests done! Exit code: 0
```
You can also start the Tracetest services alongside all the Core Demo Services, Dependent Services, and Telemetry Components as part of your development lifecycle to enable [Observability-driven Development (ODD)](https://stackoverflow.blog/2022/10/12/how-observability-driven-development-creates-elite-performers/). Mainly to trigger your APIs and validate both the response and trace data they generate. You can also build tests visually and save them as YAML files to add to your code repo for automated testing. I’ll walk you through all of this a bit later as well.
To do this, you’ll use the `odd` [Docker Compose profile](https://docs.docker.com/compose/profiles/). Run the demo like this:
```bash
docker compose --profile odd up --force-recreate --remove-orphans --detach
# OR
make start-odd
```
Go ahead and start the OpenTelemetry Demo including Tracetest, with the `odd` profile.
Once the images are built and containers are started you can access:
- Web store: [http://localhost:8080/](http://localhost:8080/)
- Grafana: [http://localhost:8080/grafana/](http://localhost:8080/grafana/)
- Feature Flags UI: [http://localhost:8080/feature/](http://localhost:8080/feature/)
- Load Generator UI: [http://localhost:8080/loadgen/](http://localhost:8080/loadgen/)
- Jaeger UI: [http://localhost:8080/jaeger/ui/](http://localhost:8080/jaeger/ui/)
- Tracetest UI: [http://localhost:11633/](http://localhost:11633/), only when using `make start-odd`
To run a test against the Payment Service, I’ll use a YAML file and trigger it with the [Tracetest CLI](https://docs.tracetest.io/getting-started/installation#install-the-tracetest-cli). Alternatively, you can also build tests visually in the Tracetest UI on [http://localhost:11633/](http://localhost:11633/).
> *Here’s a [short guide on how to create tests programatically](https://docs.tracetest.io/getting-started/open#creating-trace-based-tests-programatically) with Tracetest.*
>
Next, let’s move on to explaining and adding code instrumentation in the `paymentservice`.
### Adding OpenTelemetry to the Payment Service
I’ve prepared a fork with detailed code examples and three demos. This will help you understand how to add OpenTelemetry code instrumentation.
```bash
git clone https://github.com/kubeshop/opentelemetry-demo.git
cd opentelemetry-demo/
make start-odd
```
Here’s a snippet of what configuring [automatic instrumentation for Node.js looks like in the `src/paymentservice/opentelemetry.js` file](https://github.com/kubeshop/opentelemetry-demo/blob/main/src/paymentservice/opentelemetry.js).
```jsx
// src/paymentservice/opentelemetry.js
const opentelemetry = require("@opentelemetry/sdk-node")
const {getNodeAutoInstrumentations} = require("@opentelemetry/auto-instrumentations-node")
const {OTLPTraceExporter} = require('@opentelemetry/exporter-trace-otlp-grpc')
const {OTLPMetricExporter} = require('@opentelemetry/exporter-metrics-otlp-grpc')
const {PeriodicExportingMetricReader} = require('@opentelemetry/sdk-metrics')
const {alibabaCloudEcsDetector} = require('@opentelemetry/resource-detector-alibaba-cloud')
const {awsEc2Detector, awsEksDetector} = require('@opentelemetry/resource-detector-aws')
const {containerDetector} = require('@opentelemetry/resource-detector-container')
const {gcpDetector} = require('@opentelemetry/resource-detector-gcp')
const {envDetector, hostDetector, osDetector, processDetector} = require('@opentelemetry/resources')
const sdk = new opentelemetry.NodeSDK({
// OTLPTraceExporter() uses the env var "OTEL_EXPORTER_OTLP_ENDPOINT" when not explicitly set.
traceExporter: new OTLPTraceExporter(),
instrumentations: [
getNodeAutoInstrumentations()
],
metricReader: new PeriodicExportingMetricReader({
exporter: new OTLPMetricExporter(),
}),
resourceDetectors: [
containerDetector,
envDetector,
hostDetector,
osDetector,
processDetector,
alibabaCloudEcsDetector,
awsEksDetector,
awsEc2Detector,
gcpDetector
],
})
sdk.start()
```
> *View automatic instrumentation samples for other programming languages, [here](https://opentelemetry.io/docs/instrumentation/).*
>
These few lines of code will automatically start generating trace spans for your service.
The [`paymentservice`](https://github.com/kubeshop/opentelemetry-demo/tree/main/src/paymentservice) also includes manually instrumented spans as well. If you take a look at the [`src/paymentservice/index.js`](https://github.com/kubeshop/opentelemetry-demo/blob/main/src/paymentservice/index.js) and [`src/paymentservice/charge.js`](https://github.com/kubeshop/opentelemetry-demo/blob/main/src/paymentservice/charge.js) you’ll see a require statement for the `@opentelemetry/api`, and a tracer that creates a span with some attributes.
```jsx
// src/paymentservice/index.js
// Line 6
const { trace, context, SpanStatusCode } = require('@opentelemetry/api')
const tracer = trace.getTracer('paymentservice')
// [...]
function chargeServiceHandler(call, callback) {
// Line 23
const span = trace.getActiveSpan()
try {
const amount = call.request.amount
span.setAttributes({
'app.payment.amount': parseFloat(`${amount.units}.${amount.nanos}`)
})
span.addEvent('Charge request received.', {
'log.severity': 'info',
'log.message': 'Charge request received.',
'request': call.request,
})
const response = charge.charge(call.request)
// [...]
} catch (err) {
// [...]
}
}
// src/paymentservice/charge.js
// Line 4
const opentelemetry = require('@opentelemetry/api')
const {context, propagation, trace, metrics} = opentelemetry
// [...]
// Line 10
const tracer = trace.getTracer('paymentservice')
// [...]
// Line 21
const span = trace.getActiveSpan()
// [...]
// Line 53
span.setAttributes({
'app.payment.card_type': cardType,
'app.payment.card_valid': valid
})
// [...]
```
I’ll walk you through these three demos, with one sample without telemetry.
1. **Demo 0**: What’s it like without OpenTelemetry traces?
2. **Demo 1**: Get the active span from the context and use it as the main span in the `chargeServiceHandler` .
3. **Demo 2**: Get the active span from the context to create a new context. Create a new span for the `chargeServiceHandler` and pass the new context in as a parameter.
4. **Demo 3**: Create a new active span for the `chargeServiceHandler` without the need to pass a parent span and context.
But first, let’s make it harder! It’s easy to get started when somebody is holding your hand. Let’s remove the guardrails for a second. Literally, let’s remove the OpenTelemetry instrumentation and run some API tests to see what happens.
### Removing OpenTelemetry and Running API Tests
Without the `opentelemetry.js` file that contains auto instrumentation, triggering the `paymentservice/charge` API endpoint will result in no traces showing up. Let’s reproduce this by running an API test with Tracetest. First, I’ll comment out all the content in the `opentelemetry.js` file. Then, comment out all the OpenTelemetry-specific code in the `index.js` and `charge.js`.
You’ll see a “**0. Demo**” comment section. If you need help figuring out what code to exclude, it can be your guideline.
```jsx
// src/paymentservice/index.js
function chargeServiceHandler(call, callback) {
/**
* 0. Demo Start
* 0. Demo: No telemetry
*/
try {
const response = charge.charge(call.request)
callback(null, response)
} catch (err) {
callback(err)
}
/**
* 0. Demo End
*/
}
// src/paymentservice/charge.js
// Comment out code below this block comment:
/**
* 1. & 2. & 3. Demo
* End the span.
*/
```
To run a test against the Payment Service, I’ll use a YAML file and trigger it with the [Tracetest CLI](https://docs.tracetest.io/getting-started/installation#install-the-tracetest-cli).
The test is located in the [`test/tracetesting/payment-service`](https://github.com/kubeshop/opentelemetry-demo/blob/contrib-otel-demo/test/tracetesting/payment-service) directory on the `contrib-otel-demo` branch. The directory has 5 files, but you'll focus on the file called `exploratory-test.yaml`.
```yaml
# exploratory-test.yaml
type: Test
spec:
id: payment-valid-credit-card
name: "Payment: Exploratory test of credit card"
description: Charge customer with a credit card
trigger:
type: grpc
grpc:
protobufFile: ../../../../pb/demo.proto
address: paymentservice:50051
method: oteldemo.PaymentService.Charge
request: |-
{
"amount": {
"currencyCode": "USD",
"units": 43,
"nanos": 130000000
},
"creditCard": {
"creditCardNumber": "4432-8015-6152-0454",
"creditCardCvv": 672,
"creditCardExpirationYear": 2039,
"creditCardExpirationMonth": 1
}
}
```
As you see it’s a gRPC API and it’s using a [protobuf file called `demo.proto`](https://github.com/kubeshop/opentelemetry-demo/blob/main/pb/demo.proto). Here’s a snippet for the `Charge` method in the `demo.proto`.
```protobuf
// Line 179
service PaymentService {
rpc Charge(ChargeRequest) returns (ChargeResponse) {}
}
message CreditCardInfo {
string credit_card_number = 1;
int32 credit_card_cvv = 2;
int32 credit_card_expiration_year = 3;
int32 credit_card_expiration_month = 4;
}
message ChargeRequest {
Money amount = 1;
CreditCardInfo credit_card = 2;
}
message ChargeResponse {
string transaction_id = 1;
}
```
Triggering the test is as easy as running this command with the Tracetest CLI.
```bash
tracetest run test -f path-to-dir/exploratory-test.yaml
```
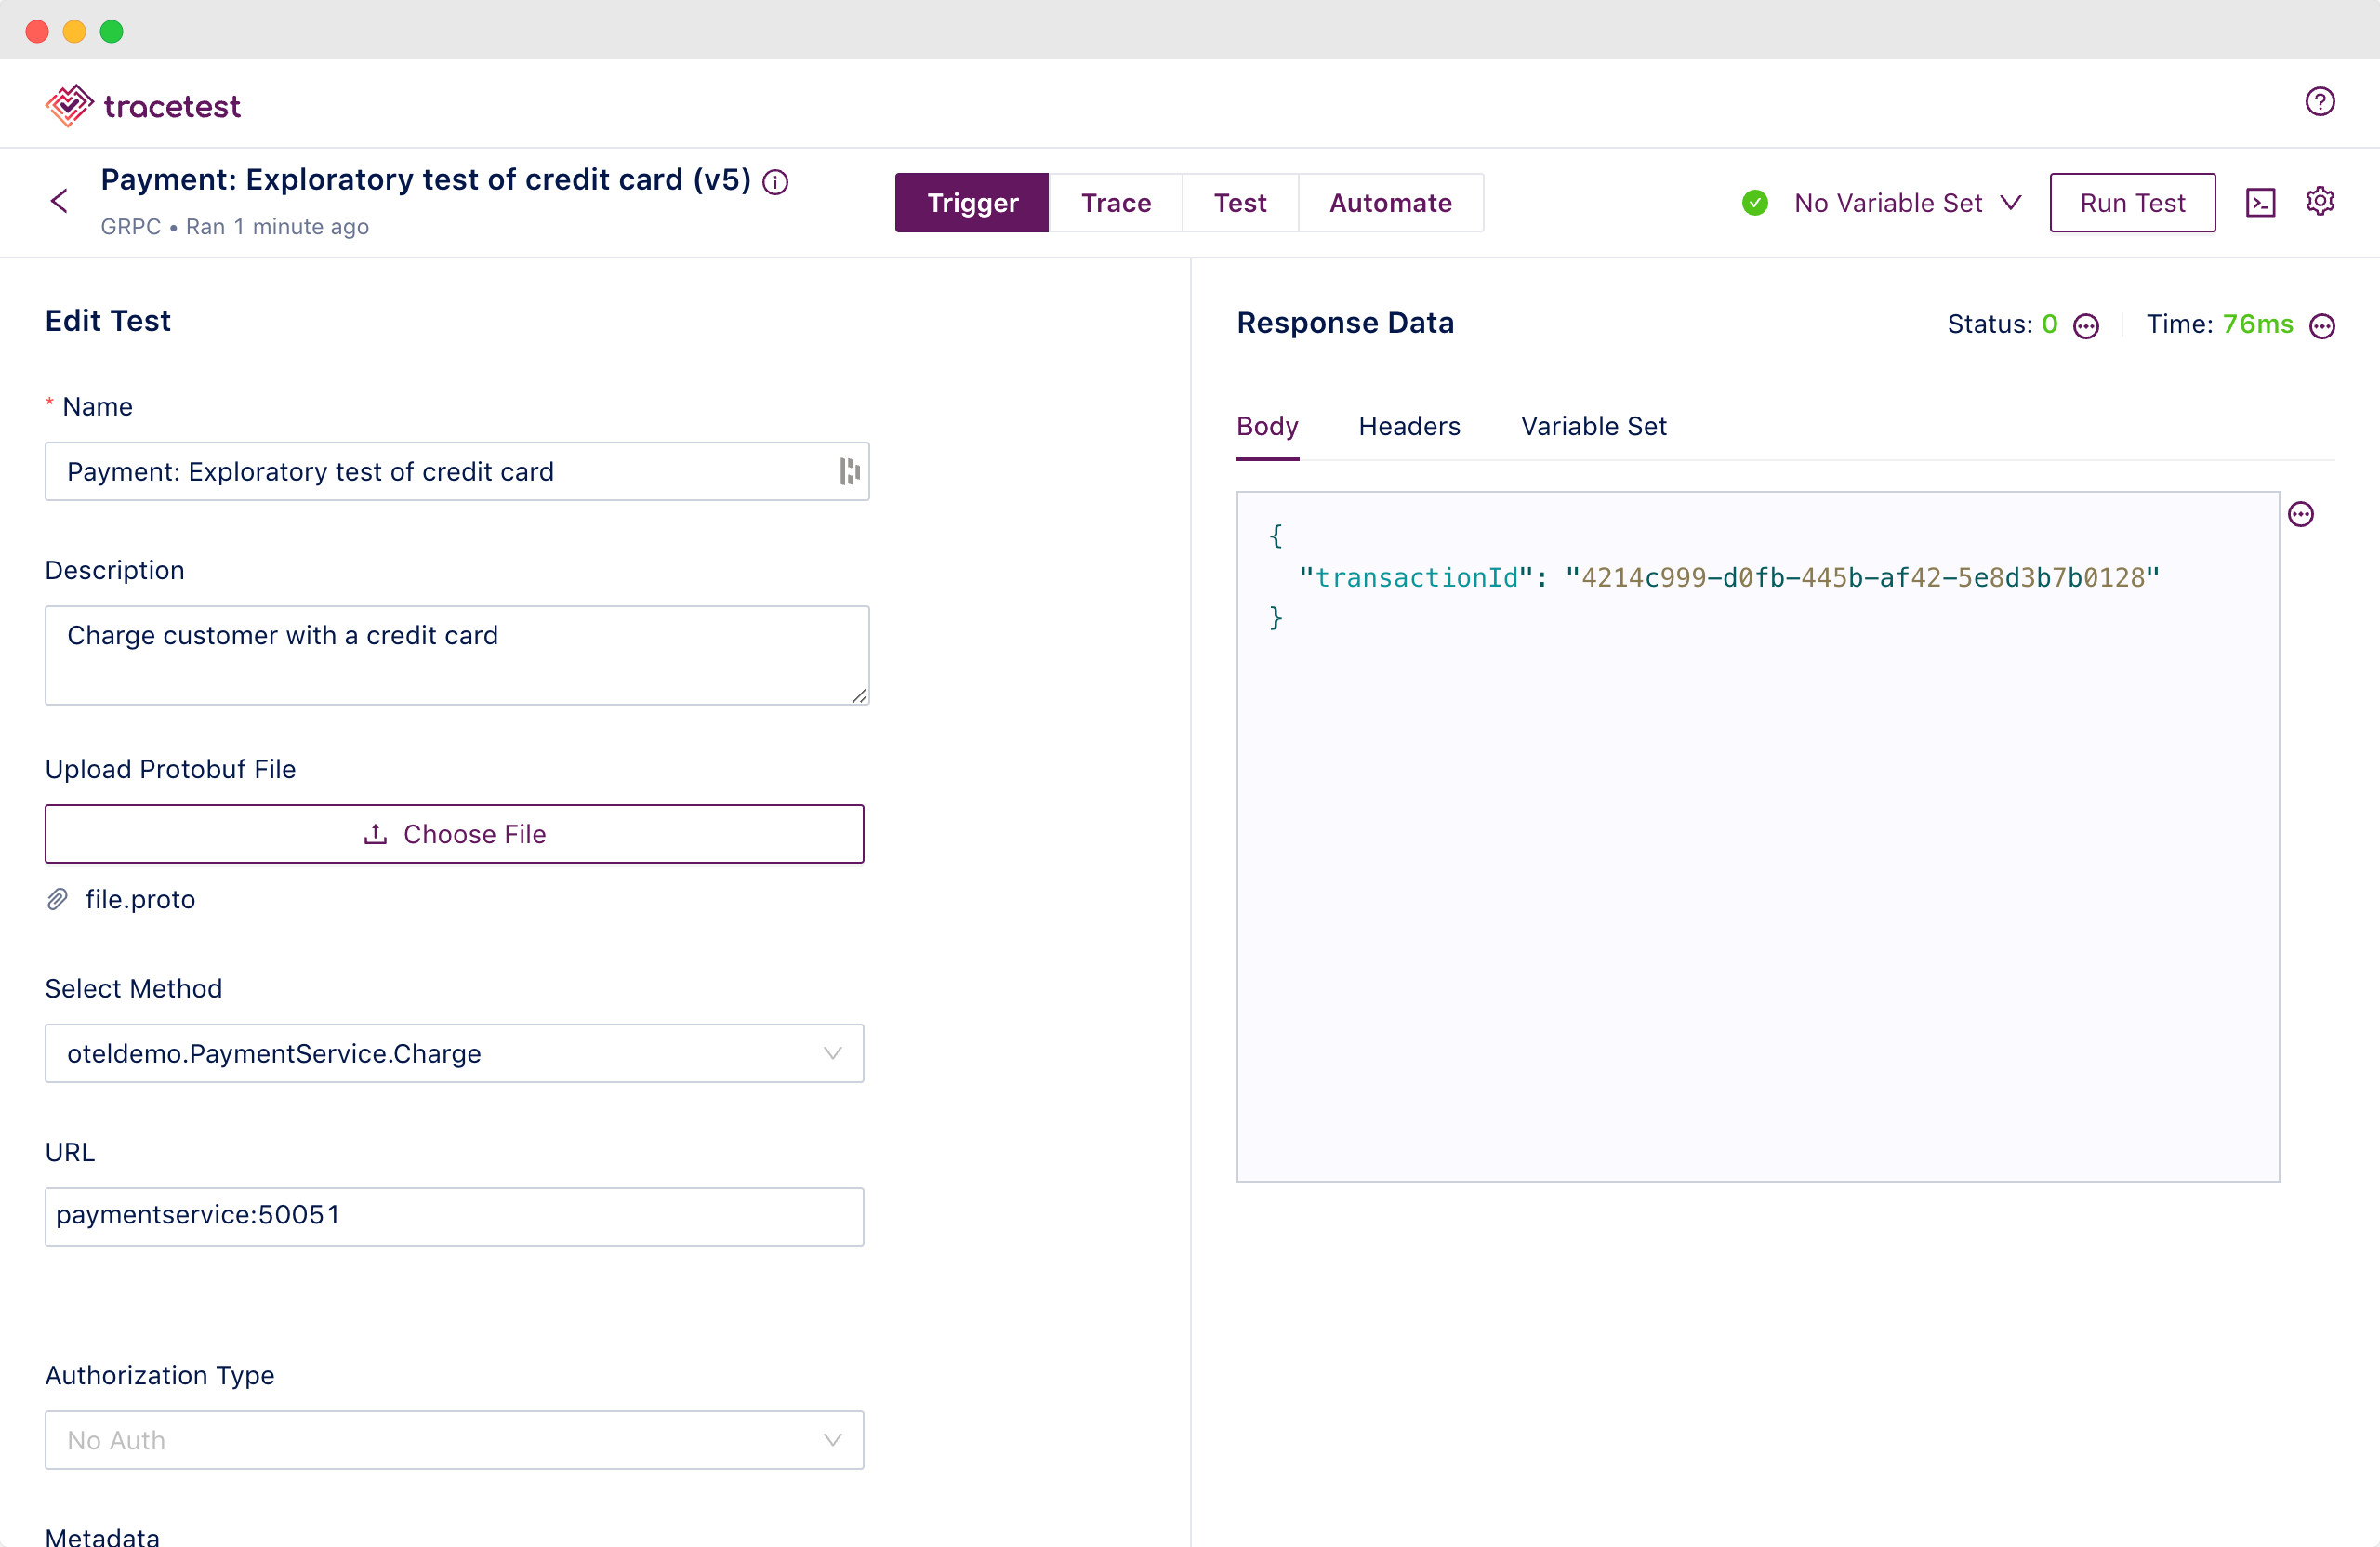
The test will return a response just fine, but the trace polling will timeout since it won’t be able to find any traces.
It makes sense since you just disabled the OpenTelemetry code instrumentation.
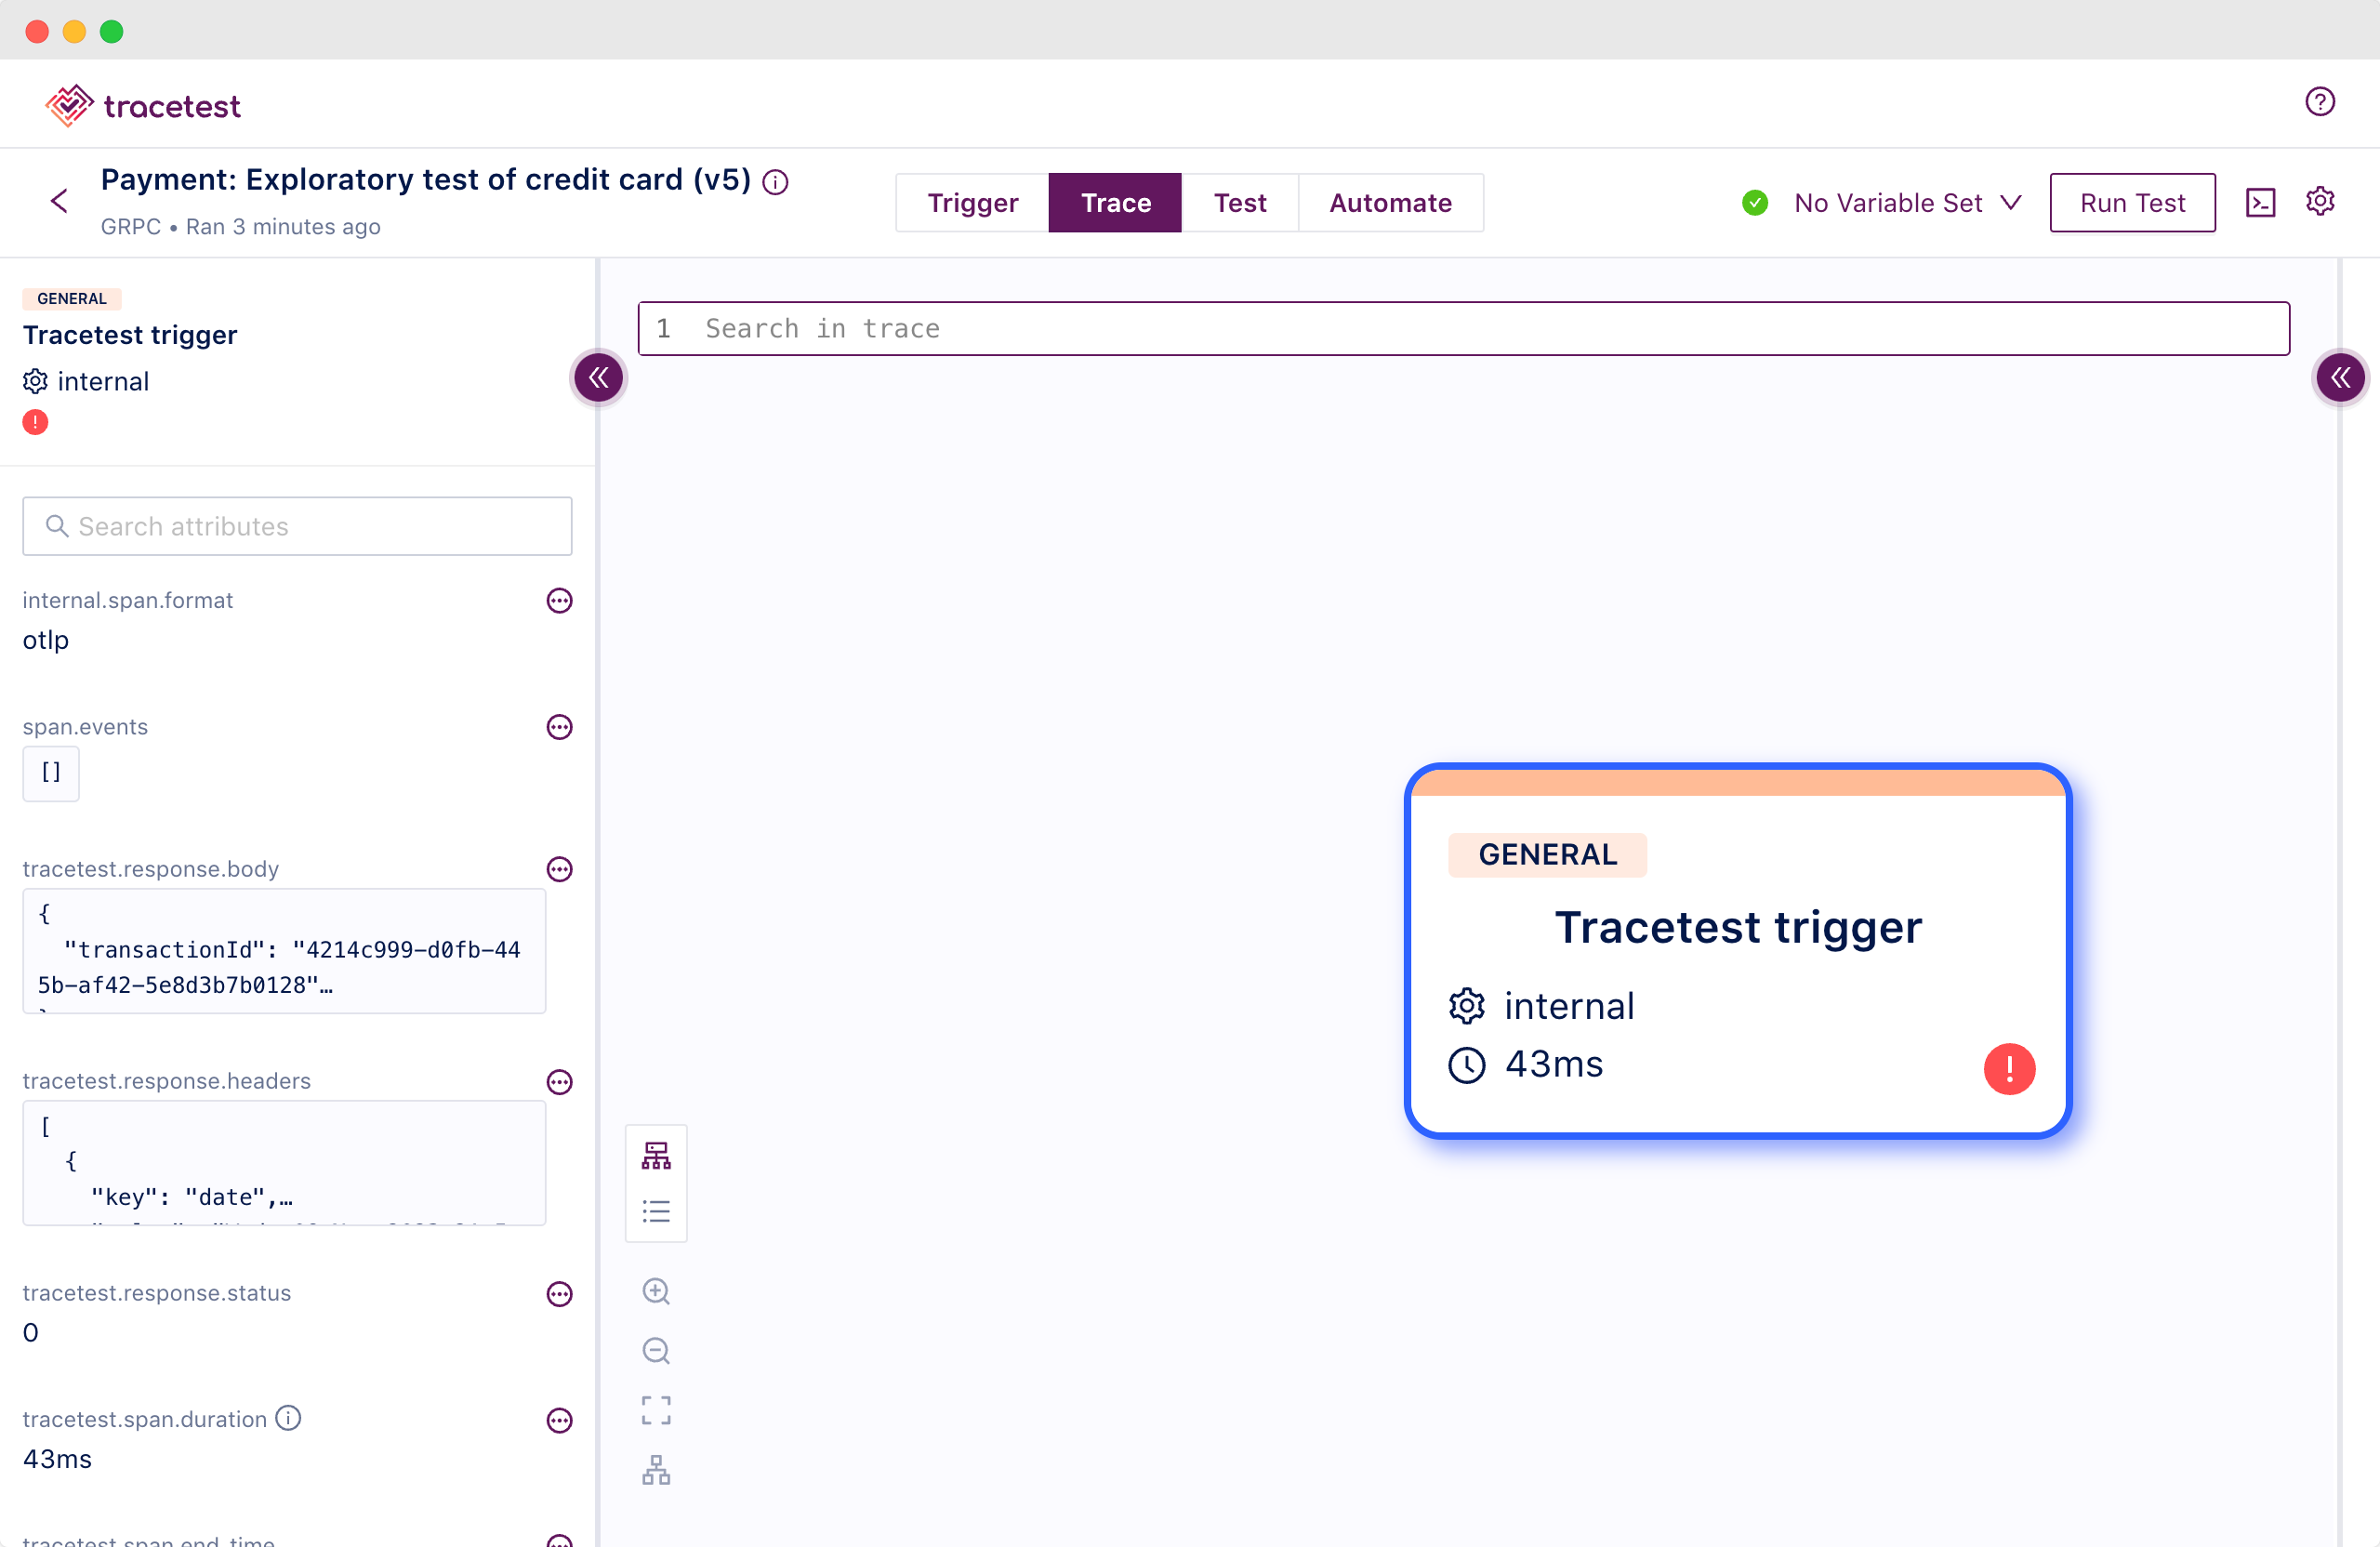
### Learning About Active Spans and Context
Let me backtrack and add both the automatic and manual instrumentation back into the `paymentservice`. Once I add them and trigger the `paymentservice/charge` API endpoint, traces will be displayed and I’ll be able to create tests. It’s as simple as that to get started!
As I mentioned above, I’ve prepared comments labeled **“1. Demo”** that showcase which commented code to include. This demo shows how to use the active `rpc` span from the injected gRPC instrumentation as the main span in the `chargeServiceHandler` . All our additional manual telemetry will be added to that span.
Open up the [`src/paymentservice/index.js`](https://github.com/kubeshop/opentelemetry-demo/blob/main/src/paymentservice/index.js) and [`src/paymentservice/charge.js`](https://github.com/kubeshop/opentelemetry-demo/blob/main/src/paymentservice/charge.js) once again.
Make sure to include these lines:
```jsx
// src/paymentservice/index.js
// [...]
const { trace, context, SpanStatusCode } = require('@opentelemetry/api')
// [...]
function chargeServiceHandler(call, callback) {
const span = trace.getActiveSpan()
try {
const amount = call.request.amount
/**
* Add span attributes and events for custom test specs
*/
span.setAttributes({
'app.payment.amount': parseFloat(`${amount.units}.${amount.nanos}`)
})
span.addEvent('Charge request received.', {
'log.severity': 'info',
'log.message': 'Charge request received.',
'request': call.request,
})
const response = charge.charge(call.request)
/**
* Add span attributes and events for custom test specs
*/
span.setStatus({ code: SpanStatusCode.OK })
span.end()
callback(null, response)
} catch (err) {
/**
* Add span attributes and events for custom test specs
*/
span.addEvent('Charge request error.', {
'log.severity': 'warn',
'log.message': 'Charge request error.',
'error': err,
})
span.recordException(err)
span.setStatus({ code: SpanStatusCode.ERROR })
span.end()
callback(err)
}
}
// src/paymentservice/charge.js
const opentelemetry = require('@opentelemetry/api')
const {context, propagation, trace, metrics} = opentelemetry
// [...]
module.exports.charge = request => {
const span = trace.getActiveSpan()
const {
creditCardNumber: number,
creditCardExpirationYear: year,
creditCardExpirationMonth: month
} = request.creditCard
const currentMonth = new Date().getMonth() + 1
const currentYear = new Date().getFullYear()
const lastFourDigits = number.substr(-4)
const transactionId = uuidv4()
const card = cardValidator(number)
const { card_type: cardType, valid } = card.getCardDetails()
span.setAttributes({
'app.payment.card_type': cardType,
'app.payment.card_valid': valid
})
if (!valid) {
throw new Error('Credit card info is invalid.')
}
if (!['visa', 'mastercard'].includes(cardType)) {
throw new Error(`Sorry, we cannot process ${cardType} credit cards. Only VISA or MasterCard is accepted.`)
}
if ((currentYear * 12 + currentMonth) > (year * 12 + month)) {
throw new Error(`The credit card (ending ${lastFourDigits}) expired on ${month}/${year}.`)
}
const baggage = propagation.getBaggage(context.active())
if (baggage && baggage.getEntry("synthetic_request") && baggage.getEntry("synthetic_request").value === "true") {
span.setAttribute('app.payment.charged', false)
} else {
span.setAttribute('app.payment.charged', true)
}
span.end()
const { units, nanos, currencyCode } = request.amount
// [...]
transactionsCounter.add(1, {"app.payment.currency": currencyCode})
return { transactionId }
}
```
Running the test again will show the `rpc` span correctly.
```bash
tracetest run test -f path-to-dir/exploratory-test.yaml
```
However, you’re still not there yet! I want you to understand how to create a child span below the `rpc` span. The child span will be dedicated too the `charge.js` file and make it easier to view span attributes separately instead of bundling all of them onto one span.
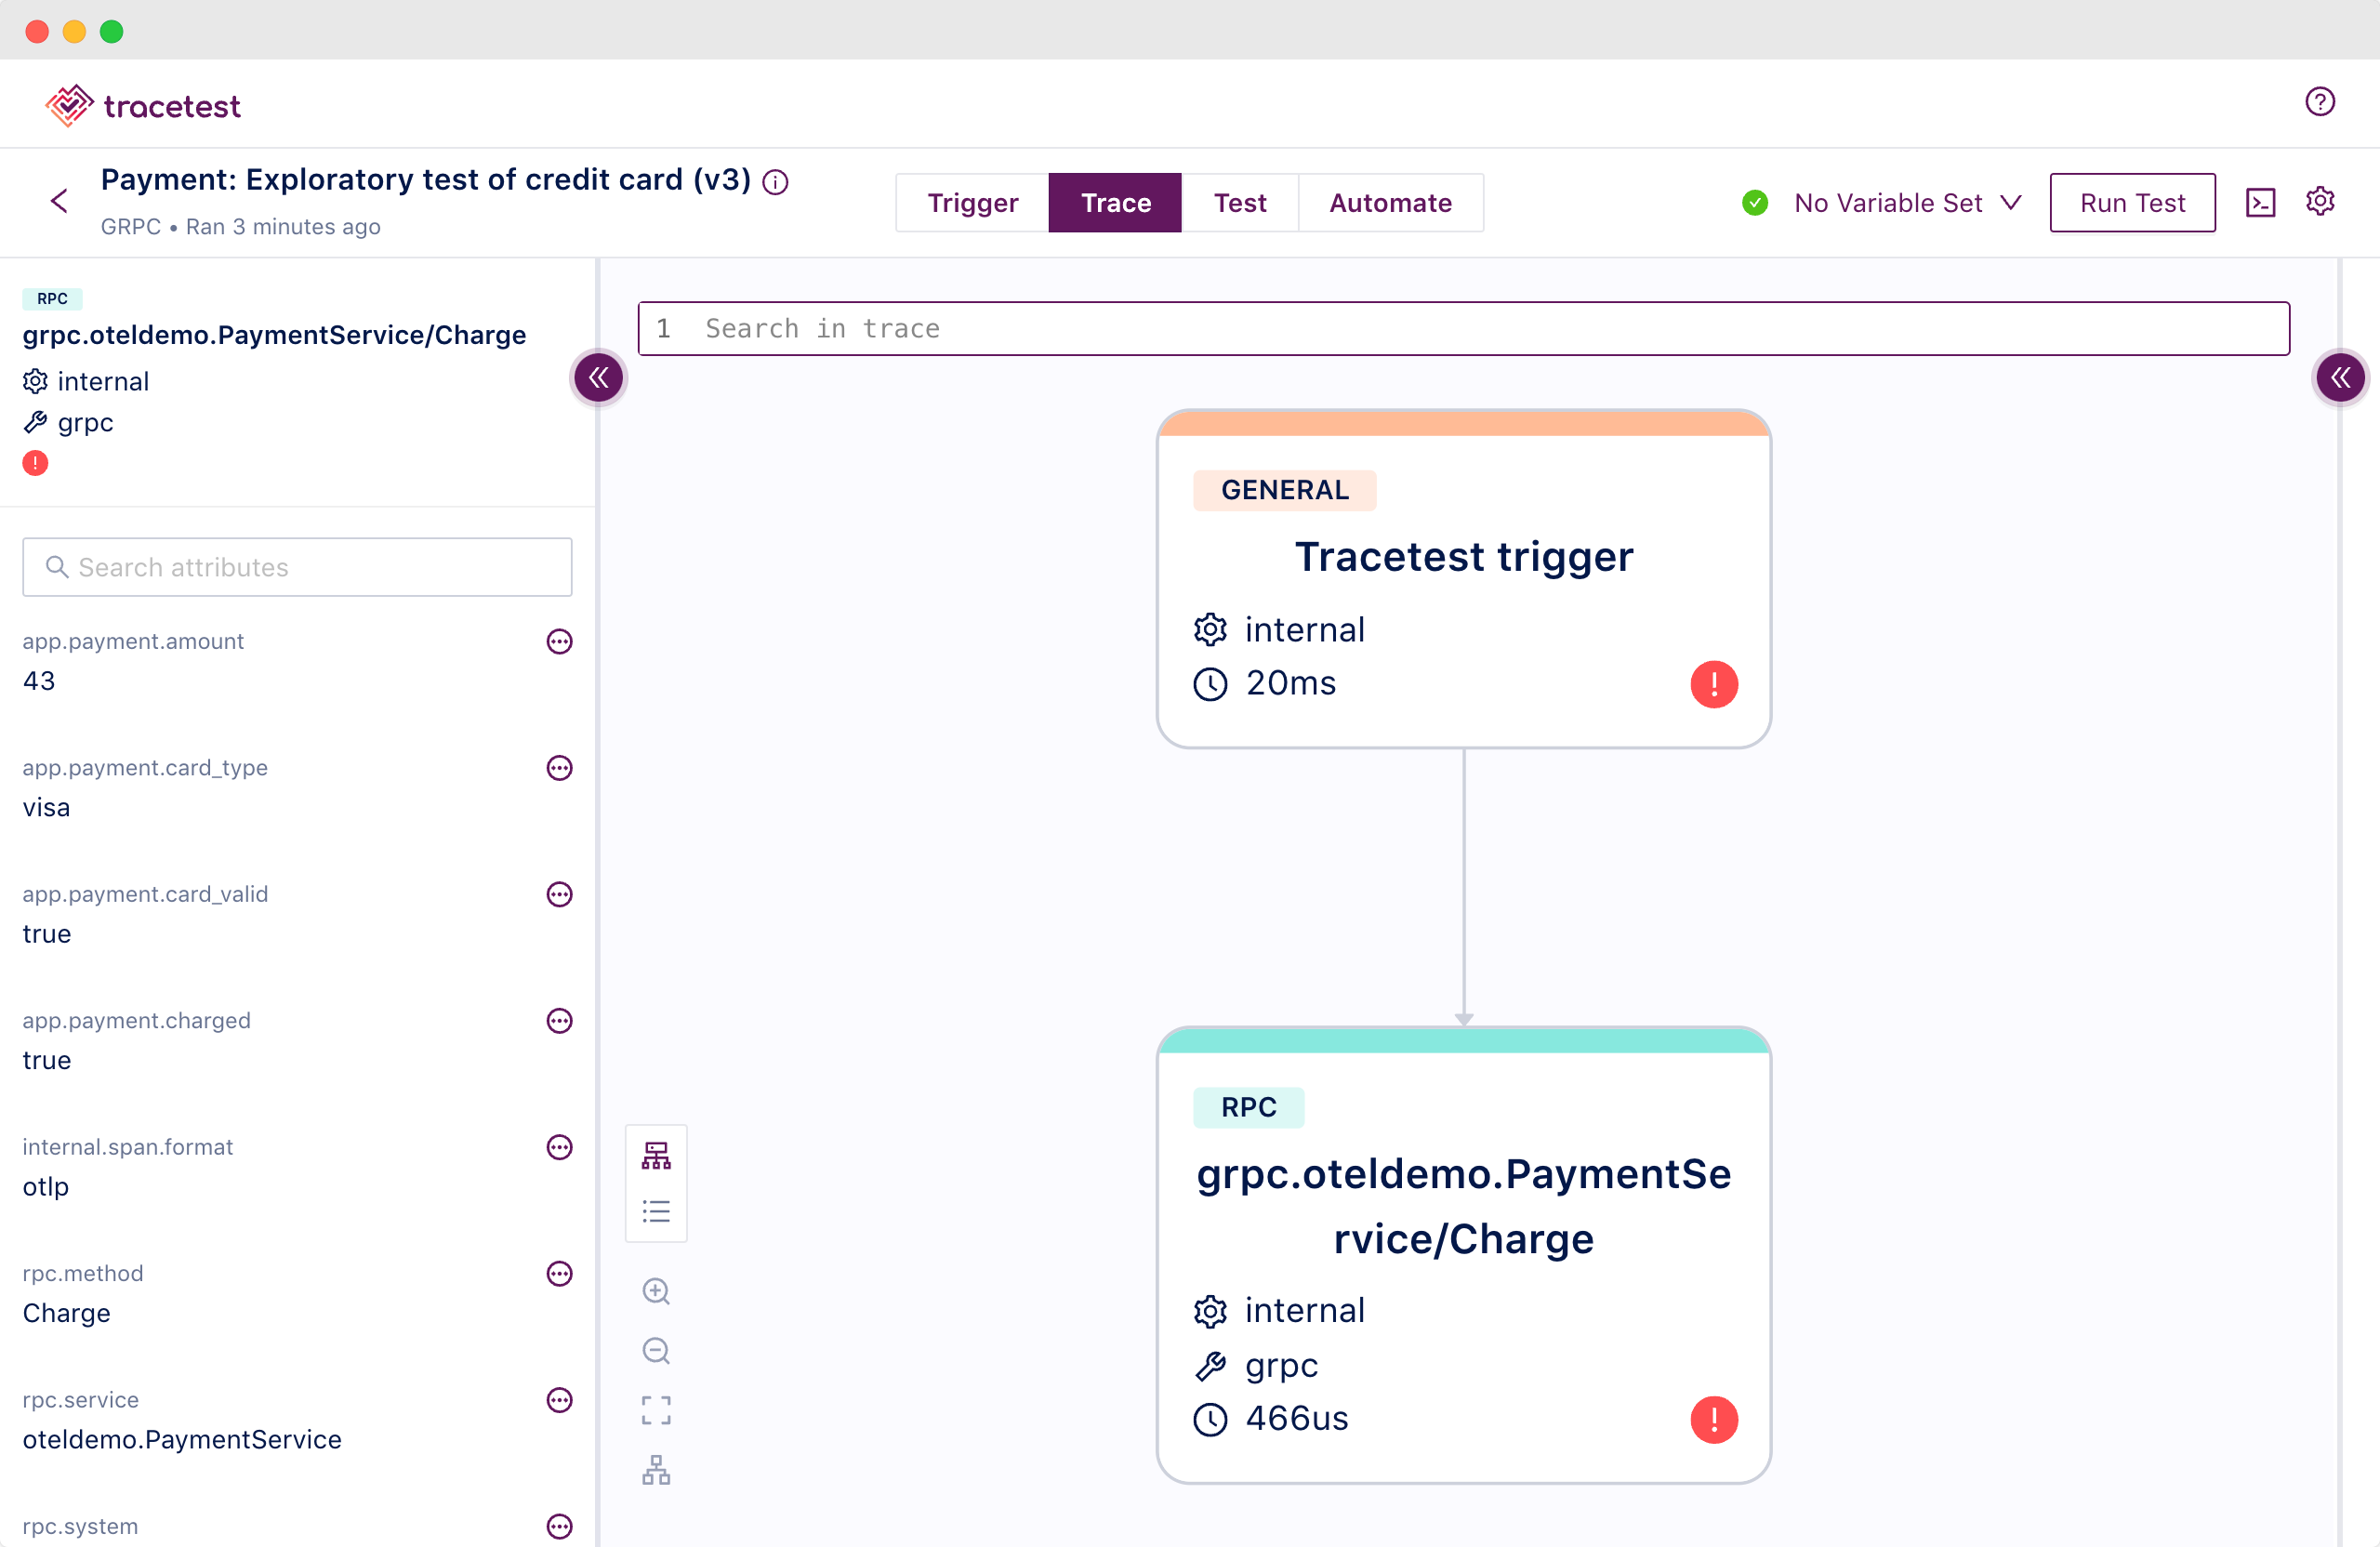
### Learning to Add a Child Span
Let’s go back to the [`src/paymentservice/index.js`](https://github.com/kubeshop/opentelemetry-demo/blob/main/src/paymentservice/index.js) and [`src/paymentservice/charge.js`](https://github.com/kubeshop/opentelemetry-demo/blob/main/src/paymentservice/charge.js).
Edit the files to use the “**2. Demo**”. You only need to change the particular lines I’ll show below. The rest of the file can stay the same.
```jsx
// src/paymentservice/index.js
// [...]
function chargeServiceHandler(call, callback) {
// [...]
const parent = trace.getActiveSpan()
const ctx = trace.setSpan(context.active(), parent)
const span = tracer.startSpan('chargeServiceHandler', undefined, ctx)
// [...]
}
// src/paymentservice/charge.js
module.exports.charge = request => {
// [...]
const parent = trace.getActiveSpan()
const ctx = trace.setSpan(context.active(), parent)
const span = tracer.startSpan('charge', undefined, ctx)
// [...]
}
```
What happens now?
With this custom instrumentation added to the Payment Service’s `index.js` and `charge.js` files, you’ll add two child spans to the `rpc` parent span.
Trigger the exploratory trace-based test once again to see what it looks like.
```bash
tracetest run test -f path-to-dir/exploratory-test.yaml
```
Now, add an assertion to validate the card is valid. You do this by selecting the `app.payment.card_valid` span and clicking “Create test spec”, and proceeding to add it visually.
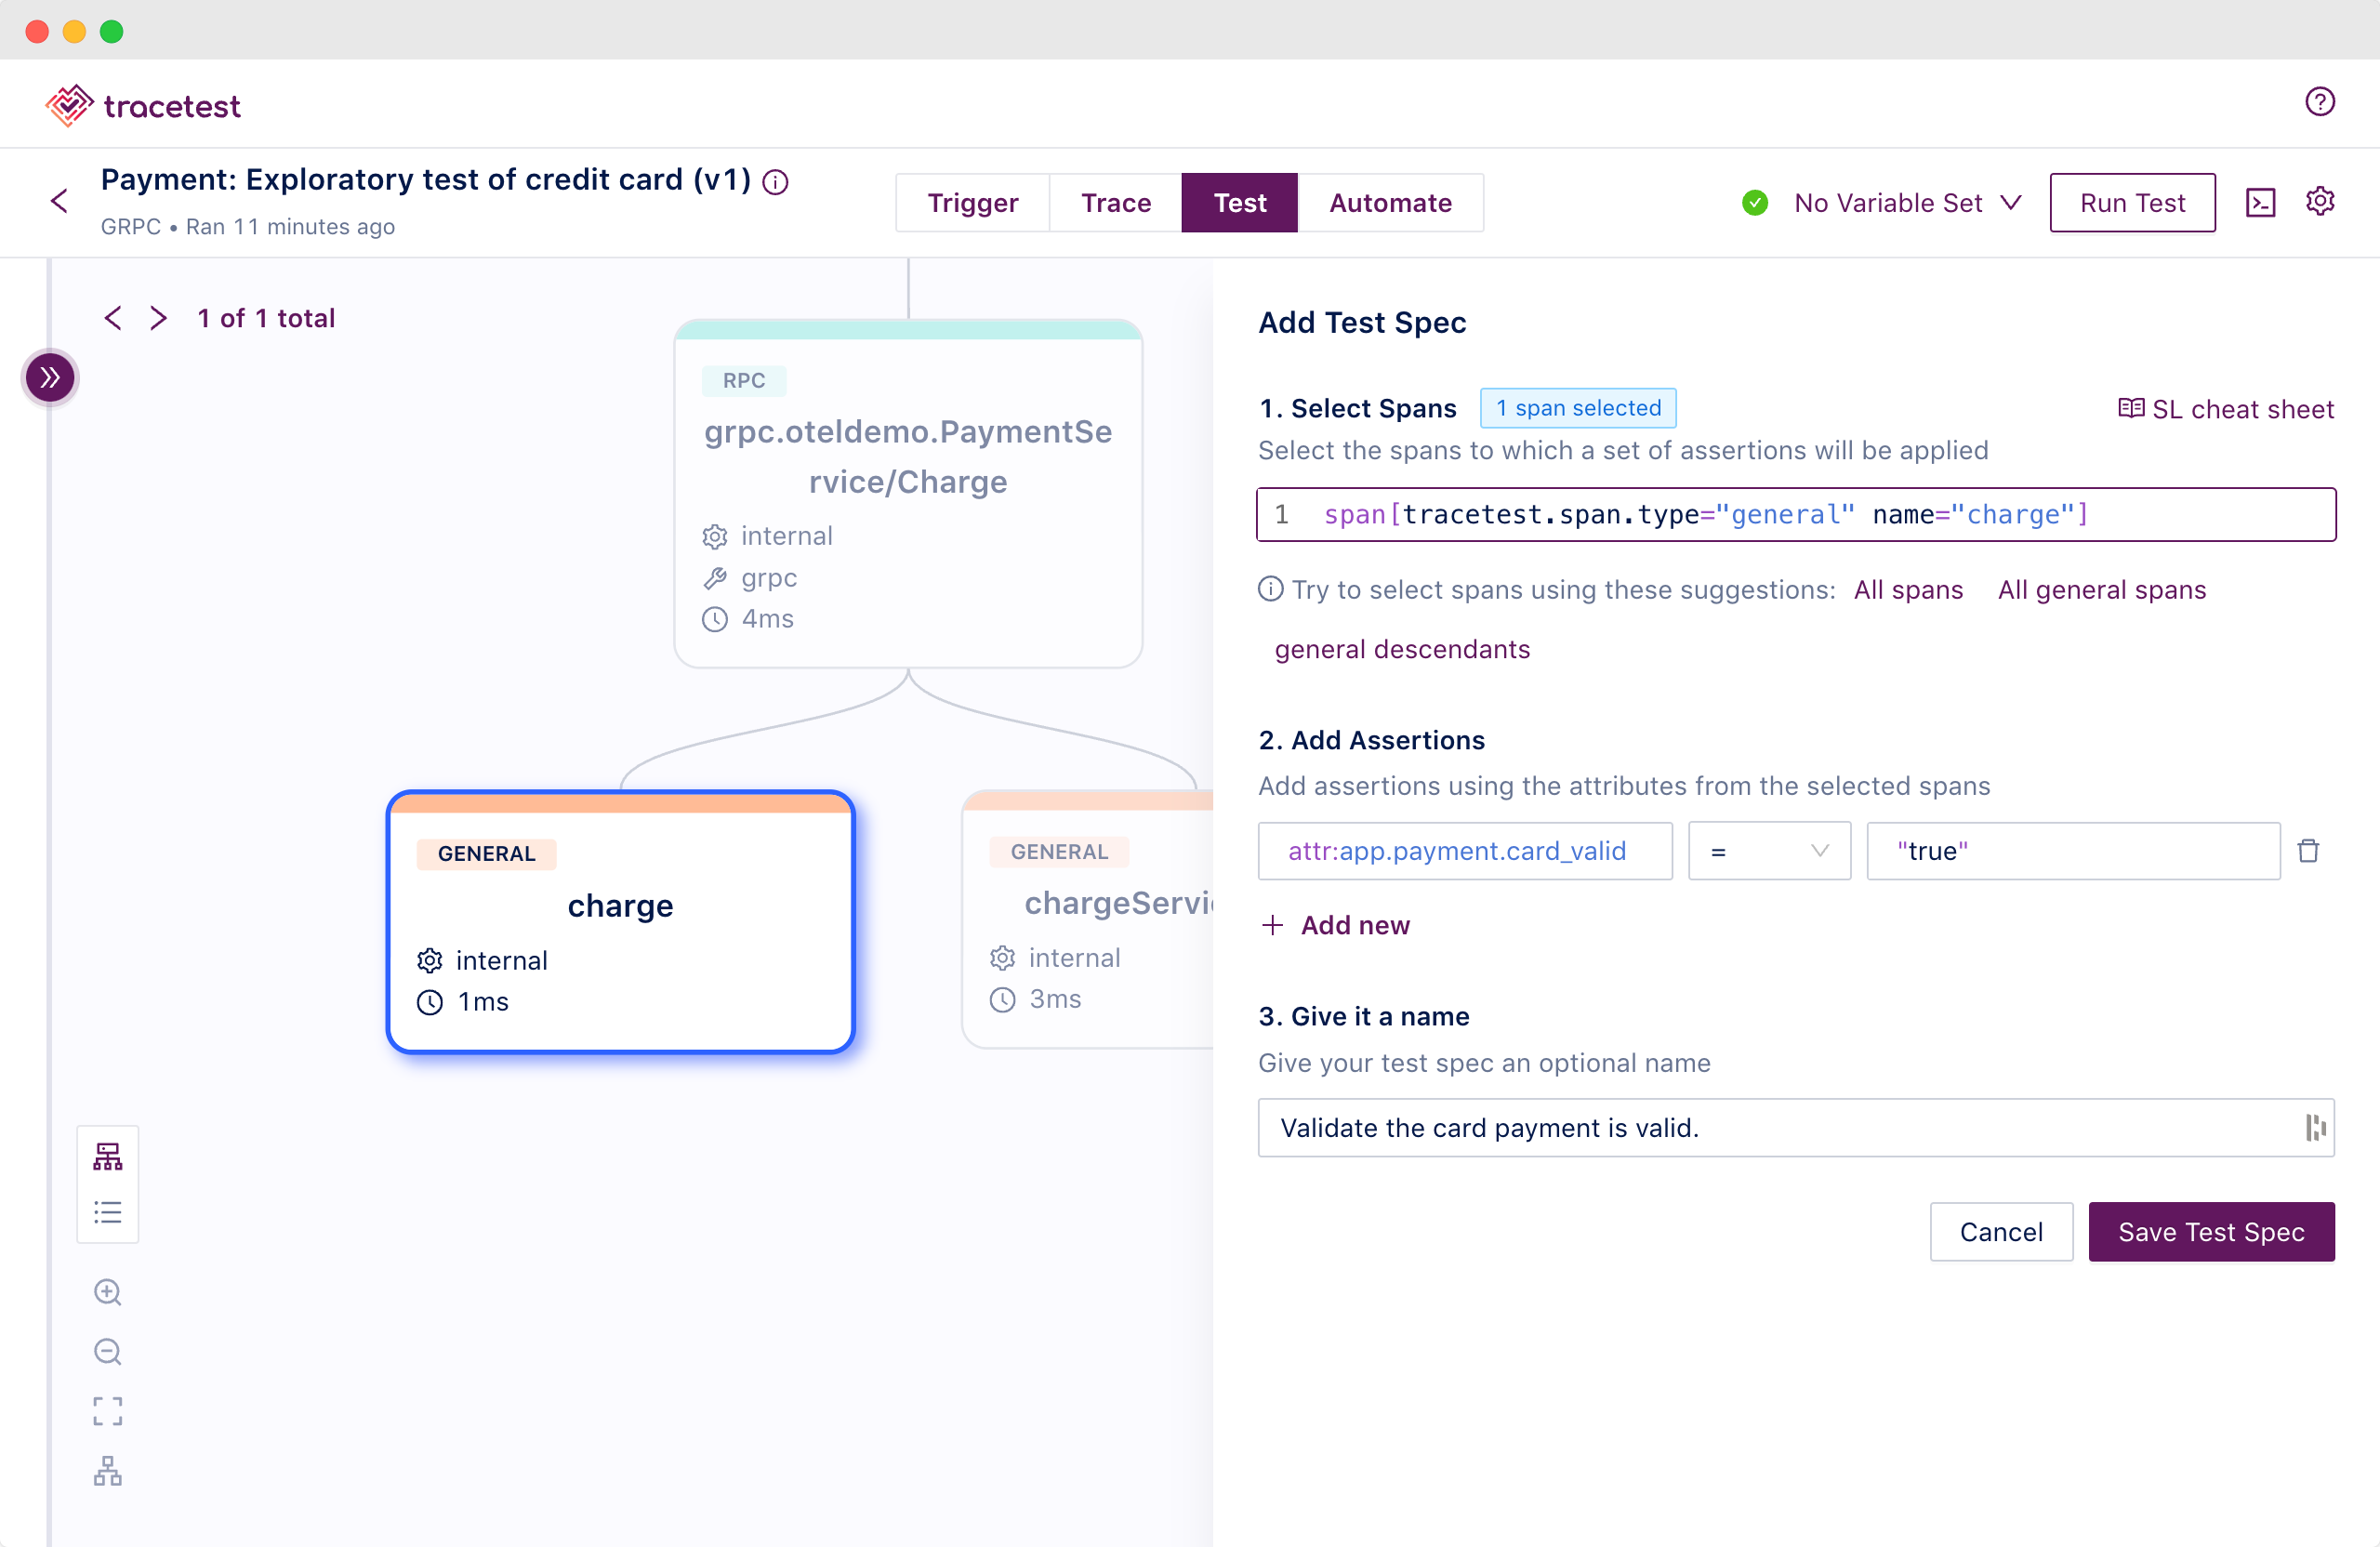
Or, add the assertion programatically to the test definition YAML file.
```yaml
specs:
- name: It should be a valid card
selector: span[tracetest.span.type="general" name="charge"]
assertions:
- attr:app.payment.card_valid = "true"
```
See [this file](https://github.com/kubeshop/opentelemetry-demo/blob/main/test/tracetesting/payment-service/valid-credit-card.yaml) for reference.
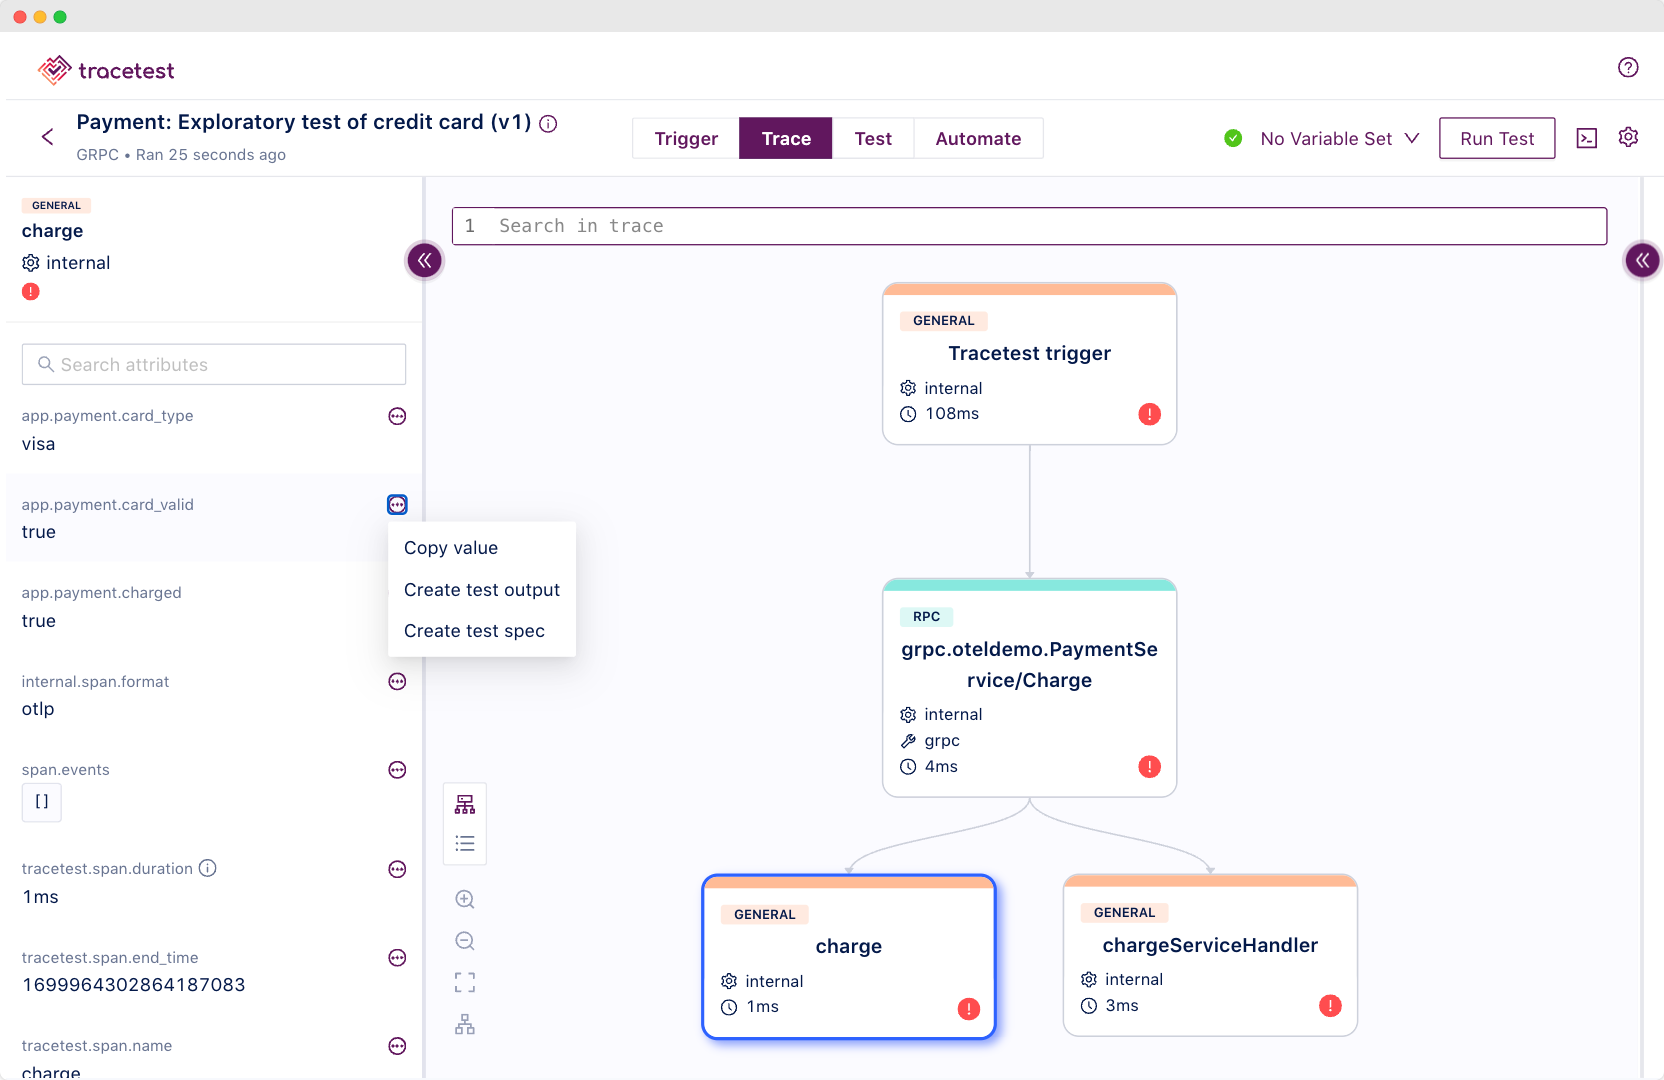
### Adding an Active Span and a Child Span
Taking it a step further, let me walk you through adding an active span and attaching the `charge` span as a child span onto it. This will clean up your distributed trace and create a nice hierarchy.
Let’s go back to the [`src/paymentservice/index.js`](https://github.com/kubeshop/opentelemetry-demo/blob/main/src/paymentservice/index.js) and [`src/paymentservice/charge.js`](https://github.com/kubeshop/opentelemetry-demo/blob/main/src/paymentservice/charge.js) one last time.
Edit the files to use the “**3. Demo**”. You only need to change the particular lines I’ll show below. The rest of the file can stay the same.
```jsx
// src/paymentservice/index.js
// [...]
function chargeServiceHandler(call, callback) {
// [...]
return tracer.startActiveSpan('chargeServiceHandler', span => {
try {
const amount = call.request.amount
span.setAttributes({
'app.payment.amount': parseFloat(`${amount.units}.${amount.nanos}`)
})
span.addEvent('Charge request received.', {
'log.severity': 'info',
'log.message': 'Charge request received.',
'request': call.request,
})
const response = charge.charge(call.request)
span.setStatus({ code: SpanStatusCode.OK })
span.end()
callback(null, response)
} catch (err) {
span.addEvent('Charge request error.', {
'log.severity': 'warn',
'log.message': 'Charge request error.',
'error': err,
})
span.recordException(err)
span.setStatus({ code: SpanStatusCode.ERROR })
span.end()
callback(err)
}
})
// [...]
}
// src/paymentservice/charge.js
module.exports.charge = request => {
// [...]
const span = tracer.startSpan('charge')
// [...]
}
```
There are two main things to remember and take away from this third demo.
- The `startActiveSpan()` method returns a Promise.
- Every `span` created with the `startSpan()` method within the `startActiveSpan()` method will be added to the active span as a child span.
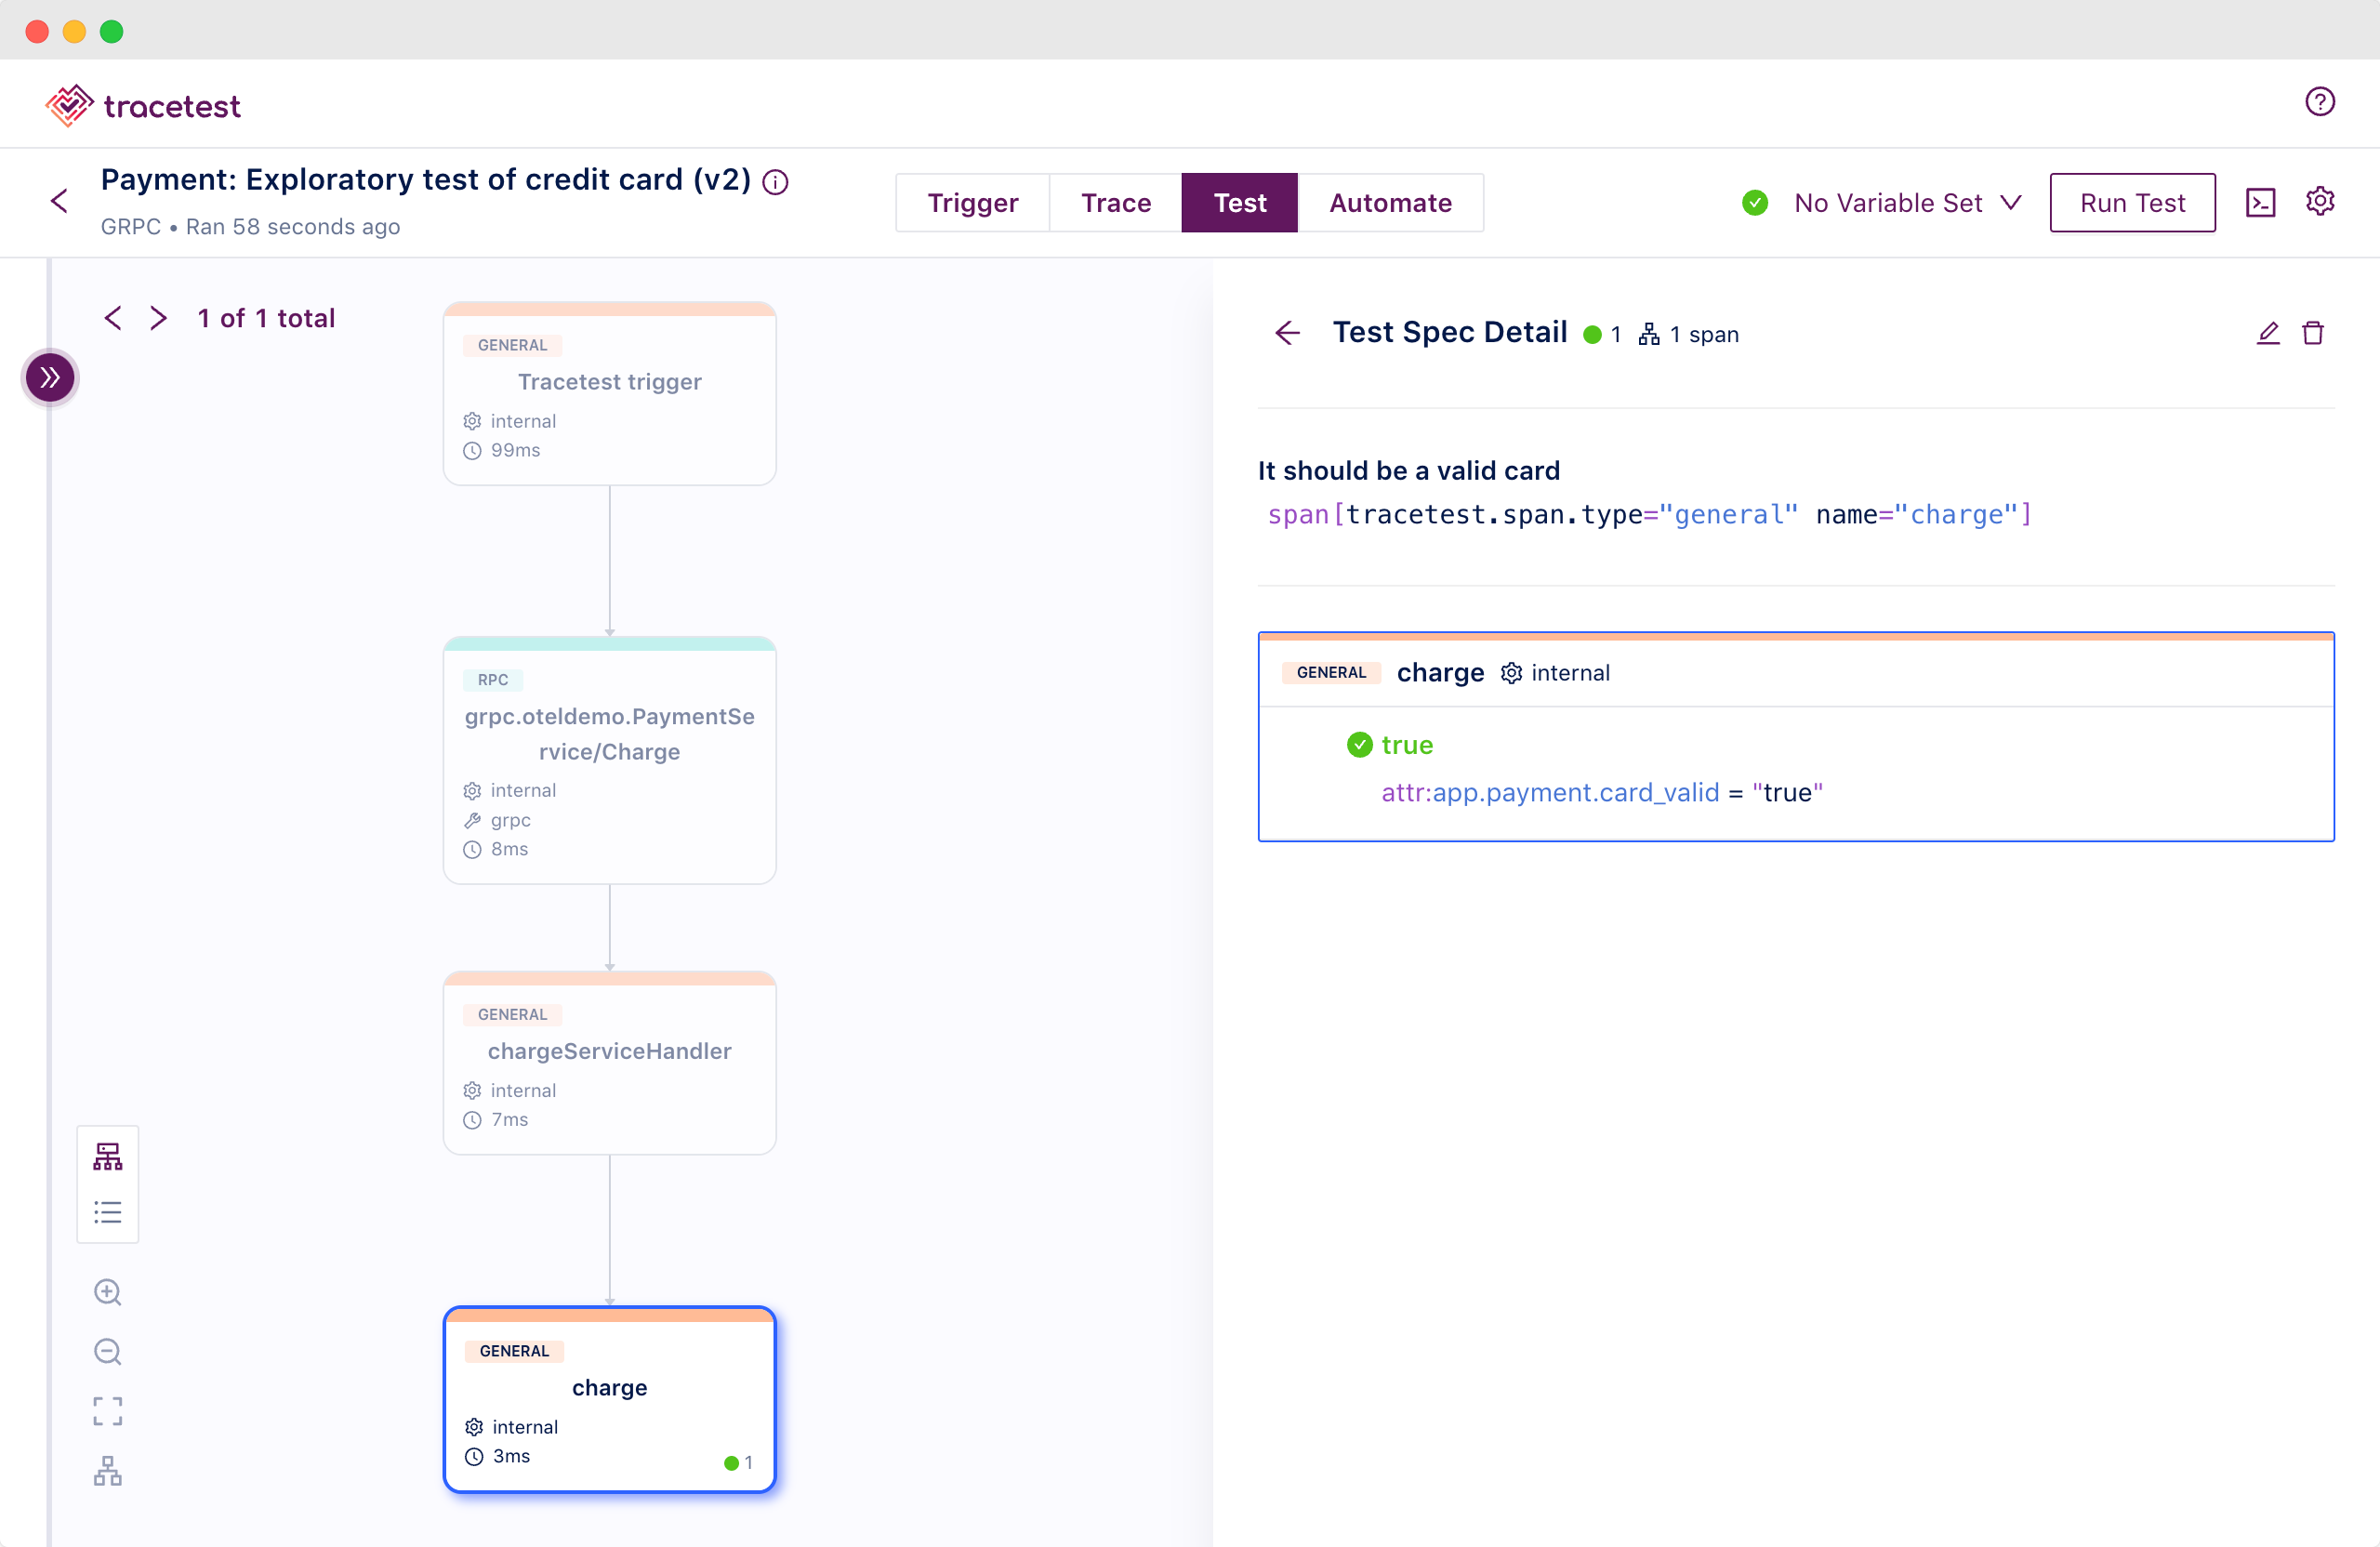
Trigger the exploratory trace-based test once again to see what it looks like. But, now you’ve included the test spec. You’ll get a test summary in the CLI and it will also be reflected in the Web UI.
```bash
tracetest run test -f path-to-dir/exploratory-test.yaml
[Output]
✔ Payment: Exploratory test of credit card (http://localhost:11633/test/payment-valid-credit-card/run/2/test) - trace id: f6d754f3f87ba5cc9da5075037ba266a
✔ It should be a valid card
```
Awesome work! With the code instrumentation configured correctly, you can move on to adding tests to cover all the edge cases of the `paymentservice`.
## Creating Trace-based Tests for the Payment Service
The 4 cases I would like you to cover are:
1. Test if a credit card is valid
2. Test if a credit card is invalid
3. Test if a credit card has expired
4. Test if a credit card is not allowed
Let’s jump in.
### Test if a Credit Card is Valid
To test the validity of a credit card you’ll add three assertions.
```yaml
# [...]
specs:
- name: It should call Charge method successfully
selector: span[tracetest.span.type="rpc" name="grpc.oteldemo.PaymentService/Charge" rpc.system="grpc" rpc.method="Charge" rpc.service="oteldemo.PaymentService"]
# instead of returning status_code 0, this service can return 1 depending on timing, but it works as intended
assertions:
# updating assertion to match 0 and 1
- attr:rpc.grpc.status_code <= 1
- name: It should return a transaction ID
selector: span[tracetest.span.type="general" name="Tracetest trigger"]
assertions:
- attr:tracetest.response.body | json_path '$.transactionId' != ""
- name: It should return a valid credit card
selector: span[tracetest.span.type="general" name="charge"]
assertions:
- attr:app.payment.card_valid = "true"
```
Since it’s a GRPC API you’ll assert on status code, the response, and finally the span attribute validating the credit card. [View the full test YAML here](https://github.com/kubeshop/opentelemetry-demo/blob/main/test/tracetesting/payment-service/valid-credit-card.yaml).
### Test if a Credit Card is Invalid
To test if a credit card is invalid you’ll add two assertions. [The `charge.js` file has a validity check](https://github.com/kubeshop/opentelemetry-demo/blob/e135e81702e096ae511625a2c414e29401080633/src/paymentservice/charge.js#L59) that throws an error with the `"Credit card info is invalid."` message.
```jsx
// charge.js
if (!valid) {
throw new Error('Credit card info is invalid.')
}
```
The first assertion will look to validate that error message. The second assertion will check for the response status error code.
```yaml
# [...]
specs:
- name: It should call Charge method and receive a gRPC error
selector: span[tracetest.span.type="rpc" name="grpc.oteldemo.PaymentService/Charge" rpc.system="grpc" rpc.method="Charge" rpc.service="oteldemo.PaymentService"]
assertions:
- attr:grpc.error_message = "Credit card info is invalid."
- name: It should return a return an gRPC error code to the caller
selector: span[tracetest.span.type="general" name="Tracetest trigger"]
assertions:
- attr:tracetest.response.status = 2
```
[View the full test YAML here.](https://github.com/kubeshop/opentelemetry-demo/blob/main/test/tracetesting/payment-service/invalid-credit-card.yaml)
### Test if a Credit Card has Expired
To test if a credit card has expired you’ll add two assertions. [Just like the invalid error, the `charge.js` file has an expiration check](https://github.com/kubeshop/opentelemetry-demo/blob/e135e81702e096ae511625a2c414e29401080633/src/paymentservice/charge.js#L59) that throws an error with the `"The credit card (ending ${lastFourDigits}) expired on ${month}/${year}."` message.
```jsx
// charge.js
if ((currentYear * 12 + currentMonth) > (year * 12 + month)) {
throw new Error(`The credit card (ending ${lastFourDigits}) expired on ${month}/${year}.`)
}
```
The first assertion will look to validate that error message. The second assertion will check for the response status error code.
```yaml
# [...]
specs:
- name: It should call Charge method and receive a gRPC error
selector: span[tracetest.span.type="rpc" name="grpc.oteldemo.PaymentService/Charge" rpc.system="grpc" rpc.method="Charge" rpc.service="oteldemo.PaymentService"]
assertions:
- attr:grpc.error_message = "The credit card (ending 0454) expired on 1/2021."
- name: It should return a return an gRPC error code to the caller
selector: span[tracetest.span.type="general" name="Tracetest trigger"]
assertions:
- attr:tracetest.response.status = 2
```
[View the full test YAML here.](https://github.com/kubeshop/opentelemetry-demo/blob/main/test/tracetesting/payment-service/expired-credit-card.yaml)
### Test if a Credit Card is Not Allowed
[The `charge.js` has a validity check to make sure only Visa and Mastercard credit cards are allowed](https://github.com/kubeshop/opentelemetry-demo/blob/e135e81702e096ae511625a2c414e29401080633/src/paymentservice/charge.js#L62-L64). It will throw an error the message `"Sorry, we cannot process ${cardType} credit cards. Only VISA or MasterCard is accepted."`.
```jsx
if (!['visa', 'mastercard'].includes(cardType)) {
throw new Error(`Sorry, we cannot process ${cardType} credit cards. Only VISA or MasterCard is accepted.`)
}
```
The first assertion will look to validate that error message. The second assertion will check for the response status error code.
```yaml
specs:
- name: It should call Charge method and receive a gRPC error
selector: span[tracetest.span.type="rpc" name="grpc.oteldemo.PaymentService/Charge" rpc.system="grpc" rpc.method="Charge" rpc.service="oteldemo.PaymentService"]
assertions:
- attr:grpc.error_message = "Sorry, we cannot process amex credit cards. Only VISA or MasterCard is accepted."
- name: It should return a return an gRPC error code to the caller
selector: span[tracetest.span.type="general" name="Tracetest trigger"]
assertions:
- attr:tracetest.response.status = 2
```
[View the full test YAML here.](https://github.com/kubeshop/opentelemetry-demo/blob/main/test/tracetesting/payment-service/amex-credit-card-not-allowed.yaml)
## What you learned about contributing to OpenTelemetry
Today you learned three main things.
1. How to demystify OpenTelemetry by adding automatic and manual code instrumentation.
2. How to use trace-based testing in the OpenTelemetry Demo to maintain feature functionality and telemetry integrity.
3. How to contribute to the OpenTelemetry Demo safely while avoiding regressions.
Now you can clearly understand OpenTelemetry, writing code instrumentation, and incorporating traces into trace-based tests. You're better prepared to contribute meaningful additions to the OpenTelemetry project and validate your contributions with trace-based testing.
To learn more about Tracetest and what it can help you achieve, check the [docs](https://docs.tracetest.io/getting-started/installation) and try it out today by [signing up](https://app.tracetest.io/) for free!
Also, please feel free to join our [Slack community](https://dub.sh/tracetest-community), give [Tracetest a star on GitHub](https://github.com/kubeshop/tracetest), or schedule a [time to chat 1:1](https://calendly.com/ken-kubeshop/45min).
.jpg)
.avif)
.avif)