Test-driven & observability-driven development: the difference


Observability-driven development (ODD) emphasizes using instrumentation in back-end code as assertions. Tracetest empowers this with your distributed traces.
Table of Contents
### Here’s a problem you keep facing
You have no way of knowing **precisely** at which point, in the complex network of microservice-to-microservice communications, a single HTTP transaction goes wrong! With tracing, your organization is generating and storing tons of trace data without getting value from it in the form of consistent tests.
### Here’s how you solve it.
We’re entering a new era of **observability-driven development** (ODD), which emphasizes using instrumentation in back-end code as assertions in tests. We now have a culture of **trace-based testing**. With a tool like Tracetest, back-end developers are not just generating E2E tests from OpenTelemetry-based traces, but changing the way we enforce quality—and encourage velocity—in even the most complex apps.
That’s exactly what we’ll demo in this tutorial. Once we’re done, you’ll learn how to instrument your code and run trace-based tests yourself.
You can find the complete [source code on GitHub](https://github.com/kubeshop/tracetest/tree/main/examples/quick-start-nodejs).
## The present: test-driven development
Test-driven development (TDD) is a software development process where developers create test cases before code to enforce the requirements of the application.
In contrast, traditional testing methods meant first writing code based around your software requirements, then writing integration or E2E tests to verify whether the code you wrote works in all cases.
With TDD, the software development cycle changes dramatically, so that once your team has agreed on those requirements, you then:
1. Add a test that passes if, and only if, those requirements are met.
2. Run the test and see a failure, as expected.
3. Write the *simplest* code that passes the test.
4. Run the test again and see a `pass` result.
5. Refactor your code as needed to improve efficiency, remove duplicate code, splitting code into smaller pieces, and more.
TDD has found a ton of fans in recent years, as it can significantly reduce the rate of bugs and, generally speaking, can improve the technical quality of an organization’s code. But, given the complexity of modern infrastructure, including the proliferation of cloud native technology and microservices, TDD ends up failing to meet backend developers halfway.
### The pain of creating and running TDD-based tests on the back end
Running back-end integration tests requires access and visibility into your larger infrastructure—unlike front-end integration tests, they don’t operate in the isolated environment of a browser.
You have to not only design a trigger, but also access your database, which requires some method of authentication. Or, if your infrastructure has a message bus, you need to configure the way in which your test monitors that and gathers the relevant logs.
If your infrastructure heavily leverages resources like serverless functions or API gateways, you’re in for an even bigger challenge, as those are ephemeral and isolated by default. How do you gather logs from a Lambda that no longer exists?
If you're running E2E tests, it can create scenarios where you can see that your CI/CD pipeline has failed, but not *where* or *why* the failure occurred in the first place. It can often make you go down the rabbit hole looking for answers. Particularly if you are running tests against microservices.
If you can’t determine whether a failure happened between microservice A and B, or Y and Z, then your tests cases aren’t useful tools to guide how you develop your code—they’re mysterious blockers you’re blindly trying to develop around.
### How back-end tests are added in a TDD environment
We’ll use a Node.js project as a simple example to show the complexity of integration and E2E testing in distributed environments.
To simply stand up the testing tools, you need to add multiple new libraries, like [Mocha](https://mochajs.org/), [Chai](https://www.chaijs.com/), and [Chai HTTP](https://www.chaijs.com/plugins/chai-http/), to your codebase. You then need to generate mock data, which you store within your repository, for your tests to utilize. That means creating more new testing-related folders and files in your Git repository, muddying up what’s probably already a complicated landscape.
And then, to add even a *single* test, you need to add a decent chunk of code:
```jsx
const chai = require('chai');
const chaiHttp = require('chai-http');
chai.use(chaiHttp);
const app = require('../server');
const should = chai.should();
const expect = chai.expect;
const starwarsFilmListMock = require('../mocks/starwars/film_list.json');
describe('GET /people/:id', () => {
it('should return people information for Luke Skywalker when called', done => {
const peopleId = '1';
chai
request(app)
.get('/people/' + peopleId)
.end((err, res) => {
res.should.have.status(200);
expect(res.body).to.deep.equal(starwarsLukeSkywalkerPeopleMock);
done();
});
});
});
```
From here on out, you’re hand-coding dozens or hundreds more tests, using the exact same fragile syntax, to get the coverage TDD demands.
## The future: observability-driven development with Tracetest
ODD is the practice of developing software and the associated observability instrumentation in parallel. As you deploy back-end services, you can immediately observe the behavior of the system over time to learn more about its weaknesses, guiding where you take your development next. You’re still developing toward an agreed-upon set of software requirements, but instead of spending time artificially covering every possible fault, you’re ensuring that you’ll have full visibility into those faults *in your production environment*.
That’s how you uncover and fix the dangerous “unknown unknowns” of software development—the failure points you could have never known to create tests for in the first place.
At the core of ODD is **[distributed tracing](https://tracetest.io/blog/tracing-the-history-of-distributed-tracing-opentelemetry)**, which records the paths taken by an HTTP request as it propagates through the applications and APIs you have running on your cloud native infrastructure. Each operation in a trace is represented as a span, to which you can add assertions—testable values to determine if the span succeeds or fails. Unlike traditional API tools, trace-based testing asserts against the system response *and* the trace results.
The benefits of leveraging the distributed trace for ODD are enormous, helping you and your team:
- Understand the entire lifecycle of an HTTP request as it propagates through your distributed infrastructure, whether it succeeds, or exactly where it fails.
- Track down new problems, or create new tests, with no prior knowledge of the system and without shipping any new code.
- Resolve performance issues at the code level.
- Run trace-based tests directly in production.
- Discover and troubleshoot the “unknown unknowns” in your system that might have slipped past even a sophisticated TDD process.
### How can you add OpenTelemetry instrumentation to your back end code?
A platform like Tracetest integrates with a handful of trace data stores like Jaeger, Grafana Tempo, Opensearch, and SignalFX. The shortest path to adding distributed traces is adding the language-specific OpenTelemetry SDK to your codebase. Popular languages also have [auto-instrumentation](https://opentelemetry.io/docs/instrumentation/js/getting-started/nodejs/#instrumentation-modules), like in the Node.js example we’ll create below.
*💡 If you already have a trace data store, like Jaeger, Grafana Tempo, Opensearch, or SignalFX, we have plenty of [detailed docs](https://docs.tracetest.io/configuration/overview/) to help you connect Tracetest to your instance quickly.*
For example, here’s how we add tracing to an example [Node.js/Express-based project](https://github.com/kubeshop/tracetest/blob/main/examples/quick-start-nodejs/tracing.otel.http.js) in just a few lines of code:
```jsx
const opentelemetry = require('@opentelemetry/sdk-node')
const { getNodeAutoInstrumentations } = require('@opentelemetry/auto-instrumentations-node')
const { OTLPTraceExporter } = require('@opentelemetry/exporter-trace-otlp-http')
const sdk = new opentelemetry.NodeSDK({
traceExporter: new OTLPTraceExporter({ url: 'http://otel-collector:4318/v1/traces' }),
instrumentations: [getNodeAutoInstrumentations()],
})
sdk.start()
```
This code acts as a wrapper around the rest of your application, running a tracer and sending traces to the OpenTelemetry [collector](https://opentelemetry.io/docs/collector/), which in turn passes them on to Tracetest. This requires a few additional [services and configurations](https://github.com/kubeshop/tracetest/tree/main/examples/quick-start-nodejs/tracetest), but we can package everything into two Docker Compose files to launch and run the entire ecosystem.
Find this example [Node.js/Express-based project](https://github.com/kubeshop/tracetest/blob/main/examples/quick-start-nodejs/tracing.otel.http.js) project, and examples of integrating with other trace data stores, in the [Tracetest repository](https://github.com/kubeshop/tracetest/tree/main/examples) on GitHub.
To quickly access the example you can run the following:
```jsx
git clone https://github.com/kubeshop/tracetest.git
cd tracetest/examples/quick-start-nodejs/
docker-compose -f docker-compose.yaml -f tracetest/docker-compose.yaml up --build
```
### Start practicing ODD with Tracetest
Now that you’ve seen how easily Tracetest integrates with the trace data store you already have, you’re probably eager to build tests around your traces, set assertions, and start putting observability-driven development into practice.
Installing the Tracetest CLI takes a single step on a macOS system:
```
brew install kubeshop/tracetest/tracetest
```
Note: Check out the download page for more info.
From here, we recommend following the official [documentation to install the Tracetest CLI+server](https://docs.tracetest.io/getting-started/installation/), which will help you configure your trace data source and generate all the configuration files you need to collect traces and build new tests.
For a more elaborate explanation, refer to our [docs](https://docs.tracetest.io/getting-started/detailed-installation). You can also read more about connecting Tracetest to the [OpenTelemetry Collector](https://docs.tracetest.io/configuration/overview).
Once you have Tracetest set up, open `http://localhost:11633` in your browser to check out the web UI.
### Create tests visually
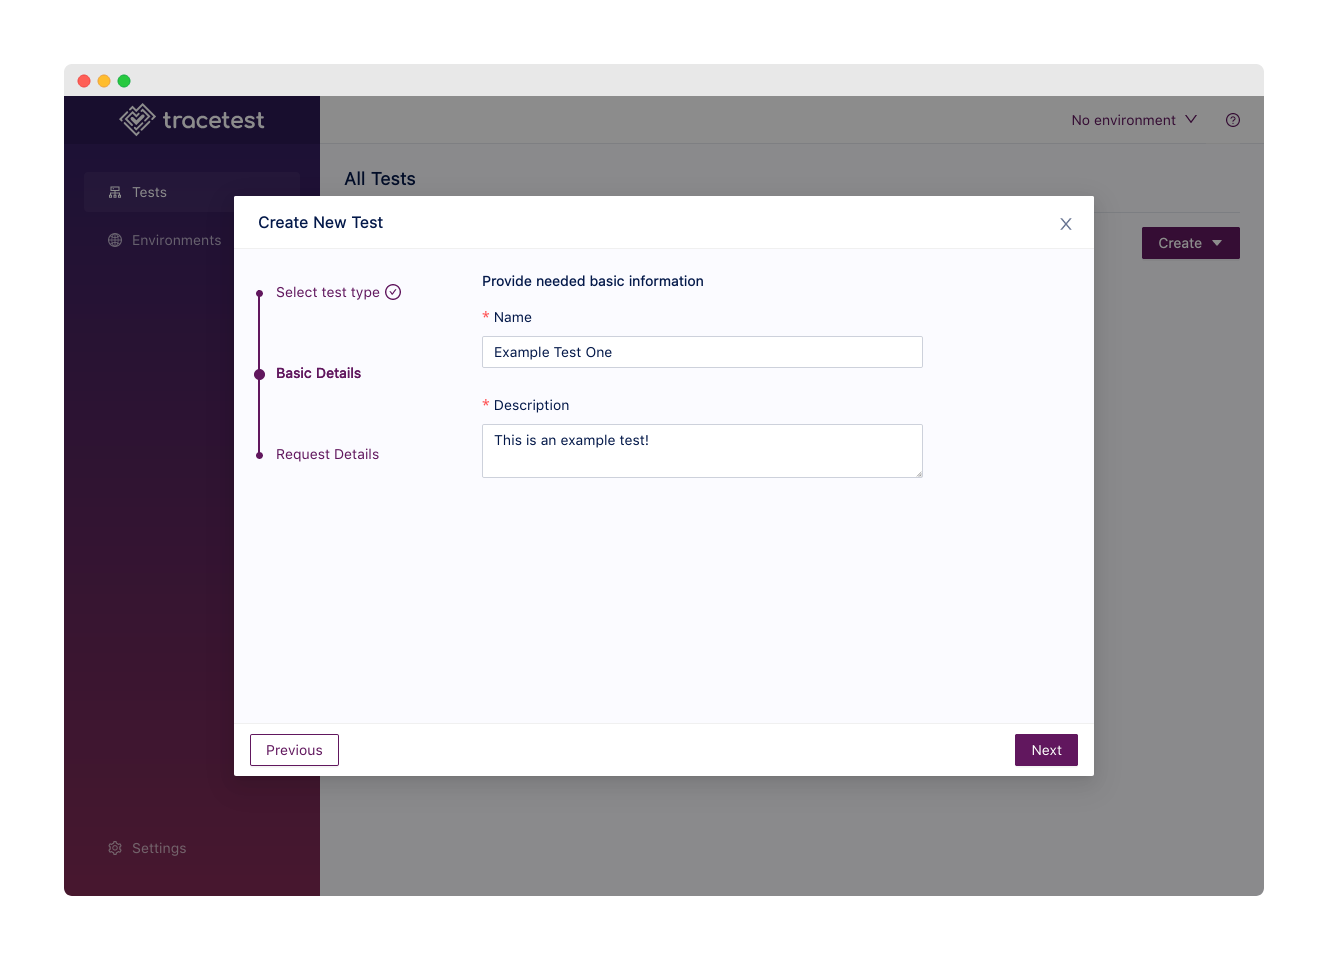
In the Tracetest UI, click the **Create** dropdown and choose **Create New Test**. We’ll make an HTTP Request here, so you can click **Next** to give your test a name and description.
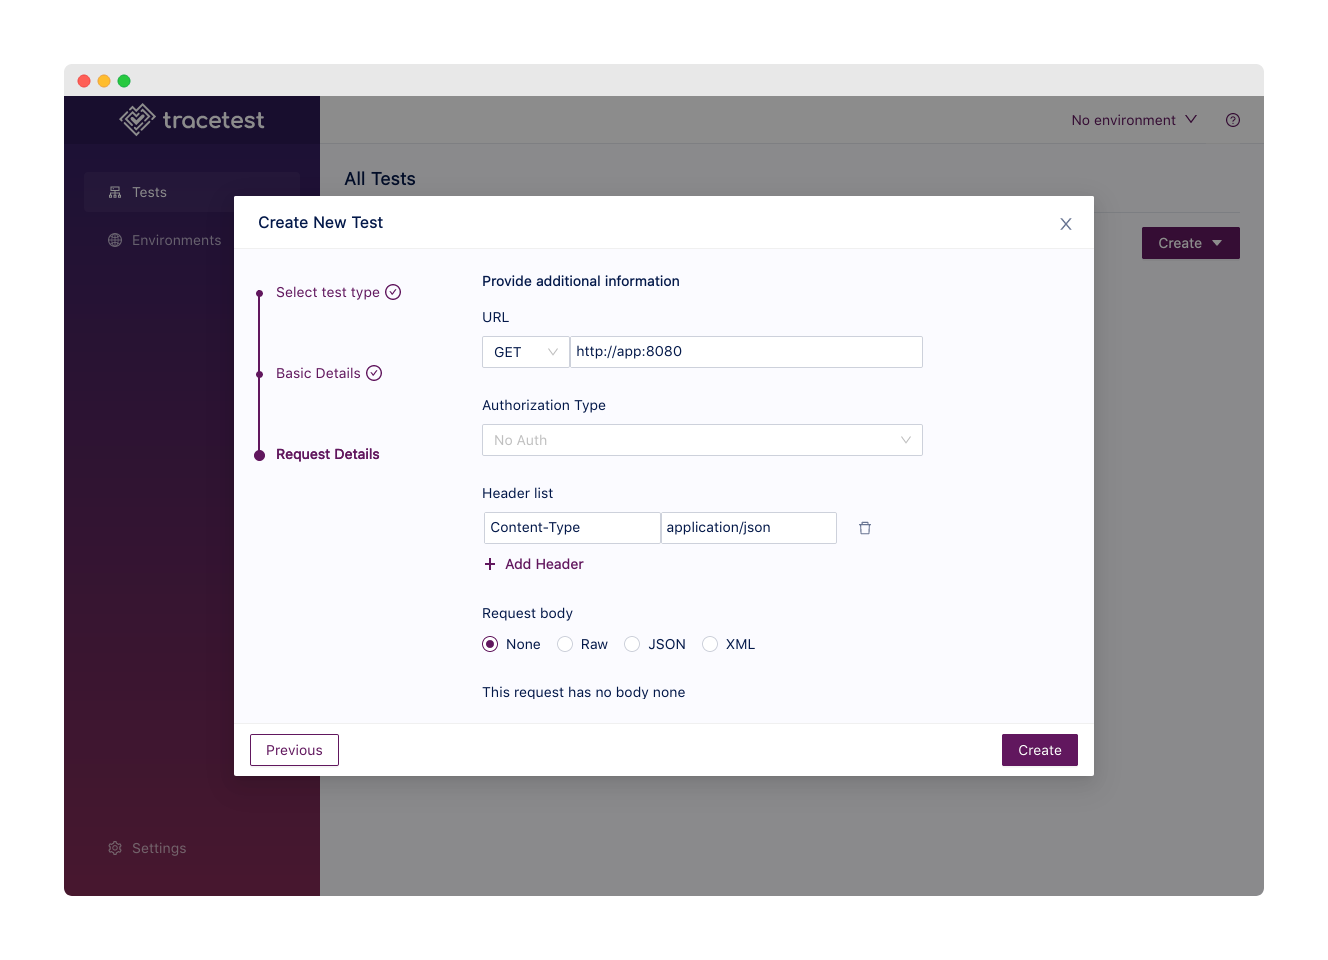
For this simple example, you’ll just `GET` your app, which runs at `http://app:8080`.
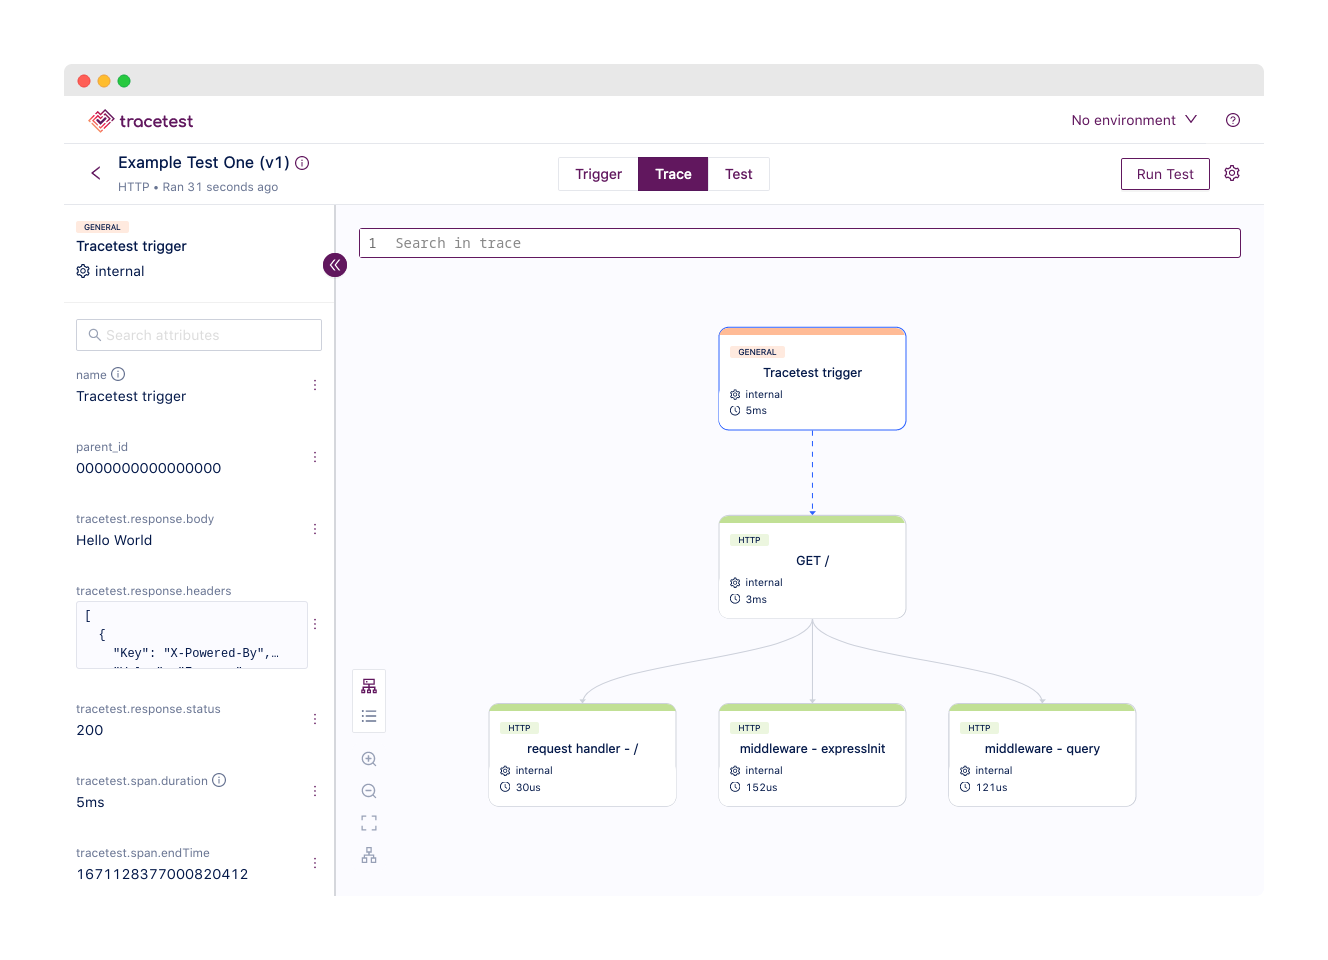
With the test created, you can click the **Trace** tab to showcase your distributed trace as it passes through your app. In the example, this is pretty simplistic, but you can start to see how it delivers immediate visibility into every transaction your HTTP request generates.
### Set assertions against every single point in the HTTP transaction
Click the **Test** tab, then **Add Test Spec**, to start setting assertions, which form the backbone of how you implement ODD and track the overall quality of your application in various environments.
To make an assertion based on the `GET /` span of our trace, select that span in the graph view and click **Current span** in the Test Spec modal. Or, copy this span selector directly, using the [Tracetest Selector Language](https://docs.tracetest.io/concepts/selectors/):
```jsx
span[tracetest.span.type="http" name="GET /" http.target="/" http.method="GET"]
```
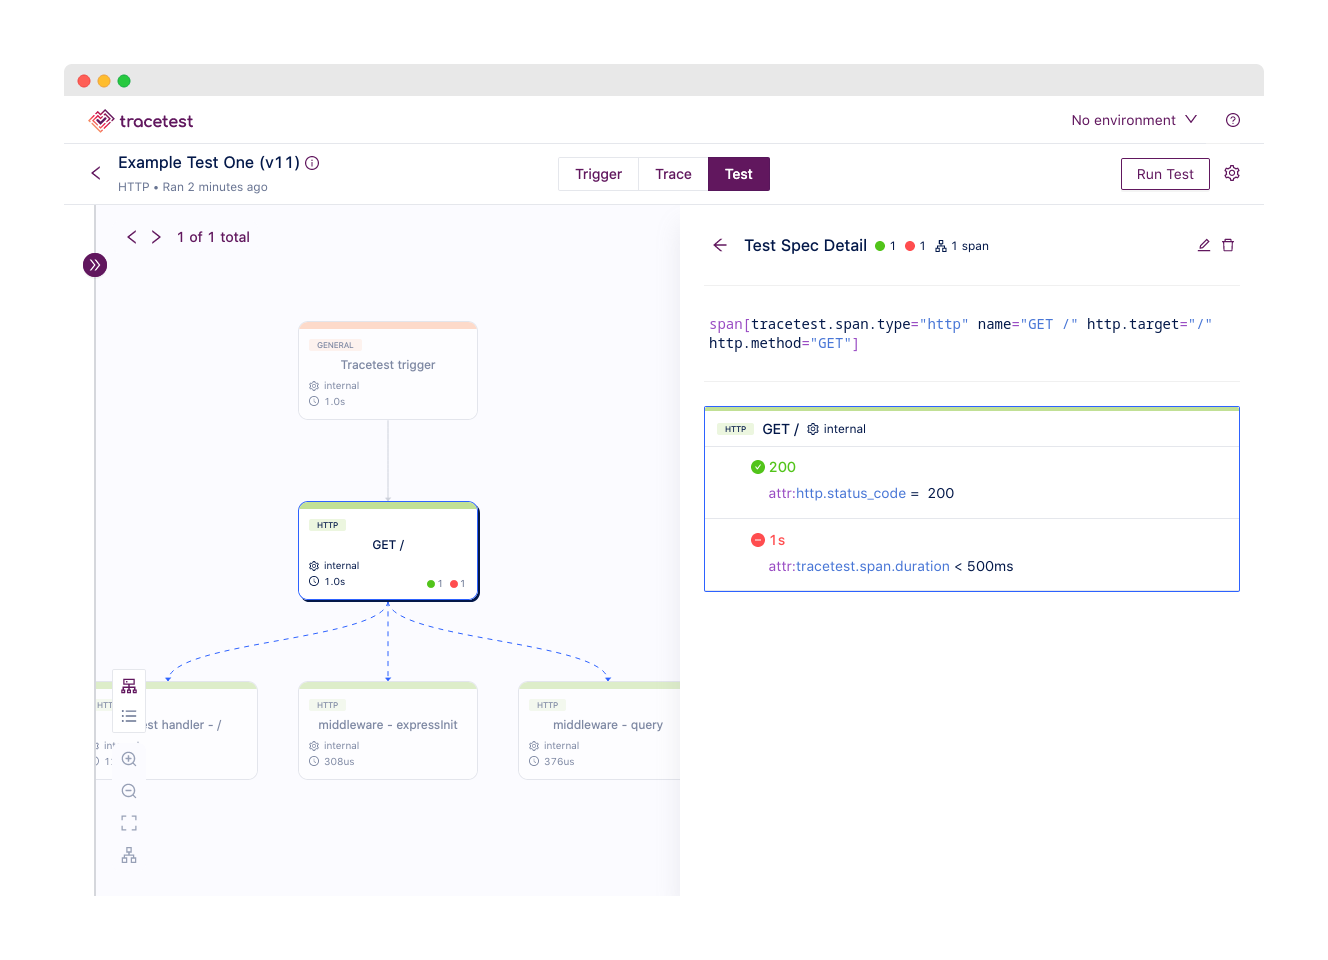
Below, add the `attr:http.status_code` attribute and the expected value, which is `200`. You can add more complex assertions as well, like testing whether the span executes in less than 500ms. Add a new assertion for `attr:http.status_code`, choose `<`, and add `500ms` as the expected value.
You can check against other properties, return statuses, timing, and much more, but we’ll keep it simple for now.
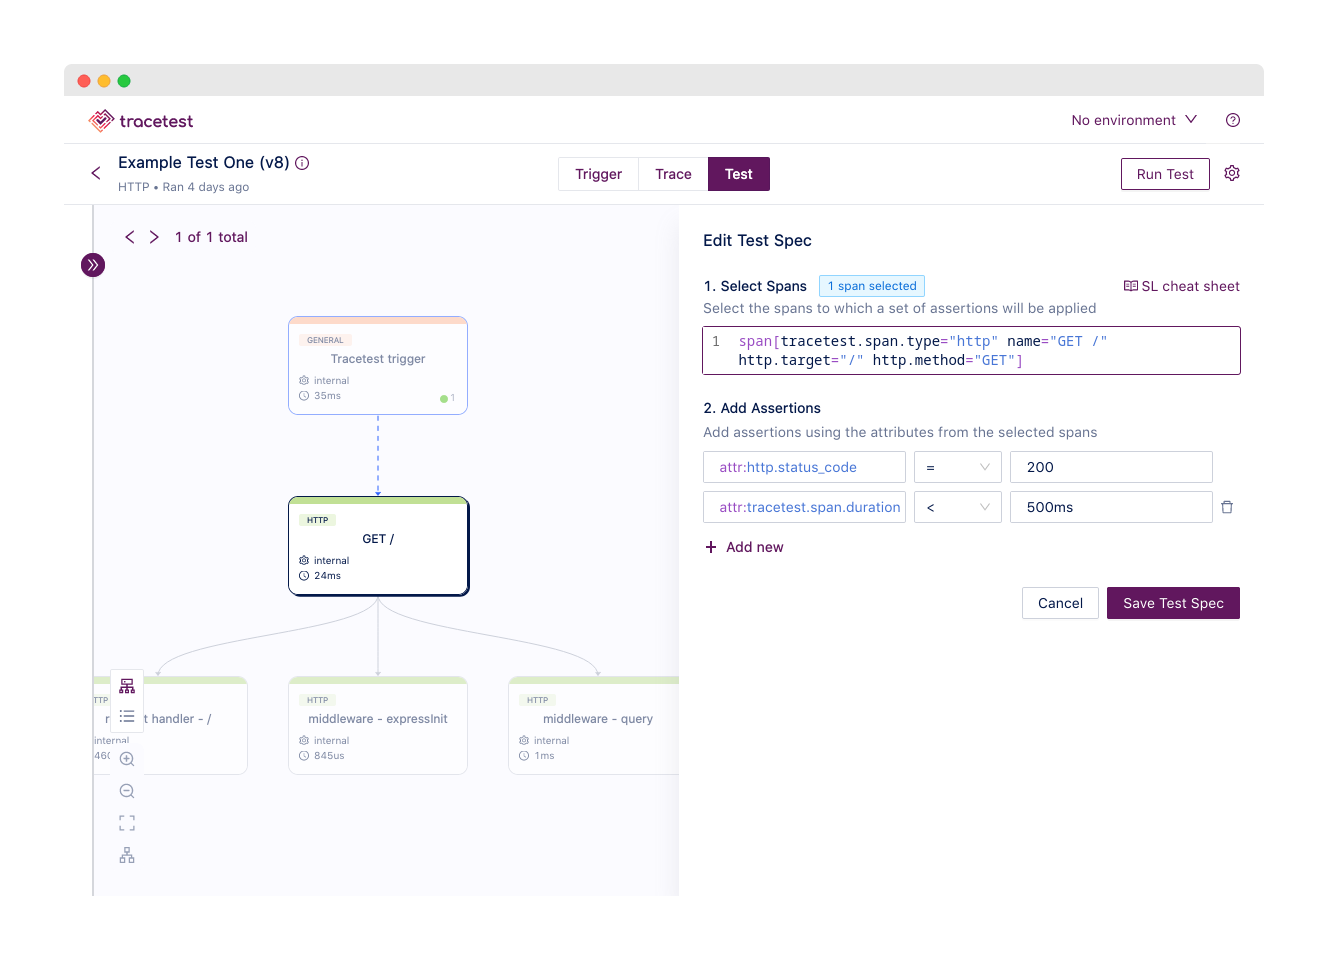
Then click **Save Test Spec**, followed by **Publish**, and you’ve created your first assertion.
### Generate the YAML for a test in Tracetest
Once you have a test spec, click the gear icon next to **Run Test**, then **Test Definition**, which opens a modal window where you can view and download the `.yaml` file you’ll need to run this test using the [Tracetest CLI](https://docs.tracetest.io/cli/configuring-your-cli):
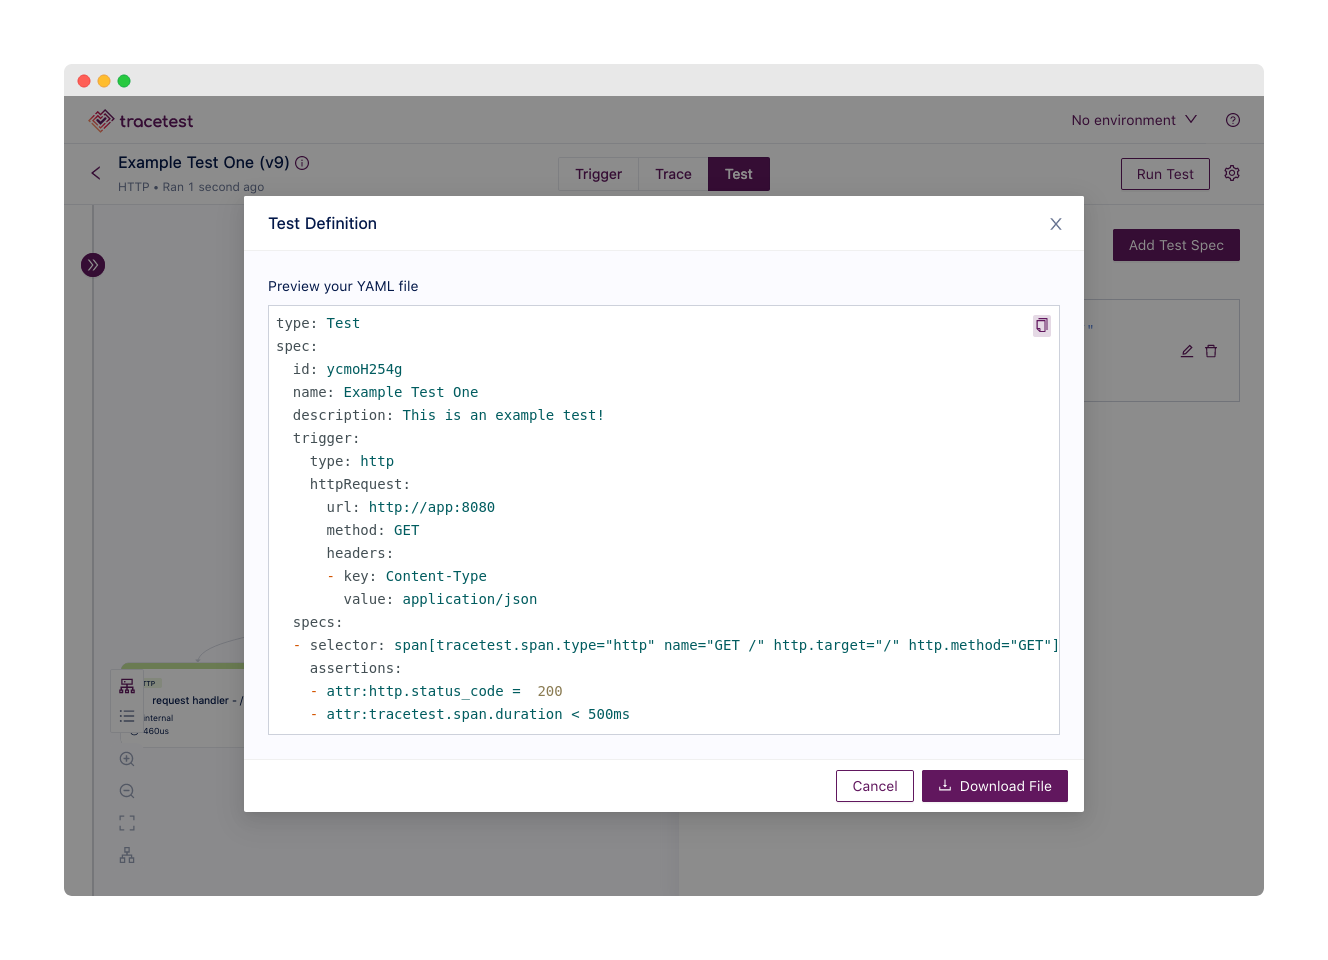
Go ahead and download the `.yaml` file, name it `test-api.yaml`, and save it in the root of your example app directory.
### Run the test with the Tracetest CLI
You can, of course, run this test through the GUI with the **Run Test** button, which will follow your distributed trace and let you know whether your assertion passed or failed.
But to enable automation, which opens up using Tracetest for detecting regressions and checking service SLOs, among other uses, let’s showcase the CLI tooling.
Head back over to your terminal and make sure to configure your Tracetest CLI.
```bash
tracetest configure
[Output]
Enter your Tracetest server URL [http://localhost:11633]: http://localhost:11633
```
Next, run your test using the definition you generated and downloaded above:
```bash
$ tracetest test run -d test-api.yaml -w
✔ Example Test One (http://localhost:11633/test/ycmoH254g/run/7/test)
```
The CLI tells you whether the test executed correctly, *not* whether it passed or failed. For that, click the link in the CLI output or jump back into Tracetest.
Your test will pass, as you’re testing the body’s HTTP status code, which should be `200`, and the duration, which should be far less than `500ms`.

Now, to showcase how ODD and the trace-based testing help you catch errors in your code *without* having to spend time writing additional tests, let’s add a `setTimeout`, which prevents the app from returning a response for at least 1000ms.
```jsx
const express = require("express")
const app = express()
app.get("/", (req, res) => {
setTimeout(() => {
res.send("Hello World")
}, 1000);
})
app.listen(8080, () => {
console.log(`Listening for requests on http://localhost:8080`)
})
```
Run the test with the CLI again, then jump into the Web UI, where you can see the assertion fails to due to the setTimeout, which means the span’s duration is more than `1s`:

## Conclusion
Give Tracetest a try in your applications and tracing infrastructure with our [quick start](https://docs.tracetest.io/getting-started/installation) guide, which sets you up with the CLI tooling and the Tracetest server in a few steps.
From there, you’ll be using the simple UI to generate valuable E2E tests faster than ever, increasing your test coverage, freeing yourself from manual testing procedures, identifying bottlenecks you didn’t even know existed.
We’d also love to hear about your ODD success stories in [Slack](https://dub.sh/tracetest-community)! Like traces themselves, we’re all about transparency and generating insights where there were once unknowns, so don't be shy! Feel free to give us a [star on GitHub](https://github.com/kubeshop/tracetest) as well.


.jpg)
.avif)
.avif)