
Testing Event-driven Systems with OpenTelemetry
.avif)

This article explains how to test event-driven systems with OpenTelemetry, using trace-based tests with Tracetest to emit events with Kafka and test how consumers process the events.
Table of Contents
Event-driven systems are architectural patterns in which the flow of the system is determined by events and the reactions to those events. In this approach, components or services communicate by producing and consuming events. This asynchronous and decoupled nature provides greater flexibility and scalability in system design.
These systems often rely on message brokers, like [Apache Kafka](https://kafka.apache.org/), to manage the distribution of events. Kafka is a distributed streaming platform designed to handle large volumes of real-time data. It provides durability, fault tolerance, and horizontal scalability, making it a popular option for building event-driven architectures.
## Observability for Event-driven Systems
One way to increase visibility into these architectures is by using observability tools. These tools allow you to track the end-to-end flow of events, gather metrics, and assess how these architectures handle these events. An example of such a tool is [OpenTelemetry](https://opentelemetry.io/), an open-source observability framework. OpenTelemetry enables the collection, processing, and export of telemetry data, including traces, metrics, and logs. Traces, in particular, offer valuable insights into the behavior and performance of distributed systems by capturing the request flow across different services.
This article will explore how to test event-driven systems with OpenTelemetry, using trace-based tests with [Tracetest](https://tracetest.io/) by emitting events with Kafka and testing how the consumers can process these events.
## Event-driven System Example: Payment Order system
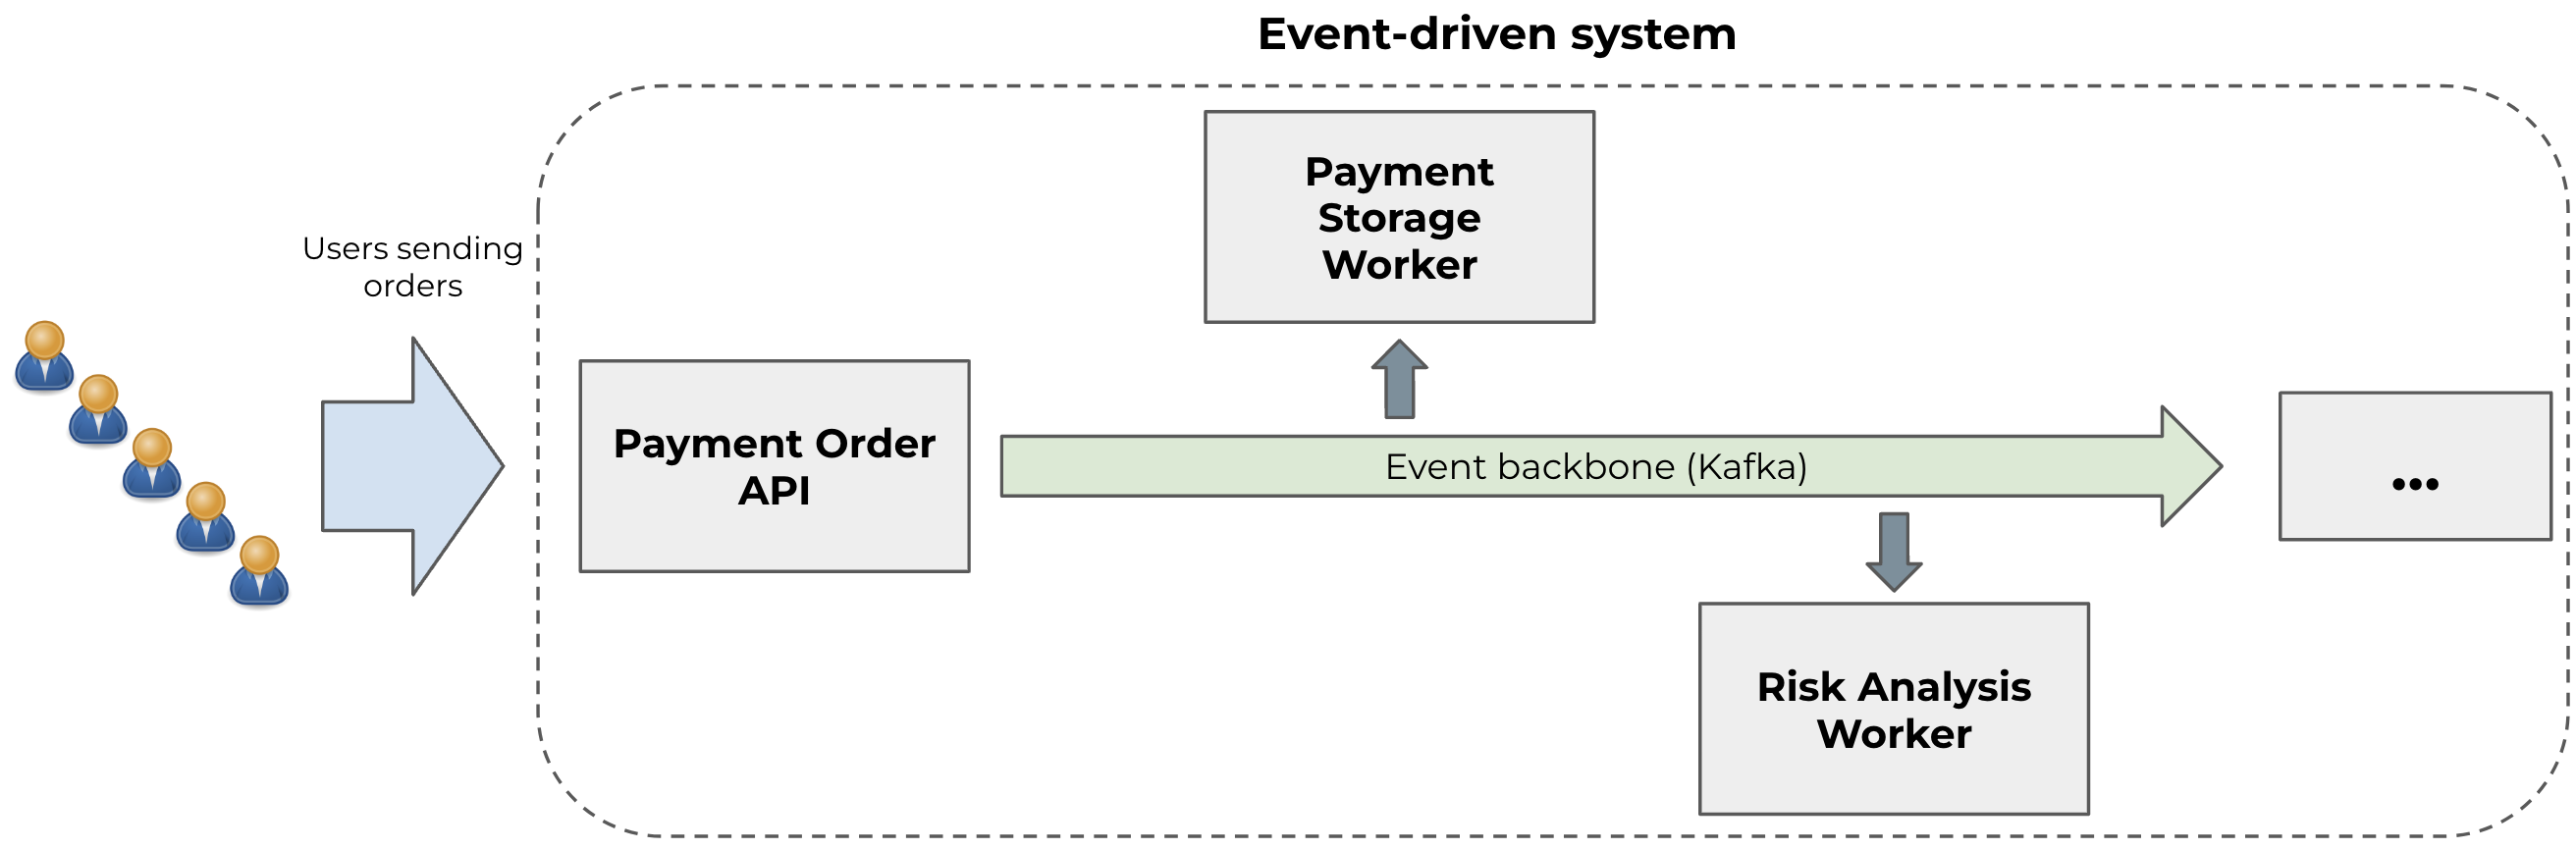
Suppose we have a Payment Order system with an API that receives orders but relies on other services to persist and perform risk analysis with the incoming order information. The Payment Order API delegates the order information to these other components/systems by sending the payment order as an event to a Kafka event backbone.
This event can be read and processed asynchronously by any event backbone reader. Here, we will focus on two components:
- A **Payment Storage** worker (written in Golang) that will persist the order in a database and;
- A **Risk Analysis** worker (written in Java) to evaluate and flag a payment order as risky if needed.
> The code for a simplified version of the system can be seen [here](https://github.com/kubeshop/tracetest/tree/main/examples/tracetesting-event-driven-systems).
You can run it by downloading the repo and executing the following commands:
```bash
git clone https://github.com/kubeshop/tracetest.git
cd ./tracetest/examples/tracetesting-event-driven-systems
docker compose up
```
At first glance, you can test it by making a simple request to the system:
```bash
curl --location 'localhost:8080/payment' \
--header 'Content-Type: application/json' \
--data '{
"originCustomerID": "bob",
"destinationCustomerID": "alice",
"value": 10000
}' \
--verbose
```
However, since the "Payment Order API” just receives the order quickly and forwards it to Kafka, we don't have so much information about the process, as can be seen on this HTTP Response:
```bash
* Trying 127.0.0.1:8080...
* Connected to localhost (127.0.0.1) port 8080 (#0)
> POST /payment HTTP/1.1
> Host: localhost:8080
> User-Agent: curl/8.1.2
> Accept: */*
> Content-Type: application/json
> Content-Length: 91
>
< HTTP/1.1 200 OK
< Date: Fri, 20 Oct 2023 18:40:47 GMT
< Content-Length: 0
<
* Connection #0 to host localhost left intact
```
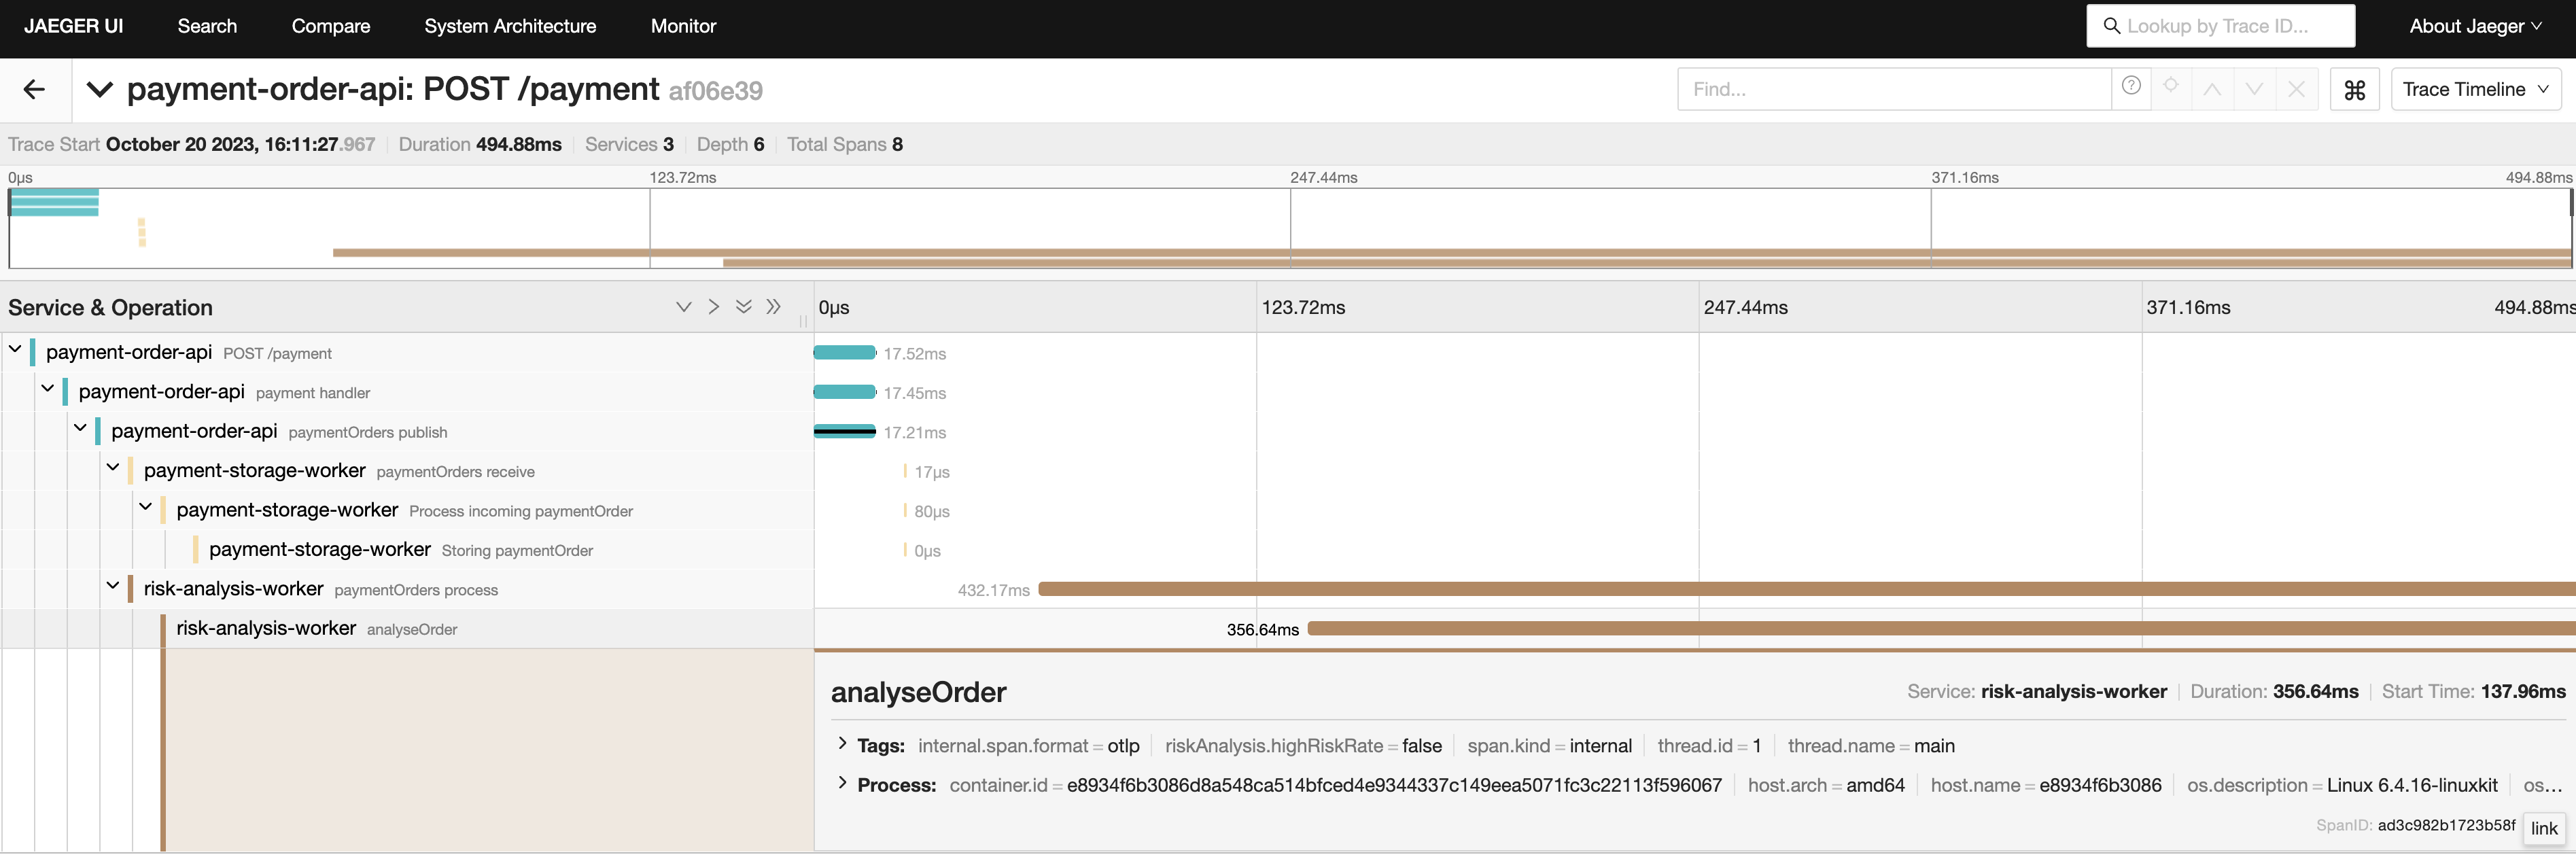
With this limitation in mind, how can I validate if the other workers have performed their tasks correctly? A good way is to make the entire process observable. [Instrument the process using OpenTelemetry](https://opentelemetry.io/docs/concepts/signals/traces/) and start viewing the entire flow from end-to-end by examining these traces in Jaeger. Using OpenTelemetry SDKs for Go and Java, I added [manual instrumentation](https://opentelemetry.io/docs/instrumentation/go/manual/) and [automatic instrumentation](https://opentelemetry.io/docs/instrumentation/java/automatic/) and was able to see the following trace in Jaeger.
Once observability is enabled, I can test different scenarios using trace-based tests. By leveraging traces, trace-based tests simulate and test various scenarios by injecting synthetic events into the system. This allows for validating different paths and behaviors, including error handling, performance optimization, and system resilience.
## Testing an Event-driven System using Trace-based Tests
To execute these tests, I will use [Tracetest](https://tracetest.io/). Tracetest enables the creation of tests by specifying various triggers to perform actions on the system. Afterwards, assertions can be created using trace data to verify if the system behaved as expected.
These tests can be created in the Tracetest Web UI, where you can interact and see the steps of the test running, or can be defined programmatically using a YAML file to define and run a test using Tracetest CLI.
> 💡 This example uses the Tracetest Core Server installed locally in Docker. You can see the Tracetest UI at [http://localhost:11633/](http://localhost:11633/). I recommend you use the [managed version of Tracetest](https://app.tracetest.io/) to get started quickly.
First, I’ll run a scenario called “[Submit a payment order via REST API and validate the workers processed the order](https://github.com/kubeshop/tracetest/blob/main/examples/tracetesting-event-driven-systems/test-payment-order-submit-with-rest-api.yaml)”, where I want to trigger the REST API directly. I can do this by defining an HTTP trigger and defining a payload for it.
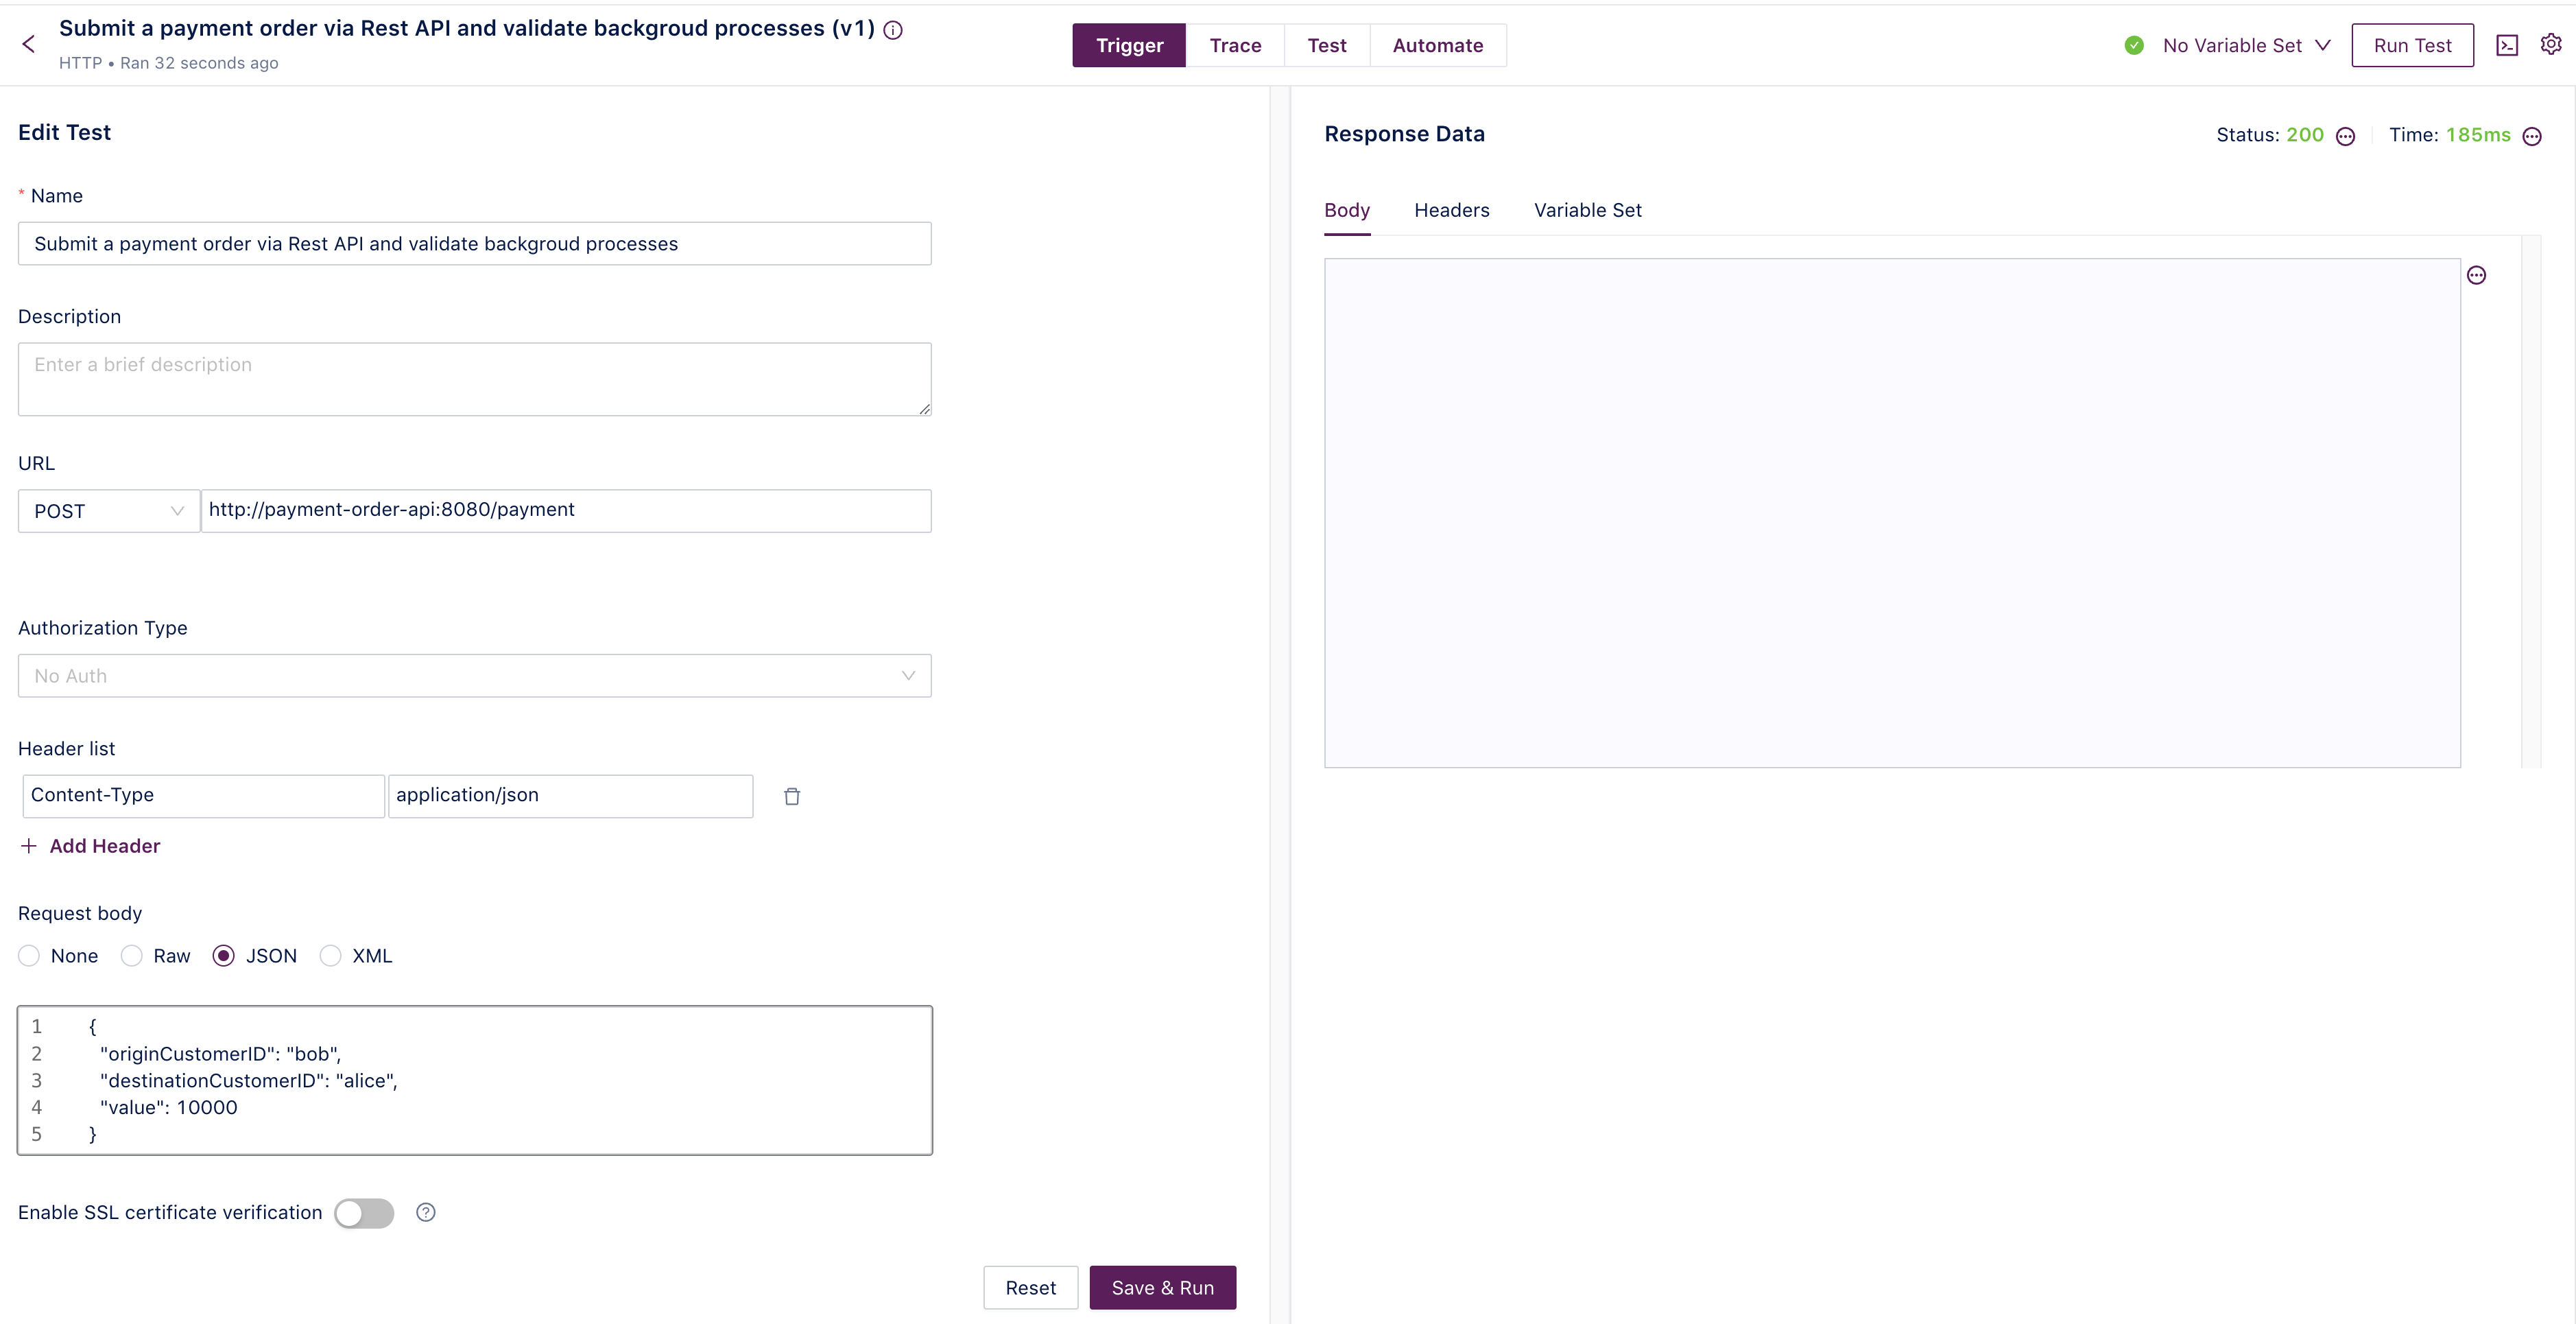
This trigger can also be seen in the test definition YAML file:
```yaml
type: Test
spec:
id: payment-order-submit
name: Submit a payment order via Rest API and validate backgroud processes
trigger:
type: http
httpRequest:
url: http://payment-order-api:8080/payment
method: POST
body: |-
{
"originCustomerID": "bob",
"destinationCustomerID": "alice",
"value": 10000
}
headers:
- key: Content-Type
value: application/json
```
After triggering the test, Tracetest will wait for the traces, fetch them, and display them graphically in the Web UI.
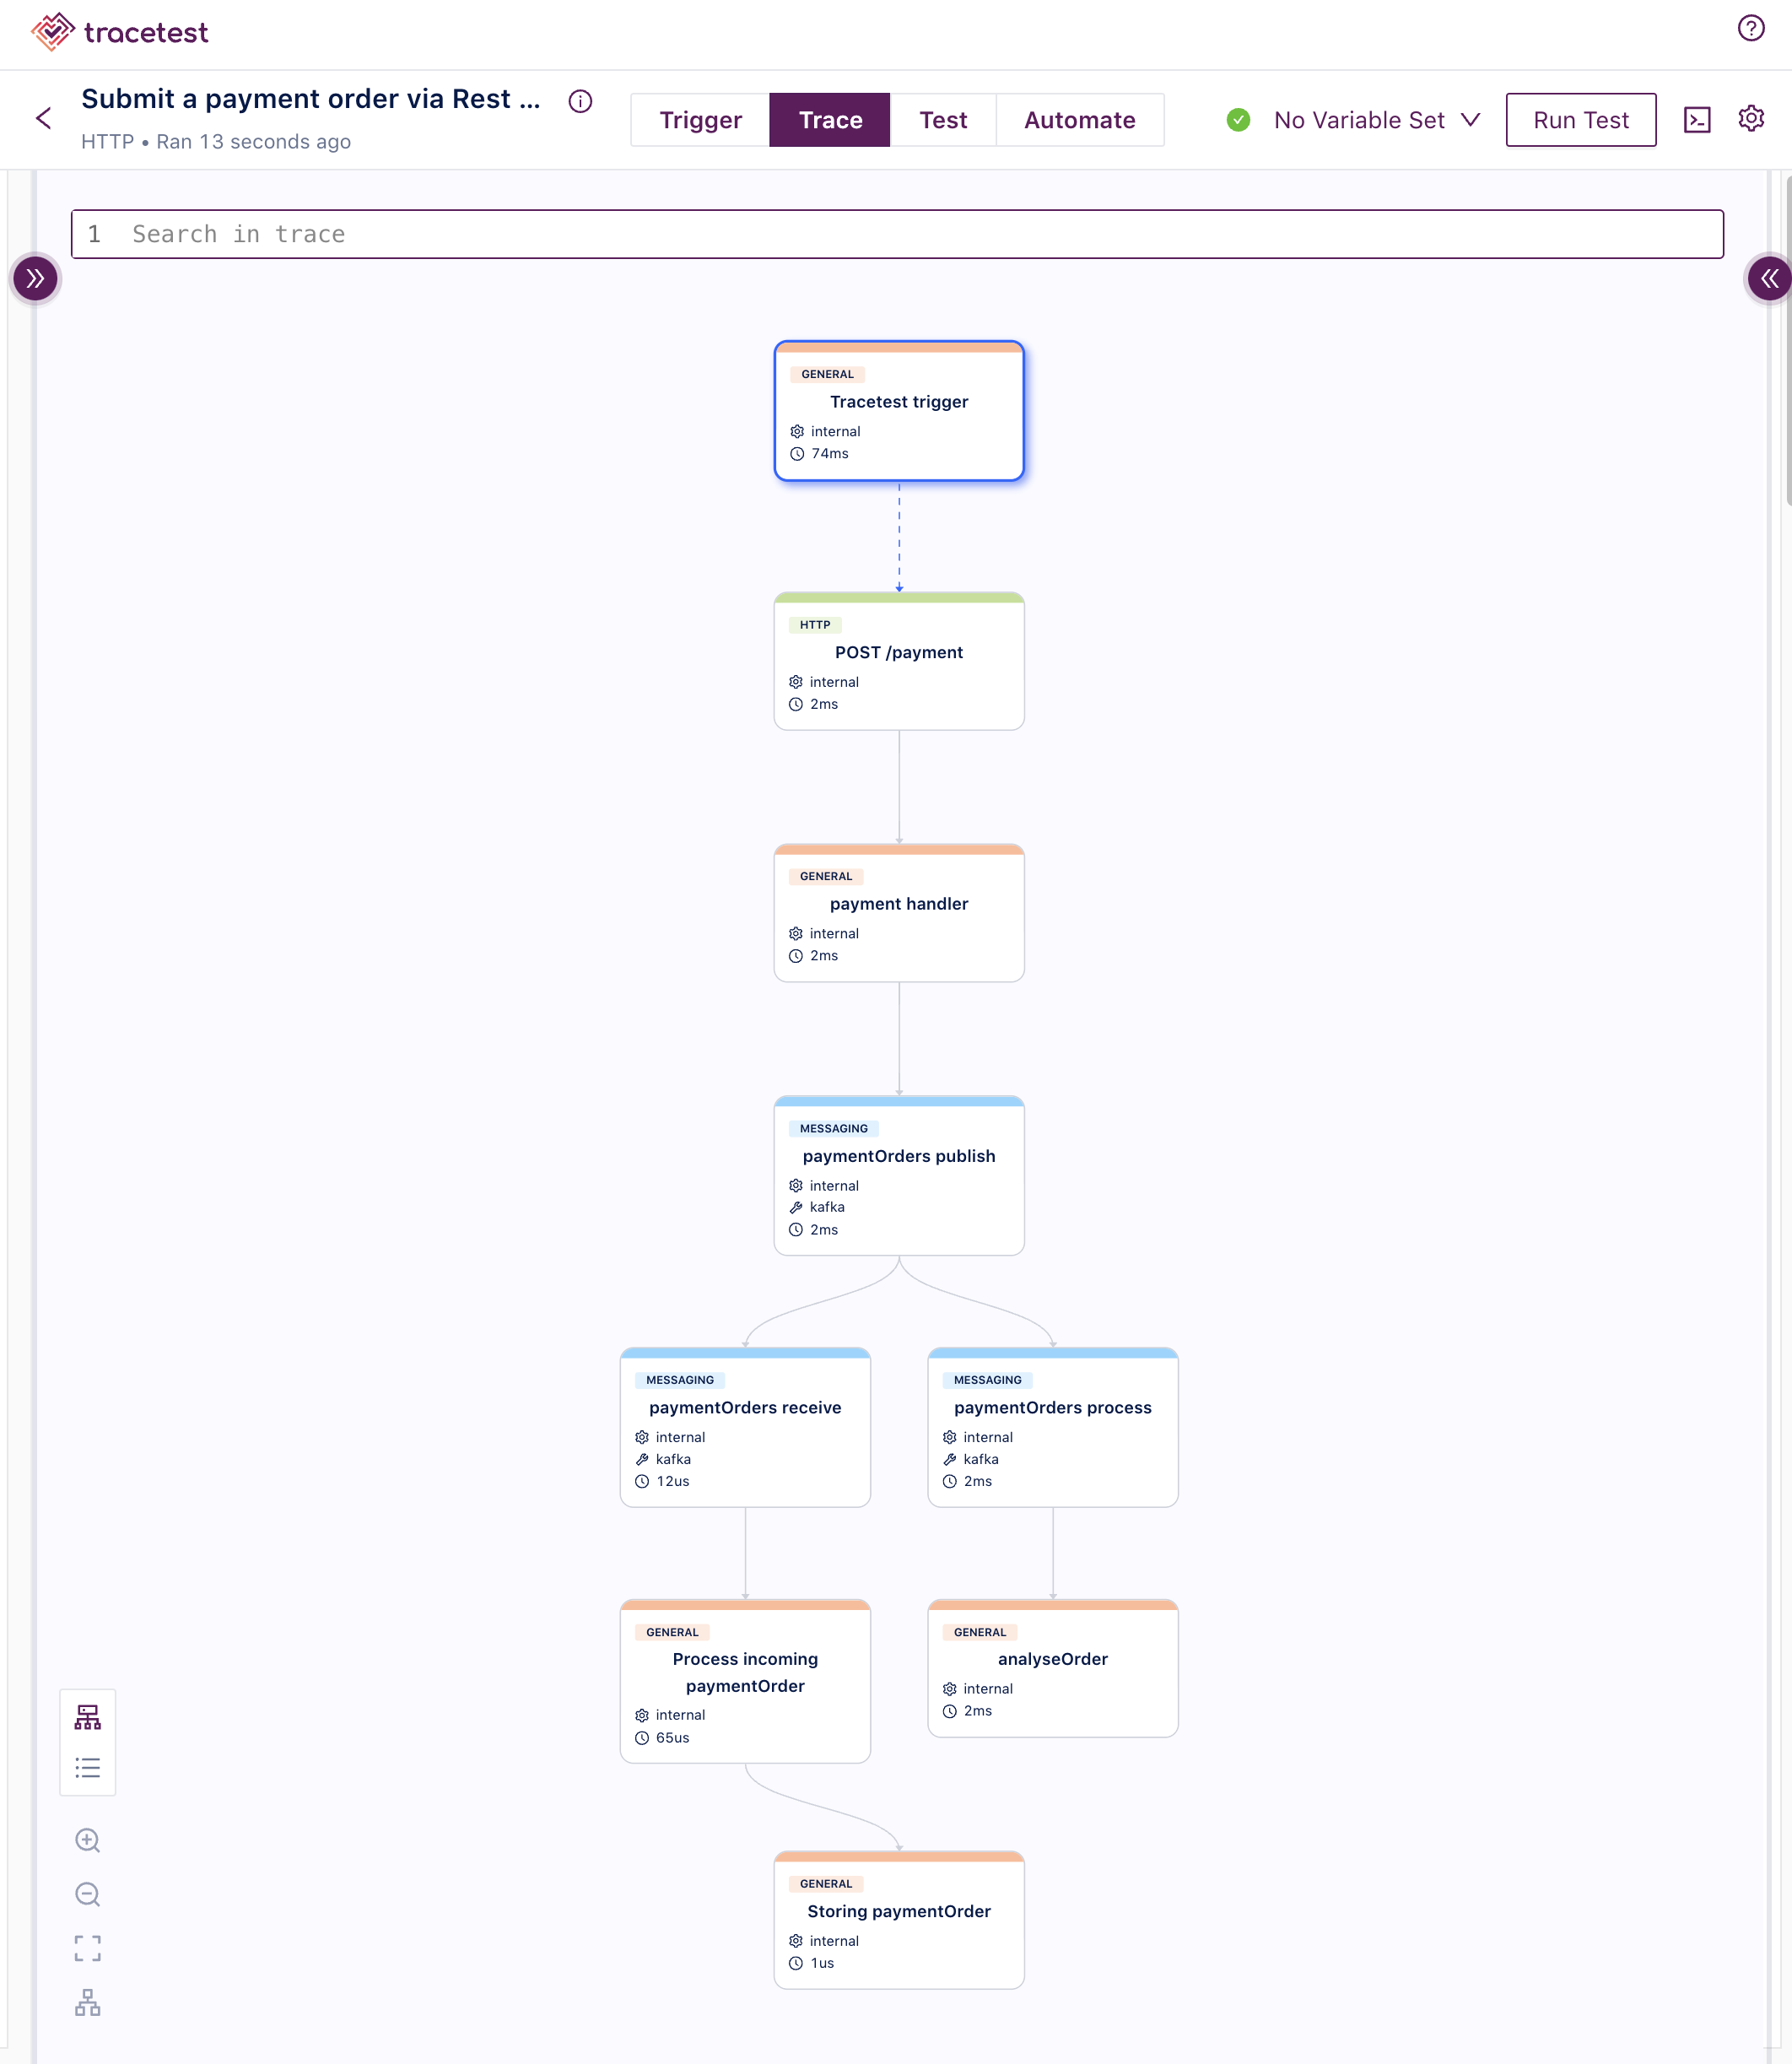
In this distributed trace, you can see the spans showing the operation made by each component of the system:
- API (`POST /payment`, `payment handler` and `paymentOrders publish`)
- Payment Storage worker (`paymentOrders receive`, `Process incoming paymentOrder` and `Storing paymentOrder`)
- Risk analysis worker (`paymentOrders process` and `analyseOrder`)
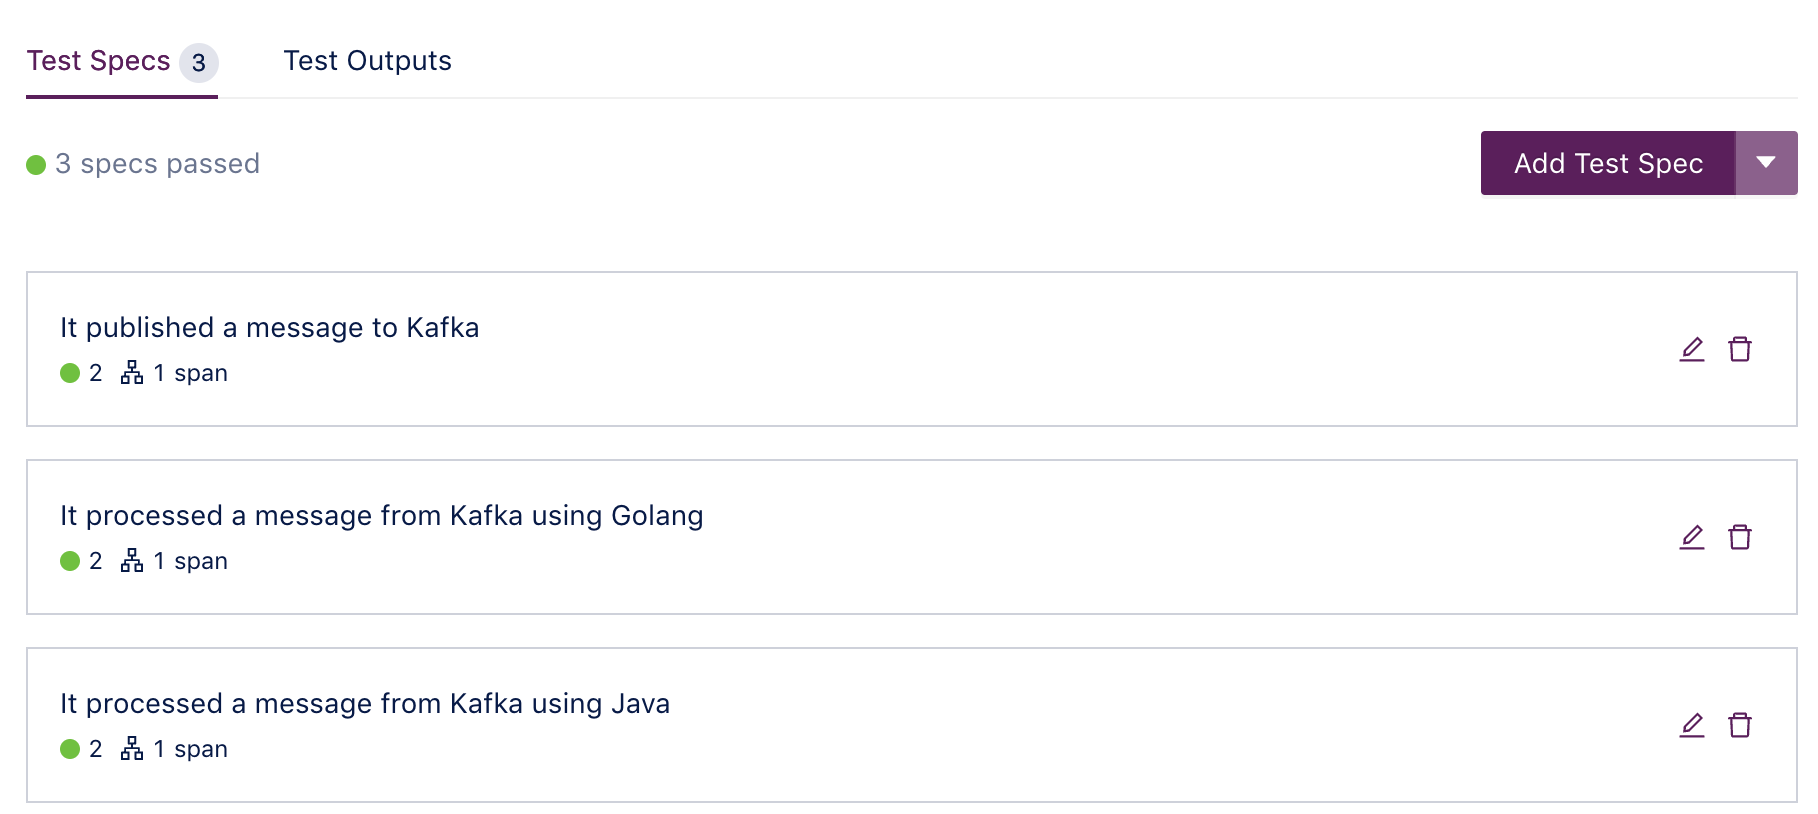
Given this trace, I can write test specifications to validate if each component emitted spans as intended:
```yaml
specs:
- name: It published a message to Kafka
selector: span[tracetest.span.type="messaging" name="paymentOrders publish"
messaging.system="kafka" messaging.operation="publish"]
assertions:
- attr:messaging.operation = "publish"
- attr:messaging.destination.name = "paymentOrders"
- name: It processed a message from Kafka using Golang
selector: span[tracetest.span.type="messaging" name="paymentOrders receive"
messaging.system="kafka" messaging.operation="receive"]
assertions:
- attr:tracetest.selected_spans.count = 1
- attr:messaging.destination.name = "paymentOrders"
- name: It processed a message from Kafka using Java
selector: span[tracetest.span.type="messaging" name="paymentOrders process"
messaging.system="kafka" messaging.operation="process"]
assertions:
- attr:tracetest.selected_spans.count = 1
- attr:messaging.destination.name = "paymentOrders"
```
I want to identify the traces of each system by using selectors and create assertions to ensure their existence, indicating that Worker/API processing has been completed. In the Web UI, I can confirm that each assertion was executed and passed, resulting in a successful test.
A second scenario is to [Submit a payment order with a high value with Kafka Message and validate Risk Analysis flagging](https://github.com/kubeshop/tracetest/blob/main/examples/tracetesting-event-driven-systems/test-risk-analysis-using-order-with-high-value.yaml), where I’m only interested in checking the workers and validating if they are storing and analyzing the order correctly. In this test, I’ll focus on using the CLI.
To do that, you’ll produce a synthetic message with a trigger that sends messages to Kafka and validates the resulting trace. The trigger will have the following data:
```yaml
type: Test
spec:
id: payment-order-submit
name: Submit a payment order with a High value with Kafka Message and validate Risk Analysis
trigger:
type: kafka
kafka:
brokerUrls:
- kafka:9092
topic: paymentOrders
messageKey: "transaction-1"
messageValue: |-
{
"originCustomerID": "bob",
"destinationCustomerID": "alice",
"value": 100000
}
```
In the test specifications, you validate if any trace spans exist, using the assertion `attr:tracetest.selected_spans.count = 1`, but also check if the order was marked as "risky”, with the attribution `attr:riskAnalysis.highRiskRate = "true"`.
```yaml
specs:
- name: It published a message to Kafka
selector: span[tracetest.span.type="general" name="Tracetest trigger"]
assertions:
- attr:tracetest.selected_spans.count = 1
- name: It processed a message from Kafka using Golang
selector: span[tracetest.span.type="messaging" name="paymentOrders receive"
messaging.system="kafka" messaging.operation="receive"]
assertions:
- attr:tracetest.selected_spans.count = 1
- attr:messaging.destination.name = "paymentOrders"
- name: It processed a message from Kafka using Java
selector: span[tracetest.span.type="messaging" name="paymentOrders process"
messaging.system="kafka" messaging.operation="process"]
assertions:
- attr:tracetest.selected_spans.count = 1
- attr:messaging.destination.name = "paymentOrders"
- name: Order should be flagged as risky
selector: span[tracetest.span.type="general" name="analyseOrder"
thread.name="main"]
assertions:
- attr:riskAnalysis.highRiskRate = "true"
- name: Order should be persisted
selector: span[tracetest.span.type="general" name="Storing paymentOrder"]
assertions:
- attr:tracetest.selected_spans.count = 1
```
Let’s merge both the trigger and assertions into a single file, called [test-risk-analysis-using-order-with-high-value.yaml](https://github.com/kubeshop/tracetest/blob/main/examples/tracetesting-event-driven-systems/test-risk-analysis-using-order-with-high-value.yaml)****,**** and run it with Tracetest CLI with this command:
```bash
tracetest run test -f test-risk-analysis-using-order-with-high-value.yaml -s http://localhost:11633/
```
This is what the terminal output should look like:
```bash
✔ Submit a payment order with a High value with Kafka Message and validate Risk Analysis (http://localhost:11633/test/payment-order-submit/run/3/test) - trace id: b336ca3f13281af0b8bff67bbfb28f2e
✔ It published a message to Kafka
✔ It processed a message from Kafka using Golang
✔ It processed a message from Kafka using Java
✔ Order should be flagged as risky
✔ Order should be persisted
```
View the test in the UI by going to [http://localhost:11633/test/payment-order-submit/run/1/test](http://localhost:11633/test/payment-order-submit/run/1/test).
## Continue Testing with OpenTelemetry
Integration and end-to-end tests can be troublesome at times because of the numerous moving parts that need to be managed and validated to ensure everything is in order.
By using OpenTelemetry to add observability to a system and Tracetest to run trace-based tests, you can test complex integration scenarios and validate them quickly using observability data, but also check scenarios that are not so easy to reproduce.
With Tracetest and OpenTelemetry, testing becomes more than just a routine task; it becomes a strategic asset in delivering high-quality, well-tested applications!
Would you like to learn more about Tracetest and what it brings to the table? Check the [docs](https://docs.tracetest.io/getting-started/installation) and try it out today by [downloading](https://tracetest.io/download) it today!
Also, please feel free to join our [Slack community](https://dub.sh/tracetest-community), give [Tracetest a star on GitHub](https://github.com/kubeshop/tracetest), or schedule a [time to chat 1:1](https://calendly.com/ken-kubeshop/45min).
.jpg)
.avif)
.avif)