
Test Observability for AWS Lambda with Grafana Tempo & OpenTel Layers
.avif)
%20(1).avif)
Learn about using Grafana Cloud, which we use at Tracetest for tracing, metrics, profiling, and observability, with AWS Lambda and OpenTelemetry Layers!
Table of Contents
I got great feedback from my Pulitzer award-winning blog post, "[Testing AWS Lambda & Serverless with OpenTelemetry](https://tracetest.io/blog/testing-aws-lambda-serverless-with-opentelemetry)". The community wanted a guide on using the official OpenTelemetry Lambda layers instead of a custom TypeScript wrapper. 😄
I decided to write this follow-up but to spice it up a little 🥵. Today I’m using Grafana Cloud, which has become one of my favorite tools! We use it extensively at Tracetest for our internal tracing, metrics, profiling, and overall observability.
> [See the full code for the example app you’ll build in the GitHub repo, here.](https://github.com/kubeshop/tracetest/tree/main/examples/quick-start-serverless-layers)
## OpenTelemetry Lambda Layers
With a decade of development experience, one thing I’ve learned is that no-code solutions help save time and delegate maintenance and implementation to a third party. It becomes even better when it's free 🤑 and from the [OpenTelemetry community](https://opentelemetry.io/docs/faas/)!
There are two different layers we will use today:
1. The Node.js auto-instrumentation for AWS Lambda enables tracing for your functions without writing a single line of code, as described in the [official OpenTelemetry docs, here](https://opentelemetry.io/docs/faas/lambda-auto-instrument/) and [on GitHub, here](https://github.com/open-telemetry/opentelemetry-lambda/releases/tag/layer-nodejs%2F0.6.0).
2. The [OpenTelemetry collector AWS Lambda layer](https://opentelemetry.io/docs/faas/lambda-collector/) enables the setup to be 100% serverless without any need to maintain infrastructure yourself. You still need to pay for it though 👀.
## Grafana Cloud
Grafana Cloud has become a staple tool to store everything related to observability under one umbrella. It allows integration with different tools like Prometheus for metrics or Loki for logs.
In this case, I’ll use [Tempo](https://grafana.com/products/cloud/traces/), a well-known tracing backend where you store the OpenTelemetry spans generated by the Lambda functions.
## Trace-based testing everywhere and for everyone!
[Trace-based testing](https://docs.tracetest.io/concepts/what-is-trace-based-testing) involves running validations against the telemetry data generated by the distributed system’s instrumented services.
[Tracetest](https://tracetest.io/), as an observability-enabled testing tool for Cloud Native architectures, leverages these distributed traces as part of testing, providing better visibility and testability to run trace-based tests.
## The Service under Test
Who said Pokemon? We truly love them at Tracetest, so today we have a new way of playing with the [PokeAPI](https://pokeapi.co/)!
Using the [Serverless Framework](https://www.serverless.com/), I’ll guide you through implementing a Lambda function that sends a request to the PokeAPI to grab Pokemon data by id, to then store it in a DynamoDB table.
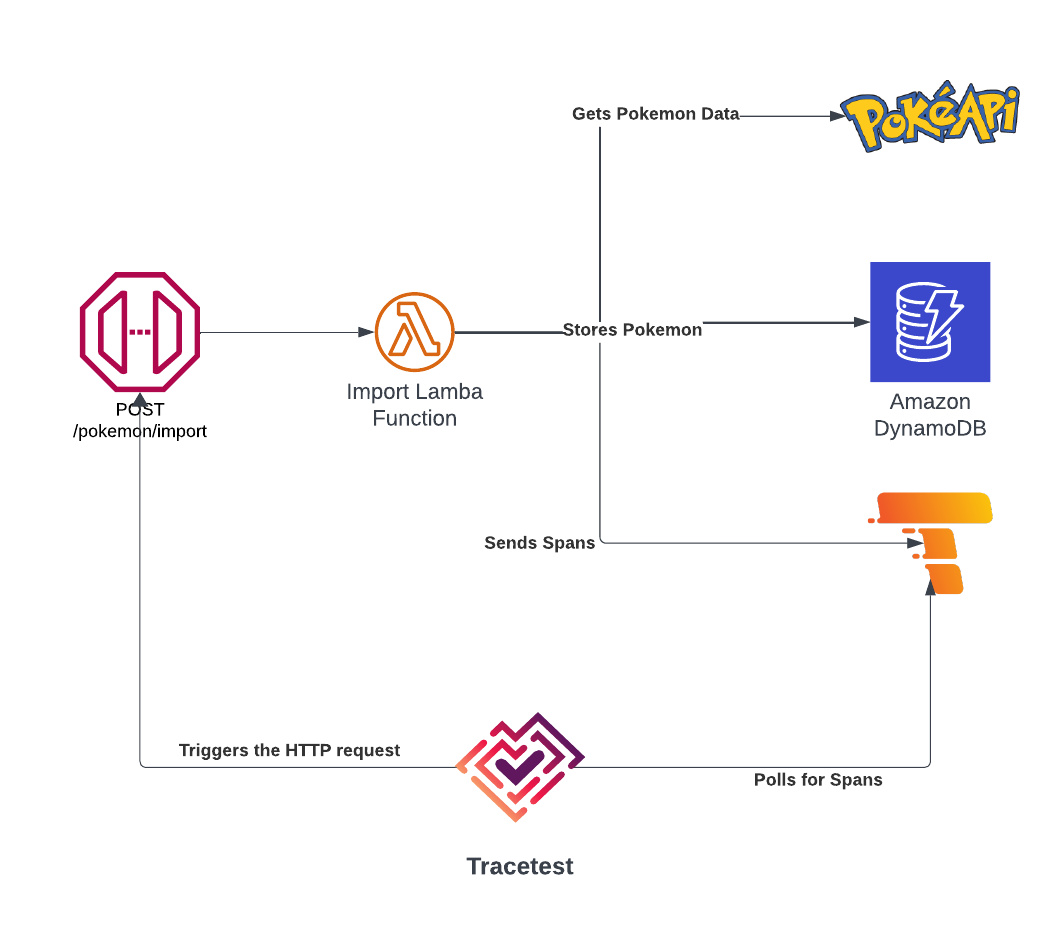
Nothing fancy, but this will be enough to demonstrate how powerful instrumenting your Serverless functions and adding trace-based testing on top can be! 💥
## Requirements
### Tracetest Account
- Sign up to [`app.tracetest.io`](https://app.tracetest.io/) or follow the [get started](https://docs.tracetest.io/getting-started/installation) docs.
- Create an [environment](https://docs.tracetest.io/concepts/environments).
- Select `Application is publicly accessible` to get access to the environment's [Tracetest Cloud Agent endpoint](https://docs.tracetest.io/concepts/cloud-agent).
- Select Tempo as the tracing backend.
- Fill in the details of your Grafana Cloud Tempo instance by using the HTTP integration. Check out the tracing backend resource definition, here.
- Test the connection and save it to finish the process.
### AWS
- Have access to an [AWS Account](https://aws.amazon.com/).
- Install and configure the [AWS CLI](https://aws.amazon.com/cli/).
- Use a role that is allowed to provision the required resources.
## What are the steps to run it myself?
If you want to jump straight ahead to run this example yourself ⭐️.
First, clone the Tracetest repo.
```bash
git clone https://github.com/kubeshop/tracetest.git
cd examples/quick-start-serverless-layers
```
Then, follow the instructions to run the deployment and the trace-based tests:
1. Copy the `.env.template` file to `.env`.
2. Fill the `TRACETEST_API_TOKEN` value with the one generated for your Tracetest environment.
3. Set the Tracetest tracing backend to Tempo. Fill in the details of your Grafana Cloud Tempo instance by using the HTTP integration including headers looking like `authorization: Basic <base 64 encoded>`. It should be encoded `base64` with the format of `username:token`. Follow [this guide](https://grafana.com/blog/2021/04/13/how-to-send-traces-to-grafana-clouds-tempo-service-with-opentelemetry-collector/) to learn how. And, check out [this tracing backend resource definition](https://github.com/kubeshop/tracetest/blob/main/examples/quick-start-serverless-layers/tracetest-tracing-backend.yaml). You can apply it with the Tracetest CLI like this `tracetest apply datastore -f ./tracetest-tracing-backend.yaml`.
4. Fill the `authorization` header in the `collector.yaml` file from your Grafana Tempo Setup. It should be encoded `base64` with the format of `username:token`. Follow [this guide](https://grafana.com/blog/2021/04/13/how-to-send-traces-to-grafana-clouds-tempo-service-with-opentelemetry-collector/) to learn how.
5. Run `npm i`.
6. Run the Serverless Framework deployment with `npm run deploy`. Use the API Gateway endpoint from the output in your test below.
7. Run the trace-based tests with `npm test https://<api-gateway-id>.execute-api.us-east-1.amazonaws.com`.
Now, let’s dive into the nitty-gritty details. 🤓
## The Observability Setup
Instrumenting a Lambda function is easier than ever, depending on your AWS region, add the ARN of the [OpenTelemetry Collector](https://github.com/open-telemetry/opentelemetry-lambda/releases/tag/layer-collector%2F0.6.0) and the [Node.js tracer](https://github.com/open-telemetry/opentelemetry-lambda/releases/tag/layer-nodejs%2F0.6.0).
```yaml
# serverless.yaml
functions:
api:
# Handler and events definition
handler: src/handler.importPokemon
events:
- httpApi:
path: /import
method: post
# ARN of the layers
layers:
- arn:aws:lambda:us-east-1:184161586896:layer:opentelemetry-nodejs-0_6_0:1
- arn:aws:lambda:us-east-1:184161586896:layer:opentelemetry-collector-amd64-0_6_0:1
```
Next, add a couple of environment variables to configure the start of the handler functions and the configuration for the OpenTelemetry collector.
```yaml
# serverless.yaml
environment:
OPENTELEMETRY_COLLECTOR_CONFIG_FILE: /var/task/collector.yaml
AWS_LAMBDA_EXEC_WRAPPER: /opt/otel-handler
```
The `opentelemetry-nodejs` layer will spin off the Node.js tracer, configure the supported auto-instrumentation libraries, and set up the context propagators.
While the `opentelemetry-collector` layer is going to spin off a version of the collector executed in the same context as the AWS lambda layers, configured by [the `collector.yaml` file](https://github.com/kubeshop/tracetest/blob/main/examples/quick-start-serverless-layers/collector.yaml).
```yaml
# collector.yaml
receivers:
otlp:
protocols:
grpc:
endpoint: "0.0.0.0:4317"
http:
endpoint: "0.0.0.0:4318"
exporters:
otlp:
endpoint: tempo-us-central1.grafana.net:443
headers:
authorization: Basic <your basic64 encoded token>
service:
pipelines:
traces:
receivers: [otlp]
exporters: [otlp]
```
Easy peezy lemon squeezy 🍋 right? well, this is everything you need to do to start your observability journey!
## For every trace, there should be a test!
After having the observability setup, now is time to go to the next level by leveraging it by running some trace-based tests. This is our test case:
- Execute an HTTP request against the import Pokemon service.
- This is a two-step process that includes a request to the PokeAPI to grab the Pokemon data.
- Then, it executes the required database operations to store the Pokemon data in DynamoDB.
**What are the key parts we want to validate?**
1. Validate that the external service from the worker is called with the proper `POKEMON_ID` and returns `200`.
2. Validate that the duration of the DB operations is less than `100ms`.
3. Validate that the response from the initial API Gateway request is `200`.
## **Running the Trace-Based Tests**
To run the tests, we are using the `@tracetest/client` [NPM package](https://www.npmjs.com/package/@tracetest/client). It allows teams to enhance existing validation pipelines written in JavaScript or TypeScript by including trace-based tests in their toolset.
The code can be found in [the `tracetest.ts` file](https://github.com/kubeshop/pokeshop/blob/master/serverless/tracetest.ts).
```jsx
import Tracetest from '@tracetest/client';
import { TestResource } from '@tracetest/client/dist/modules/openapi-client';
import { config } from 'dotenv';
config();
const { TRACETEST_API_TOKEN = '' } = process.env;
const [raw = ''] = process.argv.slice(2);
let url = '';
try {
url = new URL(raw).origin;
} catch (error) {
console.error(
'The API Gateway URL is required as an argument. i.e: `npm test https://75yj353nn7.execute-api.us-east-1.amazonaws.com`'
);
process.exit(1);
}
const definition: TestResource = {
type: 'Test',
spec: {
id: 'ZV1G3v2IR',
name: 'Serverless: Import Pokemon',
trigger: {
type: 'http',
httpRequest: {
method: 'POST',
url: '${var:ENDPOINT}/import',
body: '{"id": "${var:POKEMON_ID}"}\n',
headers: [
{
key: 'Content-Type',
value: 'application/json',
},
],
},
},
specs: [
{
selector: 'span[tracetest.span.type="database"]',
name: 'All Database Spans: Processing time is less than 100ms',
assertions: ['attr:tracetest.span.duration < 100ms'],
},
{
selector: 'span[tracetest.span.type="http"]',
name: 'All HTTP Spans: Status code is 200',
assertions: ['attr:http.status_code = 200'],
},
{
selector:
'span[name="tracetest-serverless-dev-api"] span[tracetest.span.type="http" name="GET" http.method="GET"]',
name: 'The request matches the pokemon Id',
assertions: ['attr:http.url = "https://pokeapi.co/api/v2/pokemon/${var:POKEMON_ID}"'],
},
],
},
};
const main = async () => {
const tracetest = await Tracetest(TRACETEST_API_TOKEN);
const test = await tracetest.newTest(definition);
await tracetest.runTest(test, {
variables: [
{
key: 'ENDPOINT',
value: url.trim(),
},
{
key: 'POKEMON_ID',
value: `${Math.floor(Math.random() * 100) + 1}`,
},
],
});
console.log(await tracetest.getSummary());
};
main();
```
### Get True Test Observability
Make sure to apply the Tempo tracing backend in Tracetest. Create your Basic auth token, and use this resource file for reference. View [the `tracetest-tracing-backend.yaml` resource file on GitHub, here](https://github.com/kubeshop/tracetest/blob/main/examples/quick-start-serverless-layers/tracetest-tracing-backend.yaml).
```yaml
type: DataStore
spec:
id: tempo-cloud
name: Tempo
type: tempo
tempo:
type: http
http:
url: https://tempo-us-central1.grafana.net/tempo
headers:
authorization: Basic <base 64 encoded>
tls: {}
```
Apply the resource with the [Tracetest CLI](https://docs.tracetest.io/cli/cli-installation-reference).
```bash
tracetest config -t TRACETEST_API_TOKEN
tracetest apply datastore -f ./tracetest-tracing-backend.yaml
```
Or, add it manually in the Tracetest Web UI.

With everything set up and the trace-based tests executed against the PokeAPI, we can now view the complete results.
Run the test with the command below.
```bash
npm test https://<api-gateway-id>.execute-api.us-east-1.amazonaws.com
```
Follow the links provided in the `npm test` command output to find the full results, which include the generated trace and the test specs validation results.
```bash
[Output]
> tracetest-serverless@1.0.0 test
> ENDPOINT="$(sls info --verbose | grep HttpApiUrl | sed s/HttpApiUrl\:\ //g)" ts-node tracetest.ts https://<api-gateway-id>.execute-api.us-east-1.amazonaws.com/import
Run Group: #618f9cda-a87e-4e35-a9f4-10cfbc6f570f (https://app.tracetest.io/organizations/ttorg_ced62e34638d965e/environments/ttenv_a613d93805243f83/run/618f9cda-a87e-4e35-a9f4-10cfbc6f570f)
Failed: 0
Succeed: 1
Pending: 0
Runs:
✔ Serverless: Import Pokemon (https://app.tracetest.io/organizations/ttorg_ced62e34638d965e/environments/ttenv_a613d93805243f83/test/ZV1G3v2IR/run/22) - trace id: d111b18ca75fb6dbf170b66d963363f9
```
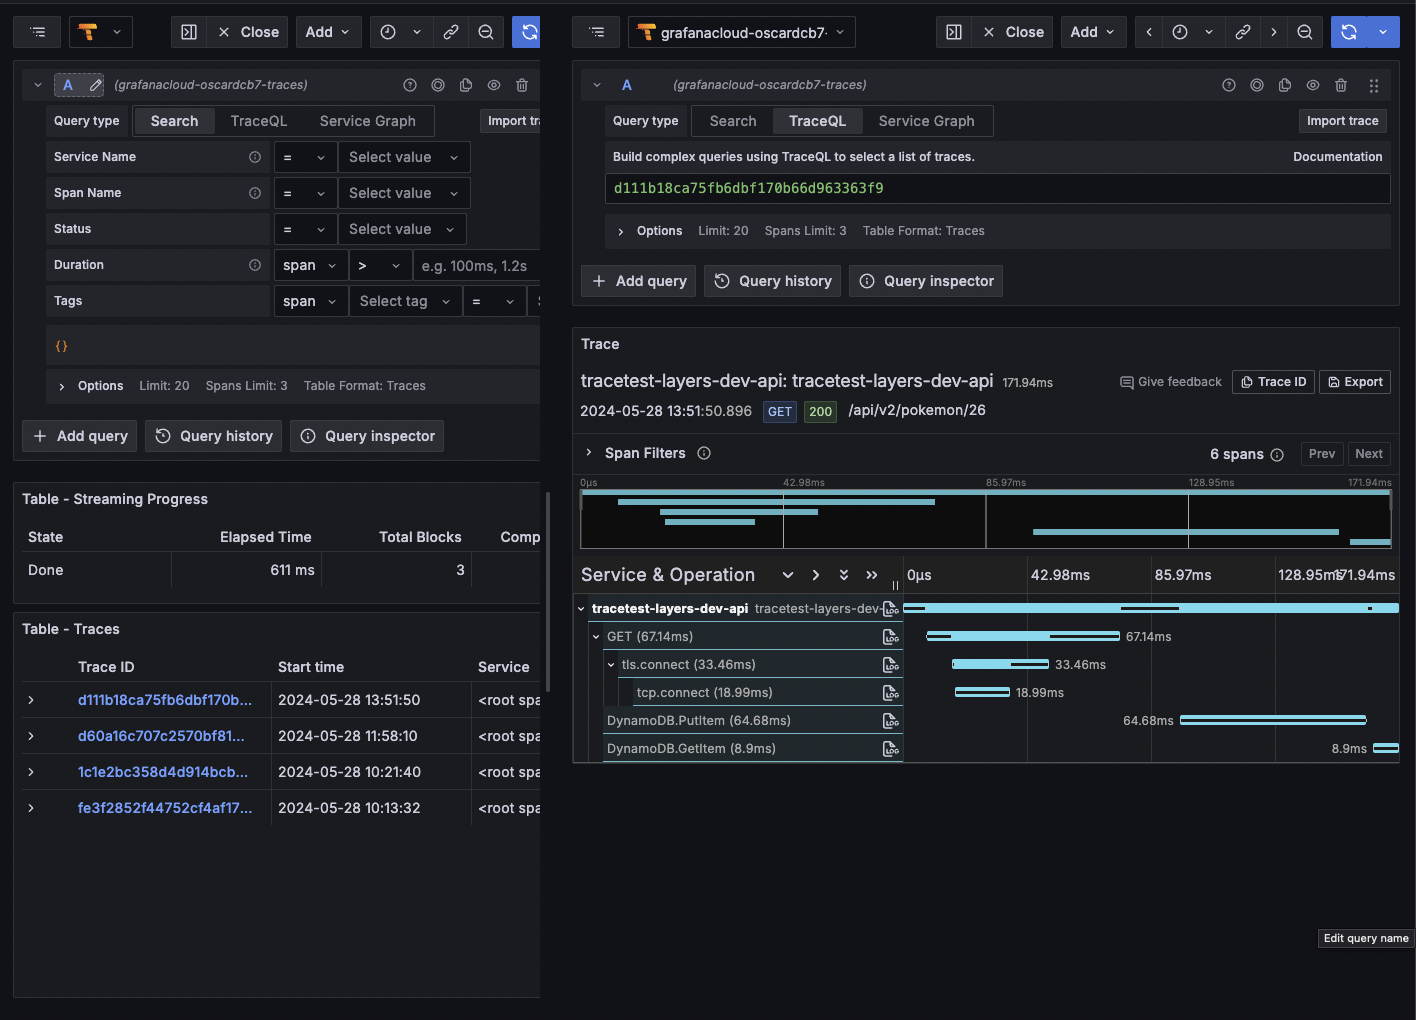
### Find the trace in Grafana Cloud Tempo
The full list of spans generated by the AWS Lambda function can be found in your Tempo instance, these are the same ones that are displayed in the Tracetest App after fetching them from Tempo.

> *👉 [Join the demo organization where you can start playing around with the Serverless example with no setup!!](https://app.tracetest.io/organizations/ttorg_2179a9cd8ba8dfa5/invites/invite_f9f784f30c85dc97/accept) 👈*
From the Tracetest test run view, you can view the list of spans generated by the Lambda function, their attributes, and the test spec results, which validate the key points.
## Key Takeaways
### Simplified Observability with OpenTelemetry Lambda Layers
In this post I’ve highlighted how using OpenTelemetry Lambda layers allows for automatic tracing without additional code, making it easier than ever to set up observability for your Serverless applications.
### Powerful Integration with Grafana Cloud
Grafana Cloud has become an essential tool in our observability toolkit. By leveraging Grafana Tempo for tracing, we can store and analyze OpenTelemetry spans effectively, showcasing the seamless integration and its benefits.
### Enhanced Trace-Based Testing with Tracetest
Tracetest is a game-changer for trace-based testing. By validating telemetry data from our instrumented services, it provides unparalleled visibility and testability, empowering us to ensure our distributed systems perform as expected.
Would you like to learn more about Tracetest and what it brings to the table? Check the [docs](https://docs.tracetest.io/examples-tutorials/recipes/running-tracetest-with-lightstep/) and try it out today by [signing up for free](https://app.tracetest.io/)!
Also, please feel free to join our [Slack community](https://dub.sh/tracetest-community), give [Tracetest a star on GitHub](https://github.com/kubeshop/tracetest), or [schedule a time to chat 1:1](https://calendly.com/ken-kubeshop/tracetest-walkthrough).
.jpg)
.avif)
.avif)