
Synthetic Monitoring with the Tracetest GitHub Action
.avif)

Implement Tracetest's GitHub Action for synthetic monitoring with OpenTelemetry Demo. Schedule hourly tests, validate locally, and enhance system performance.
Table of Contents
It’s official! You can now use synthetic monitoring to run trace-based tests with [Tracetest’s new GitHub Action](https://github.com/kubeshop/tracetest-github-action). I’ve already implemented dogfooding and it’s currently running in production as health checks, running hourly, [here](https://github.com/kubeshop/tracetest/actions/workflows/scheduled-jobs.yml).
In this article, I’ll show how I used GitHub Actions to enable synthetic monitoring. You’ll learn how to define a GitHub Action and create a schedule to run tests against the [OpenTelemetry Demo](https://docs.tracetest.io/live-examples/opentelemetry-store/overview).
## What is Synthetic Monitoring?
Synthetic monitoring is a technique used to assess system health, functionality, and responsiveness. Instead of relying on actual user data, synthetic monitoring involves the creation of simulated transactions within the system to mimic user behavior. These synthetic transactions aim to replicate common user paths and activities, enabling you to proactively identify and address potential issues before they impact real users.
## Designing a User Interaction with Synthetic Monitoring
The [public beta of Tracetest is now available](https://tracetest.io/blog/tracetest-monthly-newsletter-september-2023), offering a simplified solution for developers to efficiently integrate Tracetest into their infrastructure. [Live demos](https://docs.tracetest.io/getting-started/try-live-demos/) are available to simplify onboarding with trace-based tests, allowing users to explore, execute, and create tests for instrumented systems such as [Pokeshop](https://docs.tracetest.io/live-examples/pokeshop/overview) and [OpenTelemetry Demo](https://docs.tracetest.io/live-examples/opentelemetry-store/overview).
I’ll walk you through designing tests for the [OpenTelemetry Demo](https://docs.tracetest.io/live-examples/opentelemetry-store/overview). It’s an astronomy shop that sells telescopes. One flow I wanted to map is [a user purchasing a product](https://docs.tracetest.io/live-examples/opentelemetry-store/use-cases/user-purchasing-products) in the shop, with the following steps:
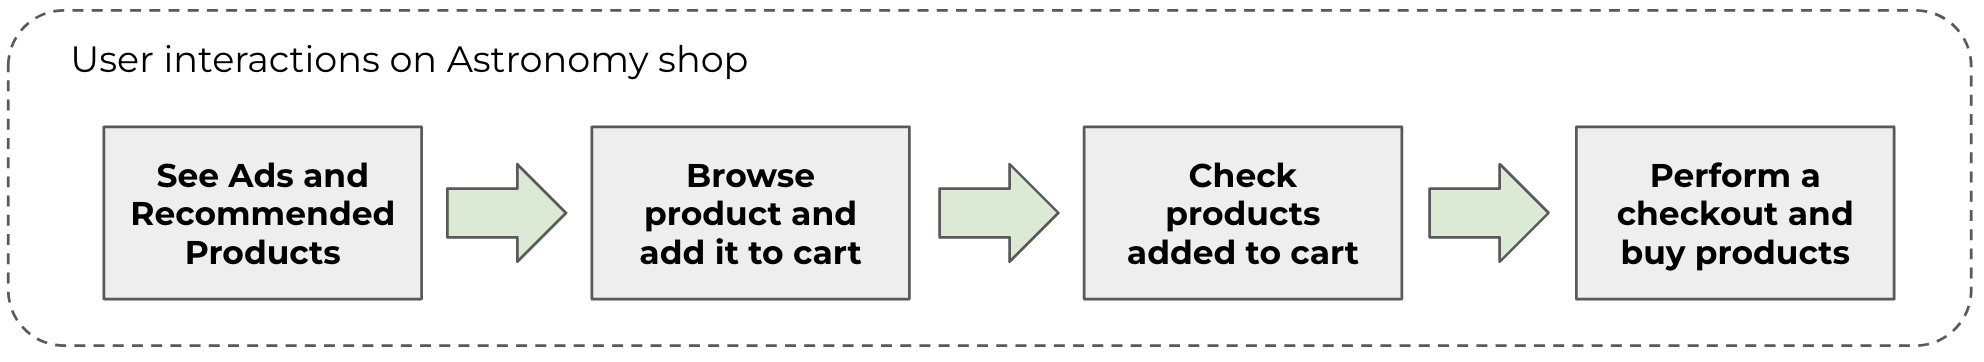
To do that, I’ve created a [test suite](https://docs.tracetest.io/concepts/test-suites) based on [Open Telemetry Frontend trace-based tests](https://github.com/kubeshop/tracetest/tree/main/testing/synthetic-monitoring/otel-demo) that run six trace-based tests in sequence:
1. [See ads on the shop](https://github.com/kubeshop/tracetest/blob/main/testing/synthetic-monitoring/otel-demo/01-see-ads.yaml).
2. [Get product recommendations](https://github.com/kubeshop/tracetest/blob/main/testing/synthetic-monitoring/otel-demo/02-get-product-recommendation.yaml).
3. [Browse product](https://github.com/kubeshop/tracetest/blob/main/testing/synthetic-monitoring/otel-demo/03-browse-product.yaml).
4. [Add product to cart](https://github.com/kubeshop/tracetest/blob/main/testing/synthetic-monitoring/otel-demo/04-add-product-to-cart.yaml).
5. [View shopping cart](https://github.com/kubeshop/tracetest/blob/main/testing/synthetic-monitoring/otel-demo/05-view-cart.yaml).
6. [Perform a checkout and buy products](https://github.com/kubeshop/tracetest/blob/main/testing/synthetic-monitoring/otel-demo/06-checking-out-cart.yaml).
In the [TestSuite specification](https://github.com/kubeshop/tracetest/blob/main/testing/synthetic-monitoring/otel-demo/_testsuite.yaml), you can see each one of the steps chained:
```yaml
# test suite based on https://github.com/open-telemetry/opentelemetry-demo/tree/main/test/tracetesting/frontend-service
type: TestSuite
spec:
id: otel-demo-test-suite
name: OTel Demo Synthetic tests
description: Run all Frontend tests enabled in sequence, simulating a process of a user purchasing products on Astronomy store
steps:
- ./01-see-ads.yaml
- ./02-get-product-recommendation.yaml
- ./03-browse-product.yaml
- ./04-add-product-to-cart.yaml
- ./05-view-cart.yaml
- ./06-checking-out-cart.yaml
```
In each test, you see the action that’s triggered and which assertions are performed against the API response and trace, like on the `View shopping cart` test:
```yaml
# test suite based on https://github.com/open-telemetry/opentelemetry-demo/tree/main/test/tracetesting/frontend-service
type: Test
spec:
id: frontend-view-cart
name: 'Frontend: View cart'
description: Simulate a user viewing the shopping cart
trigger:
type: http
httpRequest:
url: http://${var:FRONTEND_ADDR}/api/cart?userId=2491f868-88f1-4345-8836-d5d8511a9f83
method: GET
headers:
- key: Content-Type
value: application/json
specs:
- name: It called the frontend with success
selector: span[tracetest.span.type="general" name="Tracetest trigger"]
assertions:
- attr:tracetest.response.status = 200
- name: It retrieved the cart items correctly
selector: span[name="oteldemo.CartService/GetCart"]
assertions:
- attr:rpc.grpc.status_code = 0
```
To run these tests locally and validate them, add your user in the [Tracetest demo organization](https://docs.tracetest.io/getting-started/try-live-demos/), and then configure our CLI to that environment:
```bash
# run tracetest configure and choose a organization and environment for the CLI
➜ ~ tracetest configure
What Organization do you want to use?:
> tracetest-demo (ttorg_2179a9cd8ba8dfa5)
What Environment do you want to use?:
> opentelemetry-demo (ttenv_597cf82c754c2a01)
SUCCESS Successfully configured Tracetest CLI
```
After that, download the files from the [Tracetest GitHub repository in the otel-demo folder](https://github.com/kubeshop/tracetest/tree/main/testing/synthetic-monitoring/otel-demo) and run the following command:
```bash
# run test suite with Tracetest CLI
tracetest run testsuite --file ./_testsuite.yaml --vars ./_variableset.yaml
```
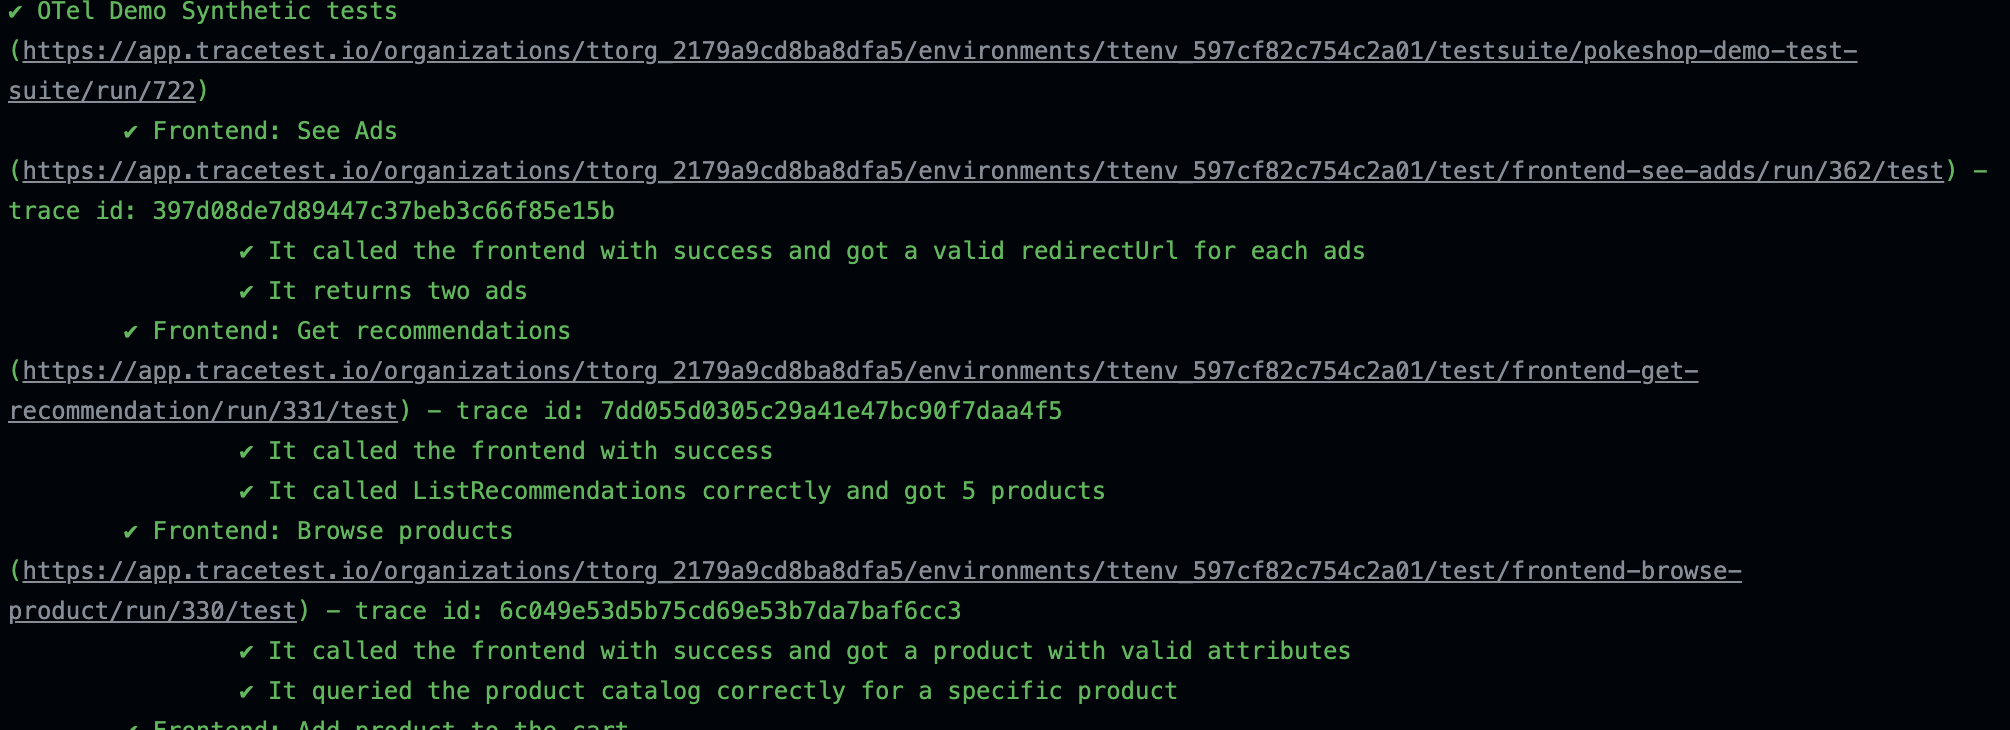
After running this test suite, you’ll see an output like this:
## Creating a GitHub Action to Run Synthetic Monitoring
After structuring the test suite to run as part of the synthetic monitoring, define a [GitHub Workflow](https://docs.github.com/en/actions/using-workflows/about-workflows) to run these tests with a `schedule` trigger. Set a [cron](https://en.wikipedia.org/wiki/Cron) expression to define the periodicity of the tests. I’ve set it to run each hour.
Additionally, set a `workflow_dispatch` to enable running the trigger manually and check if the action is working fine.
The `.github/workflows/scheduled-jobs.yml` file was defined initially as:
```yaml
name: Synthetic monitoring with Tracetest
on:
# allows the manual trigger
workflow_dispatch:
schedule:
- cron: '0 */1 * * *' # every hour
jobs:
otel-demo-trace-based-tests:
name: Run trace based tests for Open Telemetry demo
runs-on: ubuntu-latest
steps:
# To be defined ...
```
In this file, you can see a job called `otel-demo-trace-based-tests` that runs in an `ubuntu-latest` worker with the steps to run the test.
These steps are:
1. Checking out the test code.
2. Installing and configuring Tracetest CLI to point to the [OpenTelemetry Demo](https://docs.tracetest.io/live-examples/opentelemetry-store/overview) environment.
3. Running the test suite.
In the first step of checking out the code, use the `actions/checkout` that encapsulates all the Git actions needed:
```yaml
#...
otel-demo-trace-based-tests:
name: Run trace based tests for Open Telemetry demo
runs-on: ubuntu-latest
steps:
- name: Checkout
uses: actions/checkout@v3
# more steps to be added...
```
Then, to configure Tracetest you use the brand new [GitHub Action](https://github.com/kubeshop/tracetest-github-action), `kubeshop/tracetest-github-action`, that installs the CLI and automatically configures the CLI using an [environment token](https://docs.tracetest.io/concepts/environment-tokens) that points to the demo:
```yaml
#...
otel-demo-trace-based-tests:
name: Run trace based tests for Open Telemetry demo
runs-on: ubuntu-latest
steps:
- name: Checkout
uses: actions/checkout@v3
- name: Configure Tracetest CLI
uses: kubeshop/tracetest-github-action@v1
with:
token: {{add-your-environment-token-here}}
```
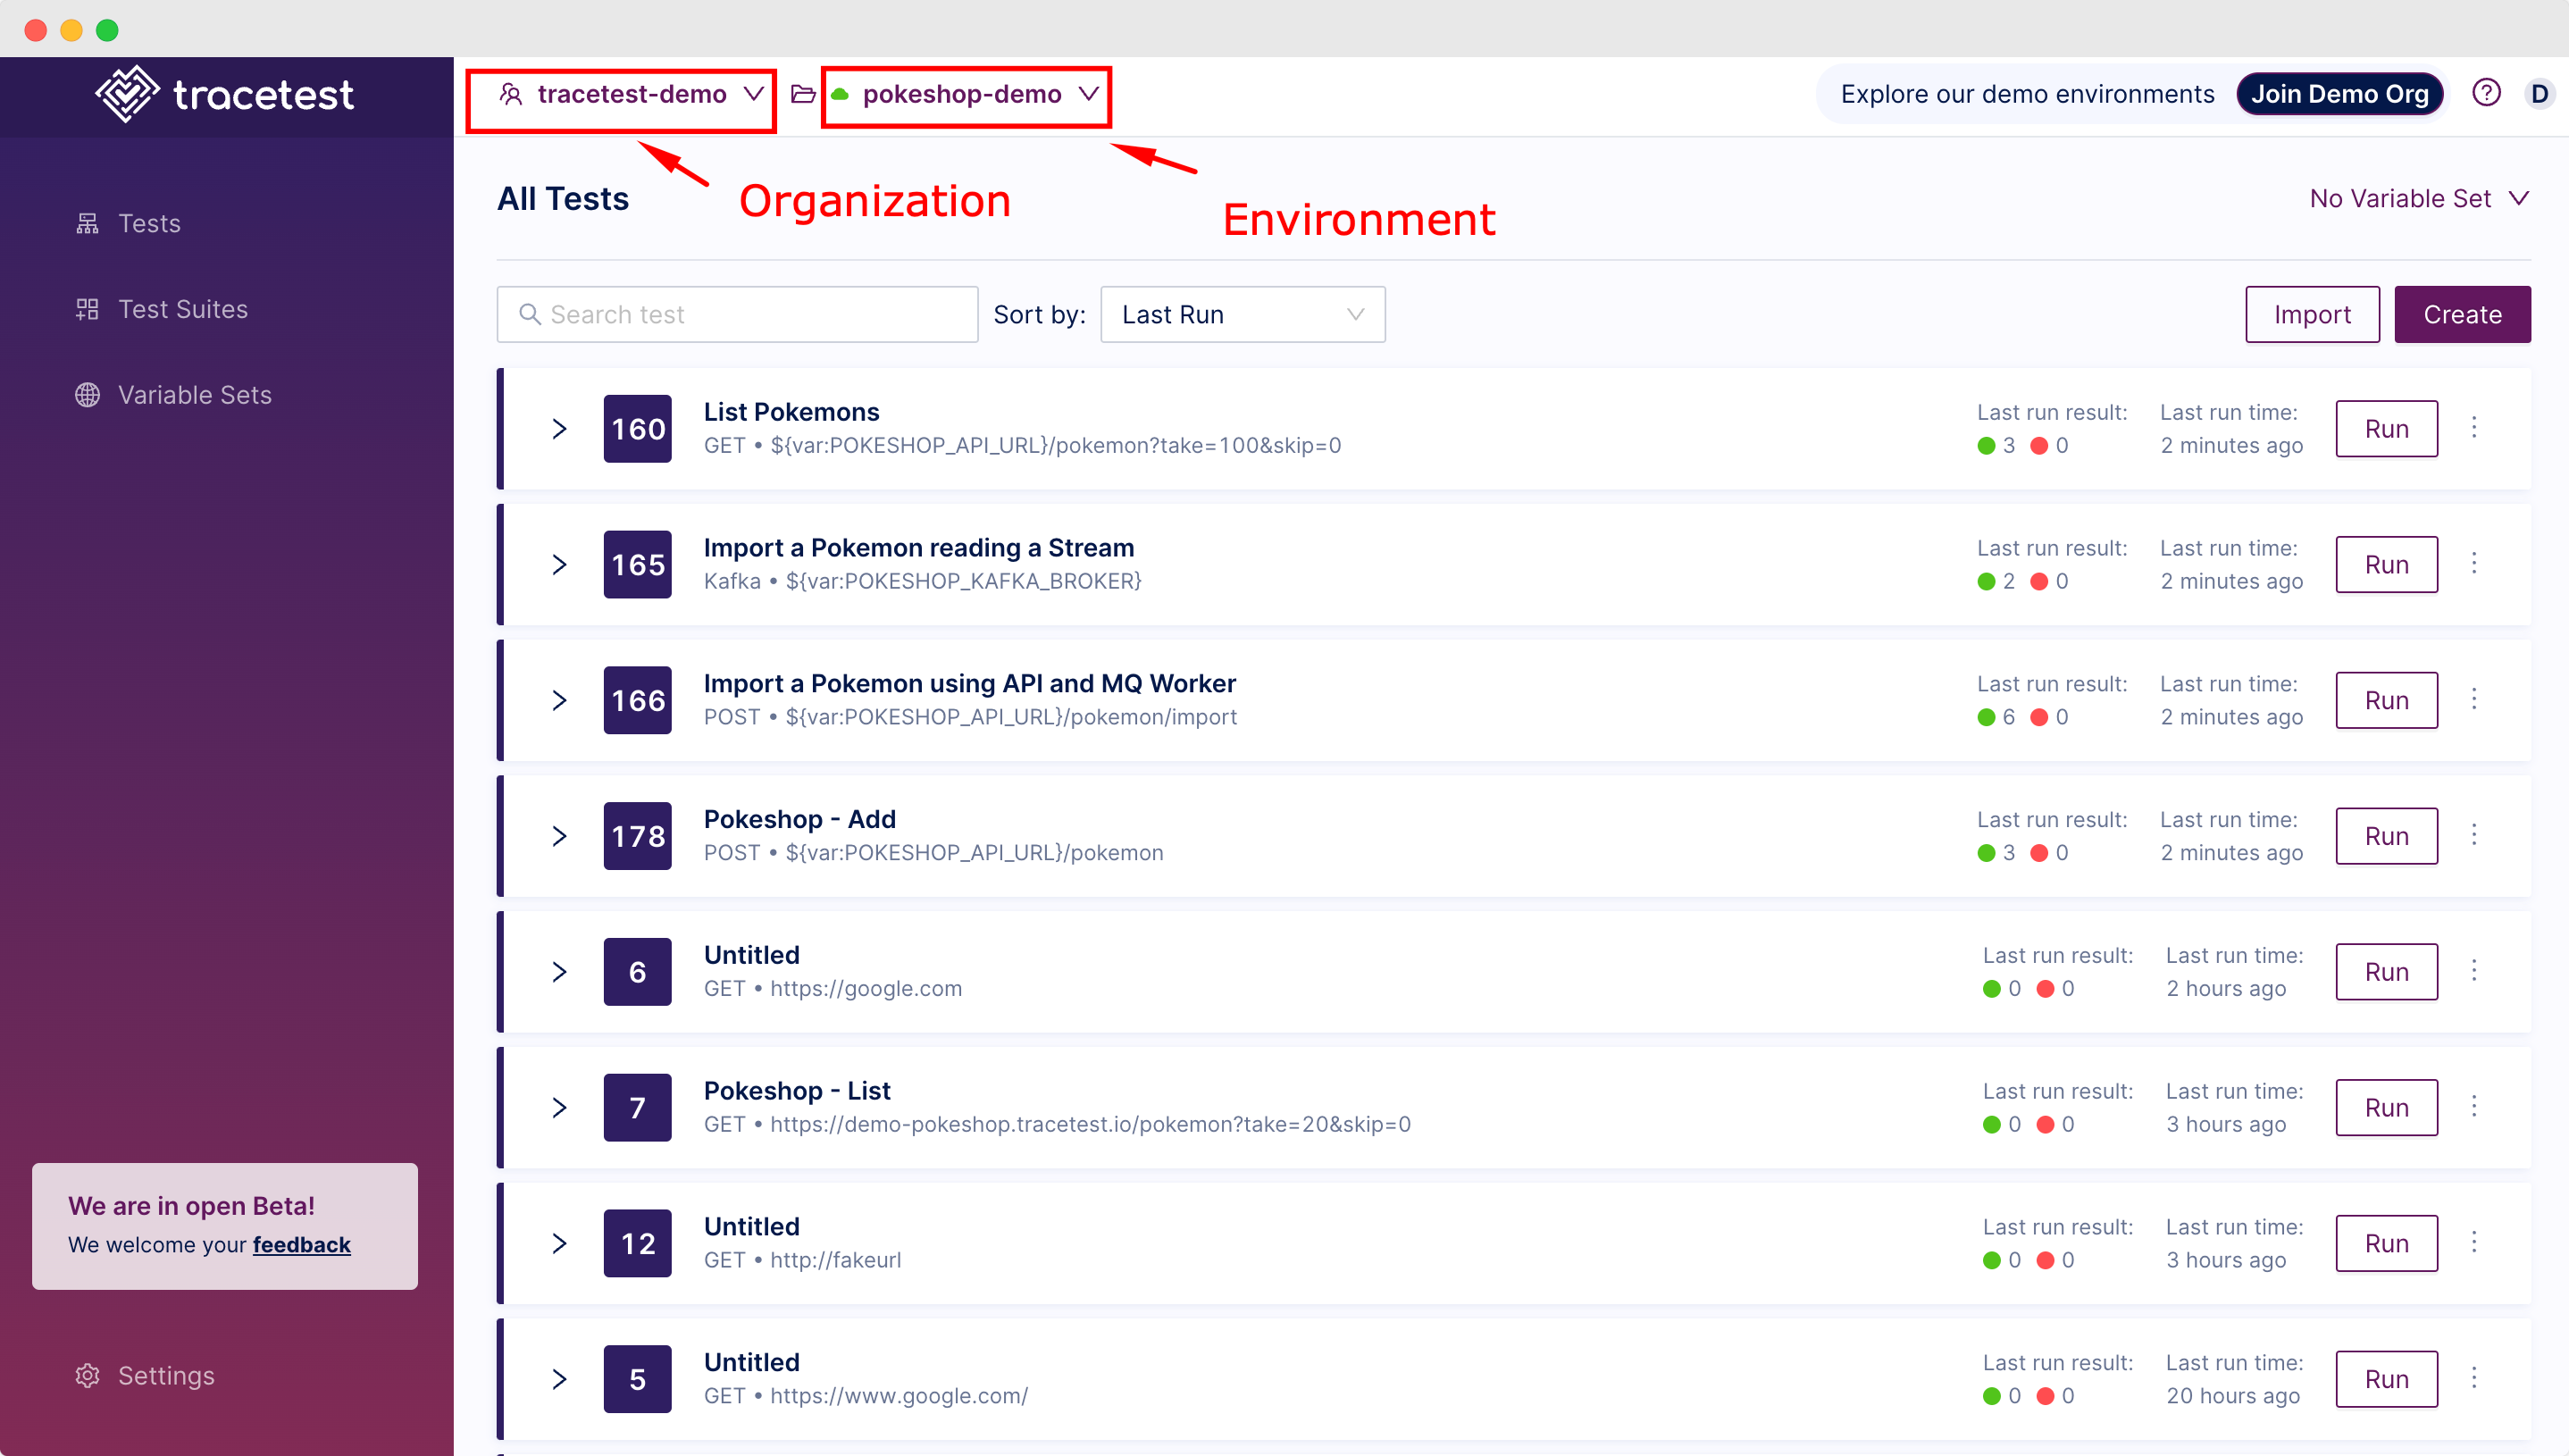
To generate an [environment token](https://docs.tracetest.io/concepts/environment-tokens), you can go to [`app.tracetest.io`](http://app.tracetest.io), log in, and choose an organization and environment:
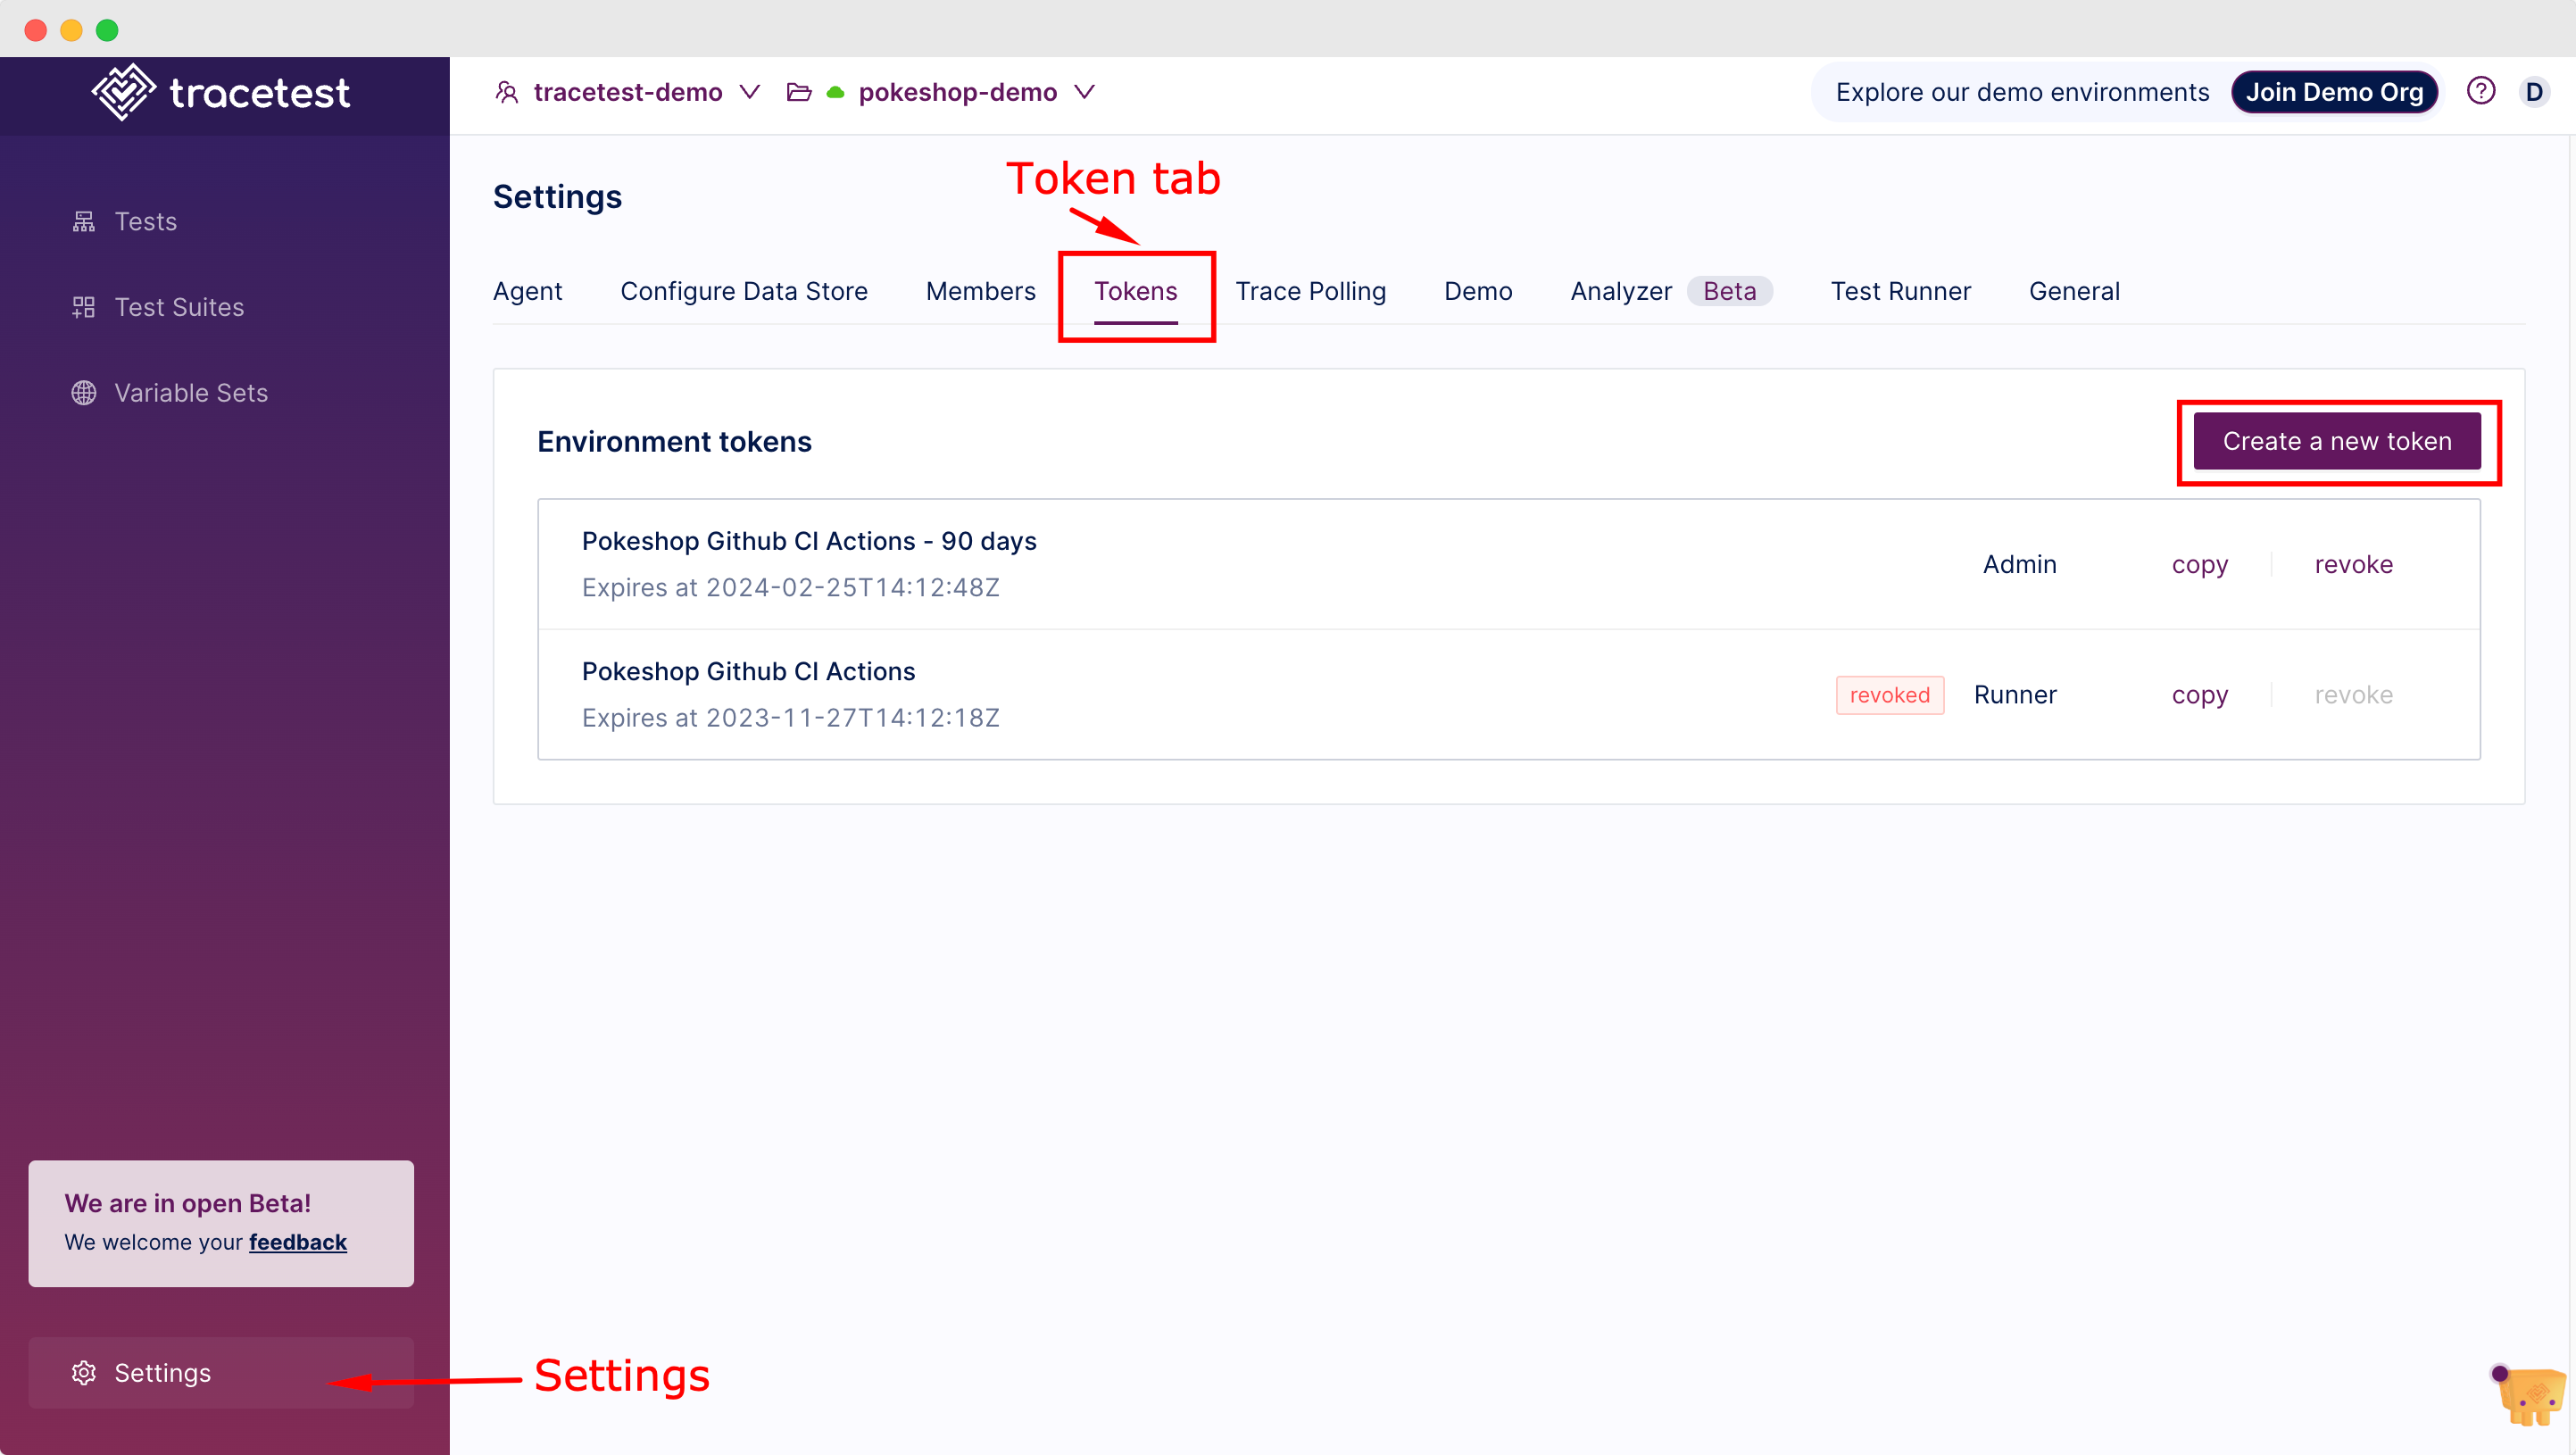
Then, click on Settings (on the left bottom corner of the screen), choose the `Token` tab, and click on `Create a new token` to generate a new token for your action.
Once you have finished and created the token and added it to the `Configure Tracetest CLI` step, in the following steps, you can run Tracetest CLI commands to trigger tests, like `tracetest run testsuite` that you used to test the synthetic monitoring test suite:
```yaml
#...
otel-demo-trace-based-tests:
name: Run trace based tests for Open Telemetry demo
runs-on: ubuntu-latest
steps:
- name: Checkout
uses: actions/checkout@v3
- name: Configure Tracetest CLI
uses: kubeshop/tracetest-github-action@v1
with:
token: ${{secrets.TRACETEST_OTELDEMO_TOKEN}}
- name: Run synthetic monitoring tests
run: |
tracetest run testsuite --file ./_testsuite.yaml --vars ./_variableset.yaml
```
As a final step, you can add a notification step that tell you if the tests failed. To do that, I'm using [`slackapi/slack-github-action`](https://github.com/slackapi/slack-github-action) that allows you to send a Slack message about the test conclusion. In my case, I've set it to send messages only in case of failures:
```yaml
#...
otel-demo-trace-based-tests:
name: Run trace based tests for Open Telemetry demo
runs-on: ubuntu-latest
steps:
- # steps defined on previous snippets...
- name: Send message on Slack in case of failure
if: ${{ failure() }}
uses: slackapi/slack-github-action@v1.24.0
with:
# check the block kit builder docs to understand how it works
# and how to modify it: https://api.slack.com/block-kit
payload: |
{
"blocks": [
{
"type": "header",
"text": {
"type": "plain_text",
"text": ":warning: Synthetic Monitoring Alert - OTel Demo :warning:",
"emoji": true
}
},
{
"type": "section",
"fields": [
{
"type": "mrkdwn",
"text": "*Status:*\nFailed"
},
{
"type": "mrkdwn",
"text": "*Pipeline:*\n<${{ github.server_url }}/${{ github.repository }}/actions/runs/${{ github.run_id }}|View workflow>"
}
]
}
]
}
env:
SLACK_WEBHOOK_URL: http://path.to.my.slack.webhook
SLACK_WEBHOOK_TYPE: INCOMING_WEBHOOK
```
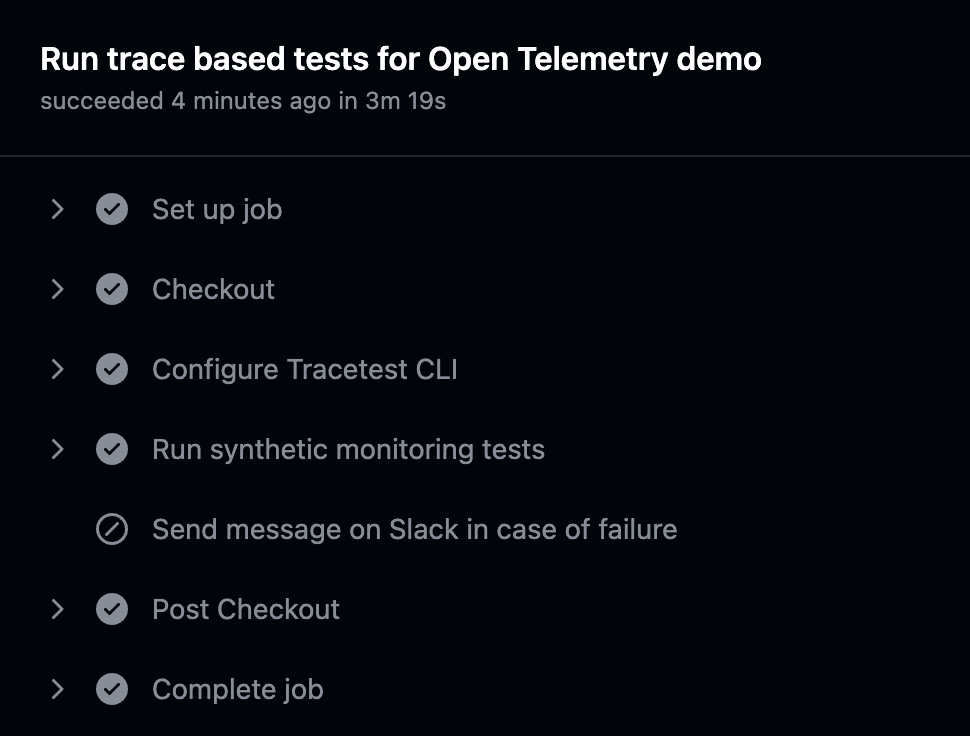
Finally, you can run the workflow manually by going to the `Actions` under your GitHub repository or wait until the schedule trigger runs your test. After running the workflow, you can see each step being executed by the GitHub workers:
For more details about this implementation, you can see the entire definition of [`.github/workflows/scheduled-jobs.yml`](https://github.com/kubeshop/tracetest/blob/main/.github/workflows/scheduled-jobs.yml) on GitHub and the open history of the running tests [here](https://github.com/kubeshop/tracetest/actions/workflows/scheduled-jobs.yml).
## Build Your Own Synthetic Monitoring
In this article, I’ve explained how the Tracetest team uses synthetic monitoring to evaluate the [Tracetest](http://Tracetest.io) open beta using GitHub Actions using Tracetest’s new [GitHub Action](https://github.com/kubeshop/tracetest-github-action) to configure GitHub Workflows. With these tools, our team can add more monitoring to [Tracetest](http://Tracetest.io) and validate that our systems are working as expected. You’re now fully equipped to implement this knowledge in your own GitHub Actions to trigger trace-based tests easily!
Would you like to learn more about Tracetest and what it brings to the table? Visit the Tracetest [docs](https://docs.tracetest.io/getting-started/installation) and try it out by [downloading](https://tracetest.io/download) it today!
Also, please feel free to join our [Slack community](https://dub.sh/tracetest-community), give [Tracetest a star on GitHub](https://github.com/kubeshop/tracetest), or schedule a [time to chat 1:1](https://calendly.com/ken-kubeshop/45min).
.jpg)
.avif)
.avif)