
Spring update: Integrations, Improving UX, and Ease of Provisioning
.avif)

The Tracetest team had two main focuses in Q1: integrations and improving ease of use. Check out the highlights from Q1 of 2023 and our roadmap for Q2!
Table of Contents
Spring has sprung, and Q1 is over! It is a perfect time to look back, see what you’ve done well, and contemplate how to improve moving forward. I want to share some of the highlights I’m most proud of from the Tracetest team in the first quarter of 2023. And also share our roadmap for Q2 moving forward.
What is Tracetest? It is an [open-source test tool](https://github.com/kubeshop/tracetest) built for any application using a distributed, cloud-native architecture. It uses the visibility exposed by your existing instrumentation, namely distributed tracing, to allow you to build integration, system, and end-to-end tests that can reach across the entire system. This technique, known as trace-based testing, allows you to assert the proper behavior of all the different microservices, lambda functions, asynchronous processes, and infrastructure components involved in a modern application. It is the ‘easy button’ for your full system tests, allowing you to create tests in orders of magnitude less time, increase your test coverage and improve quality in today’s increasingly fast-paced development and deployment cycles.
We began the quarter with a couple of major focuses:
1. Integrations
2. Improving ease of use
Let’s look at what we accomplished in each category.
## Integrations with New Distributed Tracing Solutions
Tracetest works by leveraging the distributed tracing capability you have already instrumented into your application. As part of this, we need to support a wide spectrum of observability and APM tools. We came into the quarter with integrations with multiple tracing solutions, including [Jaeger](https://www.jaegertracing.io/), [OpenSearch](https://opensearch.org/), [Grafana Tempo](https://grafana.com/oss/tempo/), SignalFX, and of course, the [OpenTelemetry Collector](https://opentelemetry.io/docs/collector/). This quarter, we added more of the most popular tracing solutions.
### Lightstep
[Lightstep](https://lightstep.com/) is a leading cloud-native reliability platform. [Adriana Villela](https://twitter.com/adrianamvillela), a developer advocate from Lightstep, was one of the first users of Tracetest way back in May 2022. Since then, she has been a vocal proponent of trace-based testing and a friend of the Tracetest project. The team worked with her to enable [Tracetest to interoperate with Lightstep](https://tracetest.io/blog/tracetest-integration-with-lightstep), enabling an [integration](https://docs.tracetest.io/examples-tutorials/recipes/running-tracetest-with-lightstep) via the [OpenTelemetry collector](https://opentelemetry.io/docs/collector/). Adriana even created a video showing Tracetest and the OTel Demo App running on [Hashicorp Nomad](https://www.nomadproject.io/) with Lightstep as the back end (of course)!
### Elastic
[Elastic](https://www.elastic.co/), the company famous for developing the ELK stack, has a very popular APM solution. Michael Hyatt, a solutions architect for Elastic, [reached out to see if we would add Elastic as a trace data source](https://github.com/kubeshop/tracetest/issues/1777), as the Elastic datastore can accept traces whether instrumented with [Elastic APM agents](https://www.elastic.co/guide/en/apm/agent/index.html) or the default OpenTelemetry instrumentation. Michael was super helpful in assisting the team as we developed and tested the [Elastic integration](https://docs.tracetest.io/examples-tutorials/recipes/running-tracetest-with-elasticapm), and even wrote the blog post which appeared on both the [Tracetest](https://tracetest.io/blog/tracetest-integration-elastic-trace-based-testing-application-performance-monitoring) and [Elastic](https://www.elastic.co/blog/trace-based-testing-elastic-apm-tracetest) sites.
### New Relic
[New Relic](https://newrelic.com/) needs no introduction, as it is a well-known observability platform. New Relic supports using the OpenTelemetry collector, so we were able to add it as a trace data source and [document the process](https://docs.tracetest.io/configuration/connecting-to-data-stores/new-relic/). The team also documented a use case contained in this recipe:
- [Running Tracetest With New Relic](https://docs.tracetest.io/examples-tutorials/recipes/running-tracetest-with-new-relic)
### AWS X-Ray
The integration with [AWS X-Ray](https://aws.amazon.com/xray/) was initiated due to conversations with two different teams with very similar use patterns. They were both using serverless architectures with AWS and needed a better way to test the critical flows. Few tools serve this area well, but Tracetest is a natural choice for testing modern distributed FaaS flows. The team quickly built an integration to [retrieve trace data from AWS X-Ray](https://docs.tracetest.io/configuration/connecting-to-data-stores/awsxray/). As importantly, the team focused on documenting use cases, as there are several options for deploying in AWS. Some of the recipes and use cases include:
- [Running Tracetest with AWS X-Ray (AWS X-Ray Node.js SDK)](https://docs.tracetest.io/examples-tutorials/recipes/running-tracetest-with-aws-x-ray)
- [Running Tracetest with AWS X-Ray (AWS X-Ray Node.js SDK & AWS Distro for OpenTelemetry)](https://docs.tracetest.io/examples-tutorials/recipes/running-tracetest-with-aws-x-ray-adot/)
- [Running Tracetest on AWS Fargate with Terraform](https://docs.tracetest.io/examples-tutorials/recipes/running-tracetest-with-aws-terraform)
- [Running Tracetest with AWS Step Functions, AWS X-Ray and Terraform](https://docs.tracetest.io/examples-tutorials/recipes/running-tracetest-with-step-functions-terraform)
- [Running Tracetest with Datadog](https://docs.tracetest.io/examples-tutorials/recipes/running-tracetest-with-datadog/)
## Cloud Native Tool Integrations
We also wanted to integrate with tools in the Open Source arena that are focused on modern, cloud-native applications. The tools we decided to integrate with this quarter both came from user inquiries asking “Do you work with k6?” and “Can Keptn use trace-based testing?”.
### k6
The initial thought to add a [k6 integration](https://docs.tracetest.io/tools-and-integrations/k6) came from Kubecon Detroit, as we had 5 or 6 different people asking “Do you work with k6?”. These k6 users could see the value in having load tests that could assert that the complete flow and all the micro-services involved perform correctly and speedily under load, rather than just having a “black box” test that barely tests past the API gateway. As part of the [rollout of this capability](https://tracetest.io/blog/announcing-the-tracetest-integration-with-k6-deep-load-testing-of-your-cloud-native-system), we participated in a wonderful k6 “Office hours” community call with the [k6](https://k6.io/) team.
### Keptn
The [Keptn integration](https://docs.tracetest.io/tools-and-integrations/keptn) was added based on two GitHub issues raised in the [Keptn community](https://keptn.sh/) ([[integration] Tracetest #48](https://github.com/keptn/integrations/issues/48) and [SLO for Traces #508](https://github.com/keptn/lifecycle-toolkit/issues/508)). The desire was to use the [OpenTelemetry instrumentation which has been adopted at the core of Keptn](https://engineering.dynatrace.com/blog/instrumenting-keptn-with-opentelemetry/) to enable tests to be built that used data from those traces. The results of these tests will be used as service level indicators as part of Keptn’s control plane to decide whether to deploy new code. The implementation was done using the Keptn Job Executor Service, which you can [read about here](https://tracetest.io/blog/announcing-the-tracetest-integration-with-keptn-the-control-plane-for-cloud-native-application-life-cycle-orchestration). Another great experience was getting invited to talk about the integration at the Keptn Community Meeting in February.
### Testkube
[Testkube](https://testkube.io/) was a natural choice for building an integration. It’s one of 4 other projects under our open-source startup accelerator, [Kubeshop](https://kubeshop.io/). Testkube has an adjacent “job to be done” with Tracetest.
Testkube is a Kubernetes-native testing framework that allows you to write tests with a number of other test frameworks, such as Cypress, k6, Postman, and others. You then run them all via Testkube. It allows you to manage the test orchestration and execution of the various tests and integrate running them into your CI/CD/GitOps pipeline.
Both Tracetest and Testkube are designed for testing cloud-native applications, and, by integrating with Testkube, we gain some useful capabilities:
- Orchestration with other tests [to make test suites](https://tracetest.io/blog/event-driven-kubernetes-testing-with-testkube-and-tracetest#running-tests-in-a-test-suite-or-transaction).
- The ability to [trigger Tracetests based on particular Kubernetes events](https://tracetest.io/blog/event-driven-kubernetes-testing-with-testkube-and-tracetest#running-event-driven-trace-based-tests).
- The ability to [schedule tests](https://tracetest.io/blog/event-driven-kubernetes-testing-with-testkube-and-tracetest#running-scheduled-trace-based-tests), enabling synthetic monitoring of your back-end distributed system.
The use cases were documented in a [blog post](https://tracetest.io/blog/event-driven-kubernetes-testing-with-testkube-and-tracetest) and a [recipe was added](https://docs.tracetest.io/examples-tutorials/recipes/running-tracetest-with-testkube) showing how to use Testkube and Tracetest together. We also participated in a workshop with the Testkube team and showcased how both tools work in action.
## Improving Ease of Use
Creating a powerful tool introducing a totally new way to test distributed applications is not enough. The tool has to be one you WANT to use. This is continually top of mind for the entire Tracetest team, and we had several areas of improvement for this quarter.
### Transactions and Chaining Tests, v2
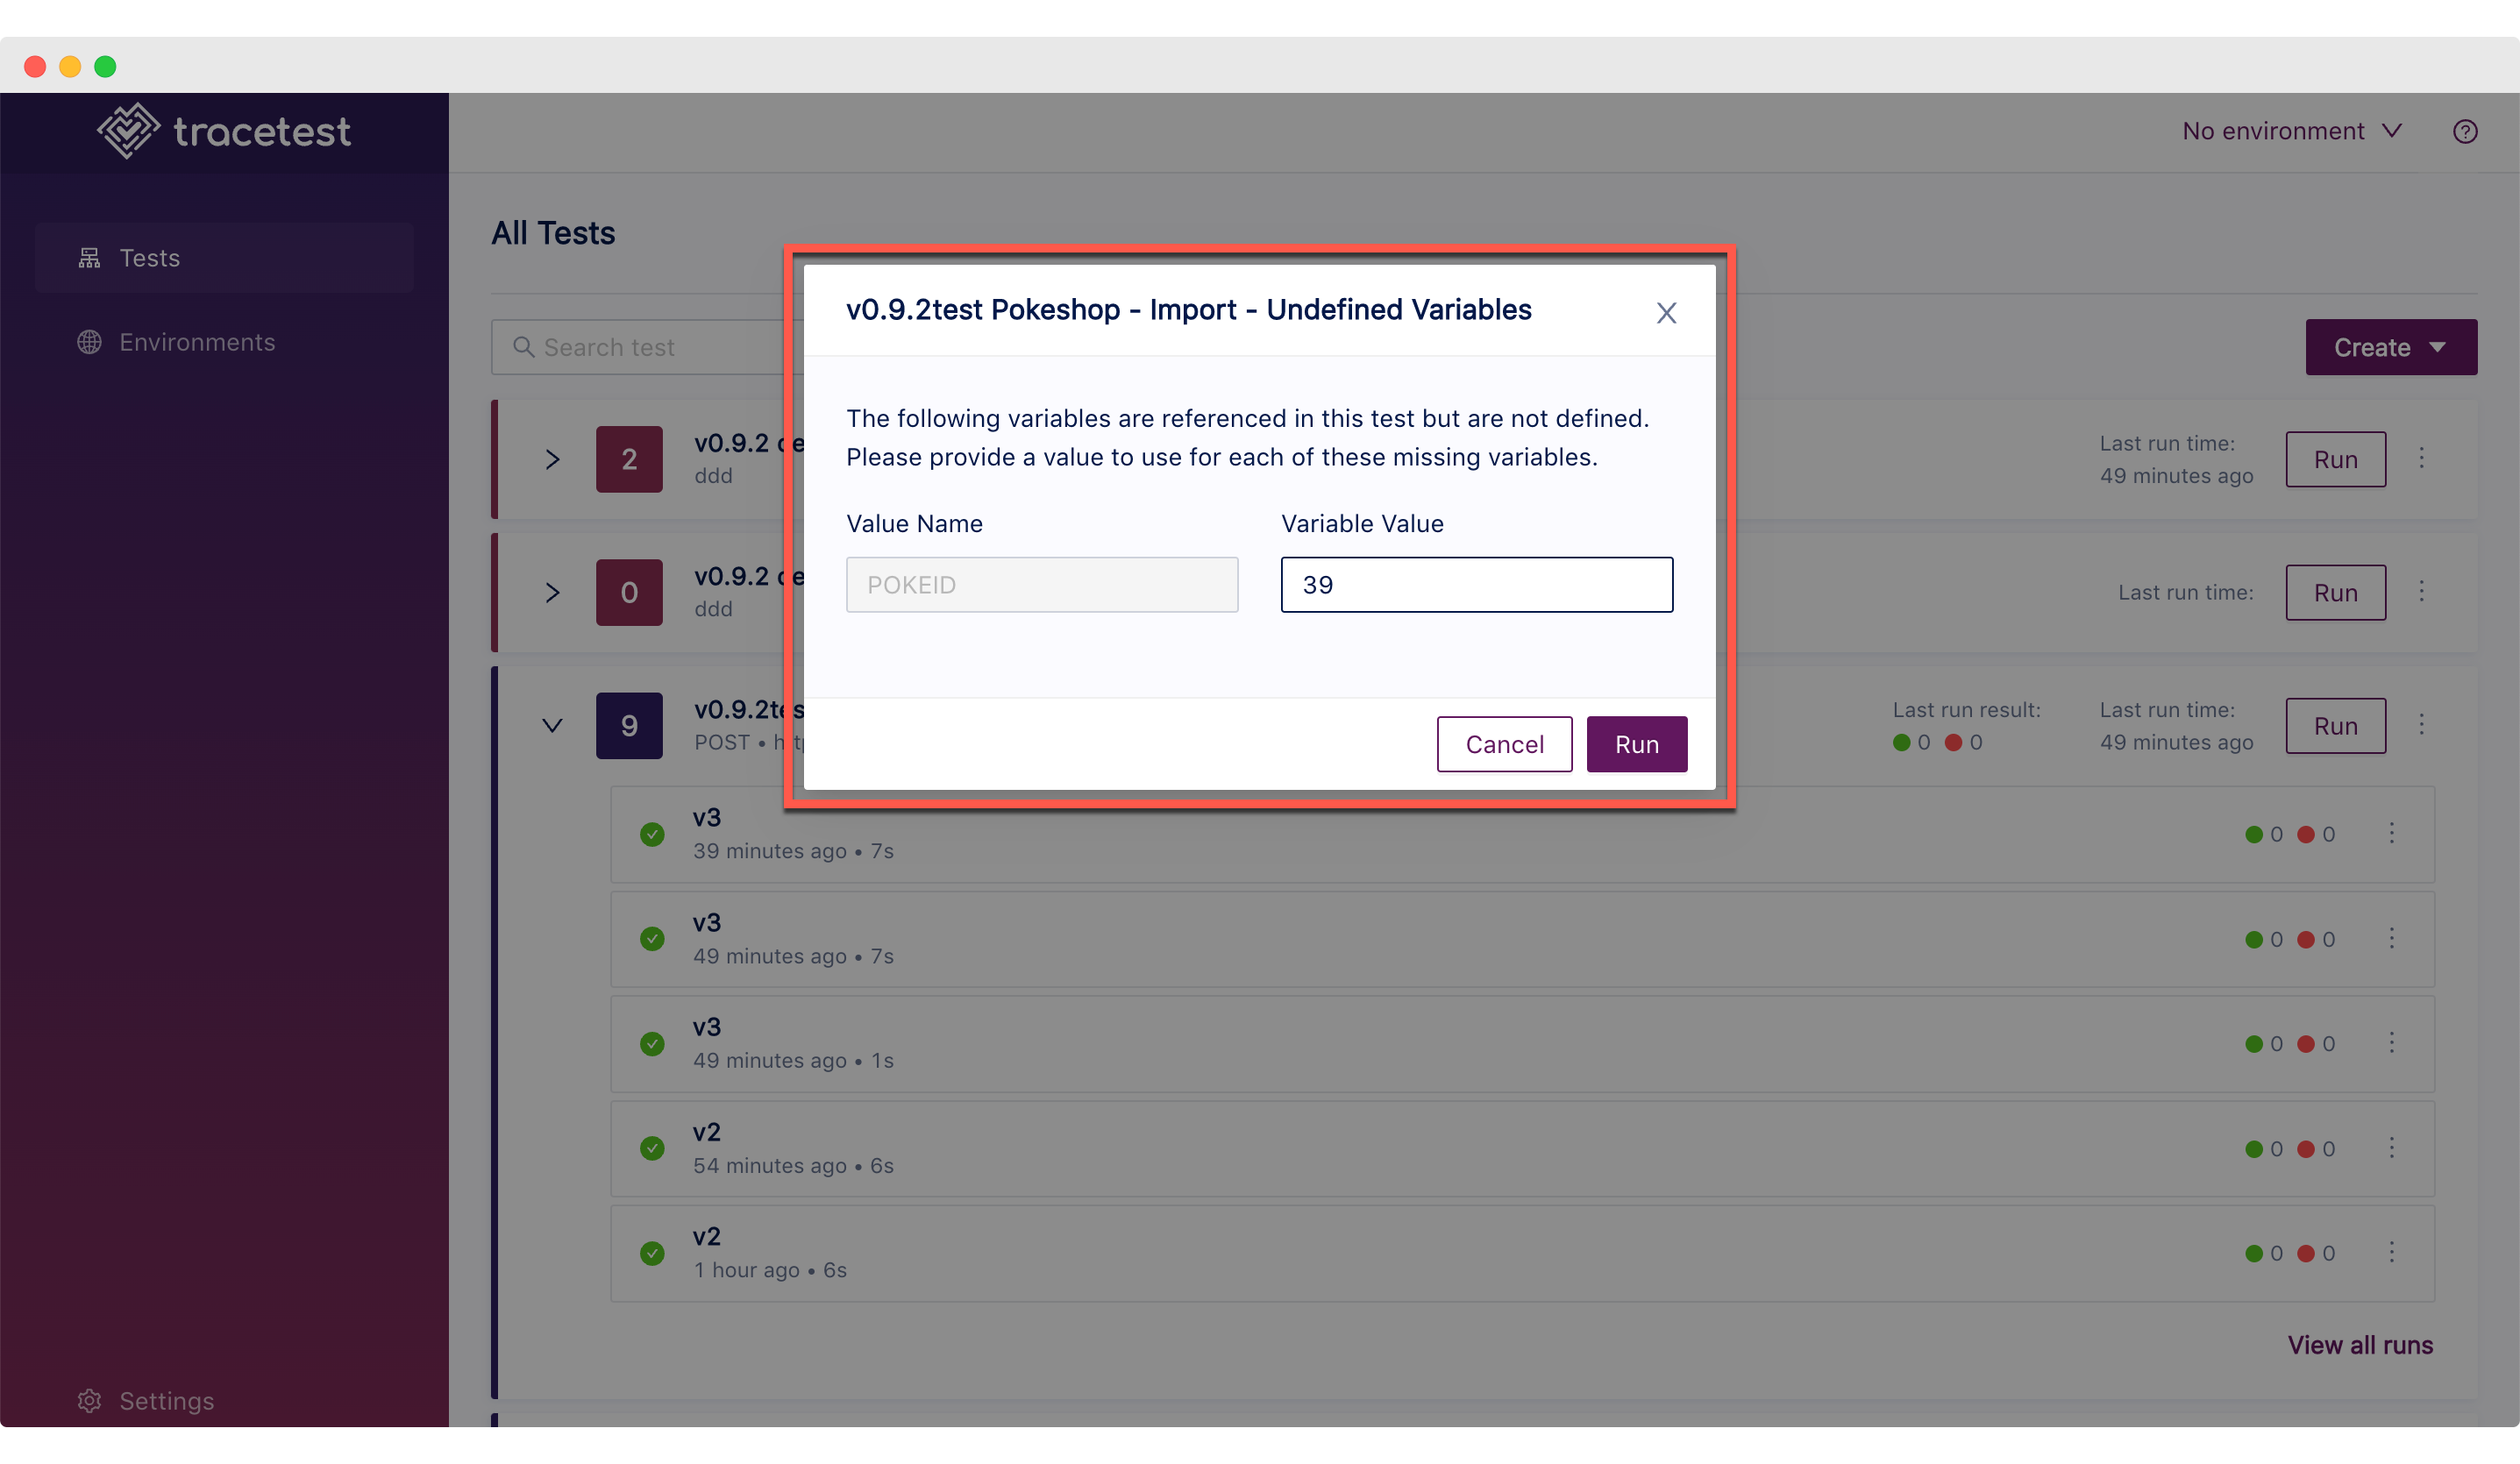
Software development is a process, and perfection on the first pass often results in paralysis. With the [release of v0.8 a couple of months earlier](https://tracetest.io/blog/v08-release-notes), we introduced the ability to chain tests, have variables in tests, and define environments such as Test, QA, or Prod. To call this a huge release would be accurate, and we knew there were UX flows that could be improved. We documented these and tackled a [‘Chaining V2’ epic](https://github.com/kubeshop/tracetest/issues/1655) at the beginning of the quarter. Of the 15 issues tackled in this epic, the [enabling of ad-hoc tests by prompting for undefined variables](https://tracetest.io/blog/ad-hoc-testing-of-distributed-systems) was my favorite. This allows you to leave a particular input “blank”, run a test, and have Tracetest prompt you each time for the value to run the test with. This is particularly useful when developing and you want to test with numerous values interactively.
### Moving Settings Into the User Interface
With the initial version of Tracetest, we had a configuration file that contained all settings: how to connect to the trace data store, how often to poll for a trace and when to timeout, and a few other settings. This presented several challenges:
- The server had to be rebooted to accept any changes to the configuration.
- The sections in the configuration file were hard to document and understand.
- Errors in the configuration file could cause the server not to start.
All these issues impacted usability, particularly for new users. In December, [we moved the configuration of the trace data stores into the application](https://tracetest.io/blog/v09-release-notes), making a critical, error-prone step much easier to successfully complete.
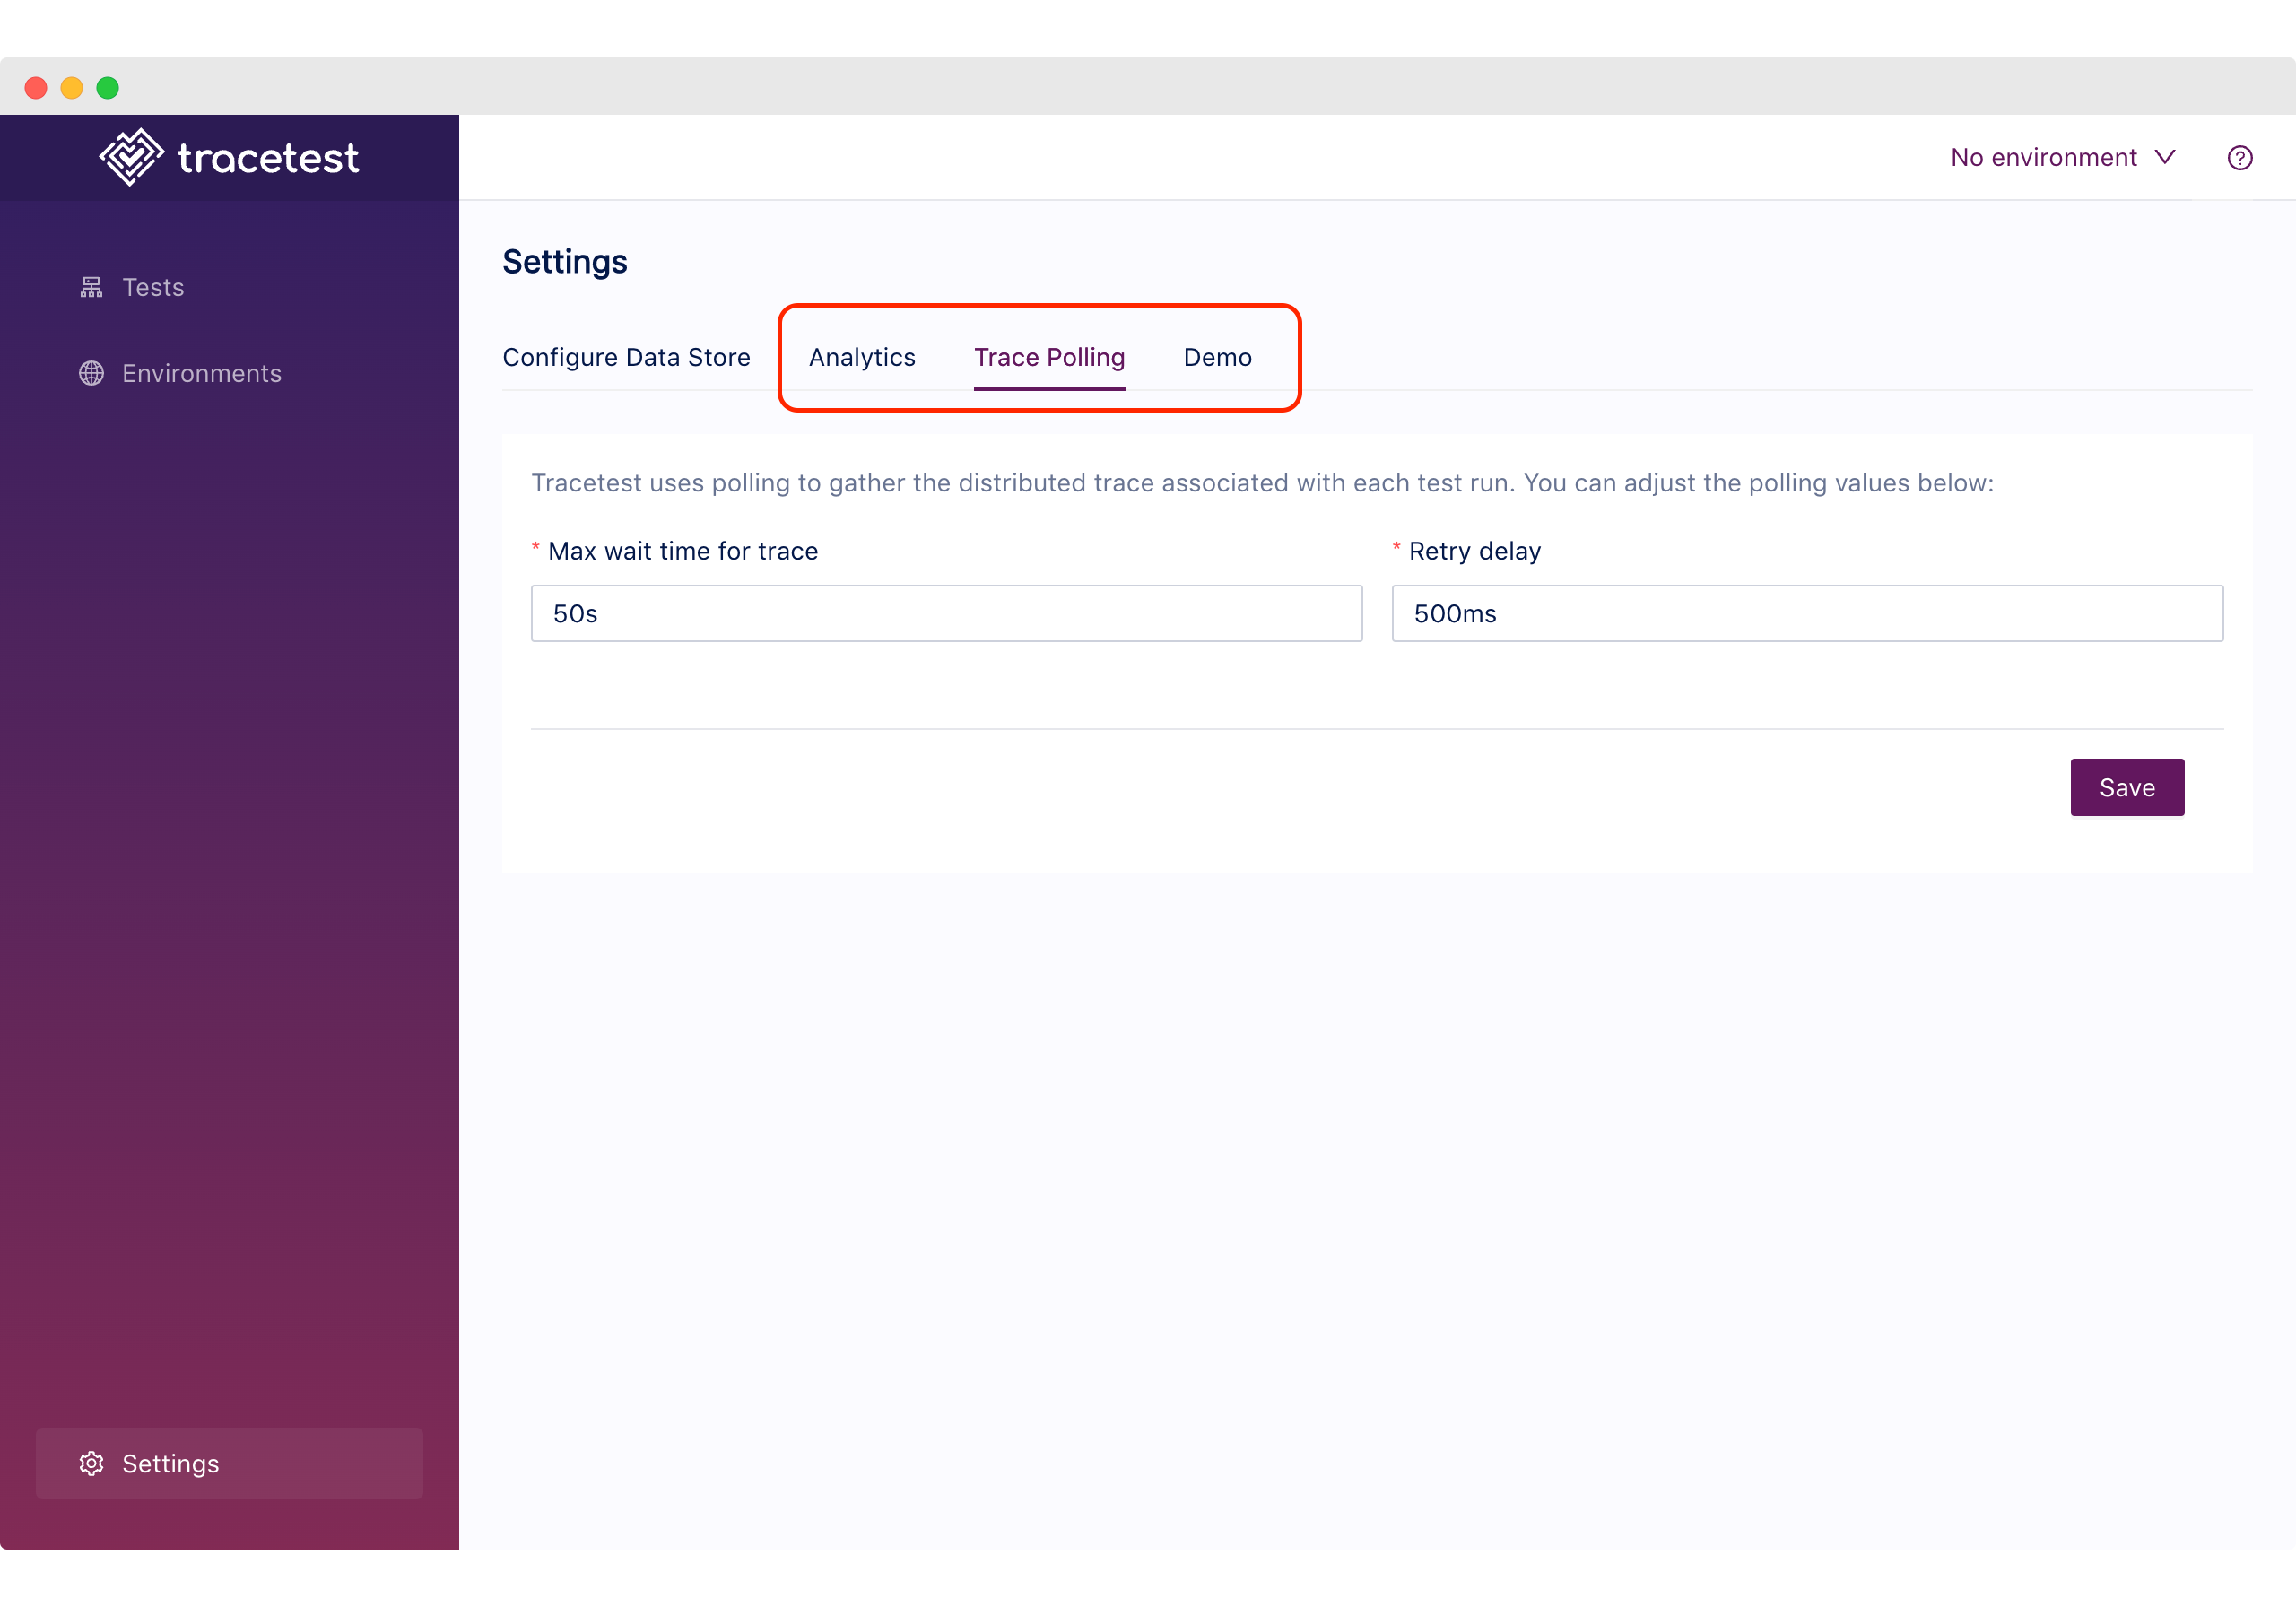
This quarter, we completed the process by adding three new tabs - [Analytics](https://docs.tracetest.io/configuration/analytics), [Trace Polling](https://docs.tracetest.io/configuration/trace-polling), and [Demo](https://docs.tracetest.io/configuration/demo). We also added the ability to alter the server configuration via the CLI, making sure any of the changes which can be done on the UI can be done in an automated manner.
### Multiple Ways to Provision a New Install
Speaking of being able to configure a server from the command line, the team added multiple ways to configure a server. These include [using a provisioning file](https://docs.tracetest.io/configuration/provisioning) to “hydrate” the server and passing the provisioning file as a [base64 encoded string via an environment variable](https://docs.tracetest.io/configuration/server), perfect when deploying Tracetest in an ECS cluster so there is no need to mount a file. The only “required” data to start the Tracetest server is the Postgres connection information, and it can now be [passed as environment variables as well as via a configuration file](https://docs.tracetest.io/configuration/server). This capability was covered in detail in our March community call:
## Looking Forward
For Q2, the team will be doubling down on integrations, with plans to add Azure Application Insights, Google Cloud Trace, and Honeycomb as supported trace data stores. We are also looking for a couple of tool integrations to add and would [love your ideas and input](https://github.com/kubeshop/tracetest/issues/new?assignees=&labels=feature+request%2C+triage&template=feature_request.md&title=).
One area we are considering investing in is enabling Tracetest tests to be run as a synthetic monitor against your API, enabling you to schedule Tracetest tests and be alerted when they fail. This would enable deep end-to-end tests to be easily created and used to “keep an eye on” and alert the SRE and DevOps teams about potential failures. We would love your thoughts on using trace-based tests for synthetic monitoring - do you need it!? [Let us know in Slack](https://dub.sh/tracetest-community)!
Adnan and I will be at the Tracetest booth in KubeCon Europe this month! Come by, see us, and discuss any and all things OpenTelemetry, distributed tracing, testing, trace-based testing, and Tracetest. Would love to show you the tool, get your thoughts, and hear your ideas. Reach out to [myself](https://www.linkedin.com/in/ken-hamric-016b1420/) or [Adnan](https://www.linkedin.com/in/adnanrahic/) on LinkedIn and we will set up a time for a chat.
Lastly, our birthday is coming up. Tracetest will be 1 year old on April 26th!!! We have a goal of hitting 500 stars by our birthday. We are currently at 474, so we need your help at [github.com/kubeshop/tracetest](https://github.com/kubeshop/tracetest).
.jpg)
.avif)
.avif)