
OpenTelemetry Trace Context Propagation for gRPC Streams
.avif)

Tracing operations in gRPC streams can be tricky. Check out this comprehensive guide on how to implement trace context propagation for gRPC streams using OpenTelemetry.
Table of Contents
gRPC is a modern, open-source remote procedure call (RPC) framework developed by Google and broadly adopted today through many enterprise systems. Built on the HTTP/2 protocol, it is commonly used in microservices architecture because of its performance and support for communication between services written in different programming languages.
One interesting feature of gRPC is its ability to enable communication via streaming. This allows systems to listen to these streams and fetch data as it is available instead of making polling strategies to external systems to get their data, which avoids overloading the consumer of the data with requests.
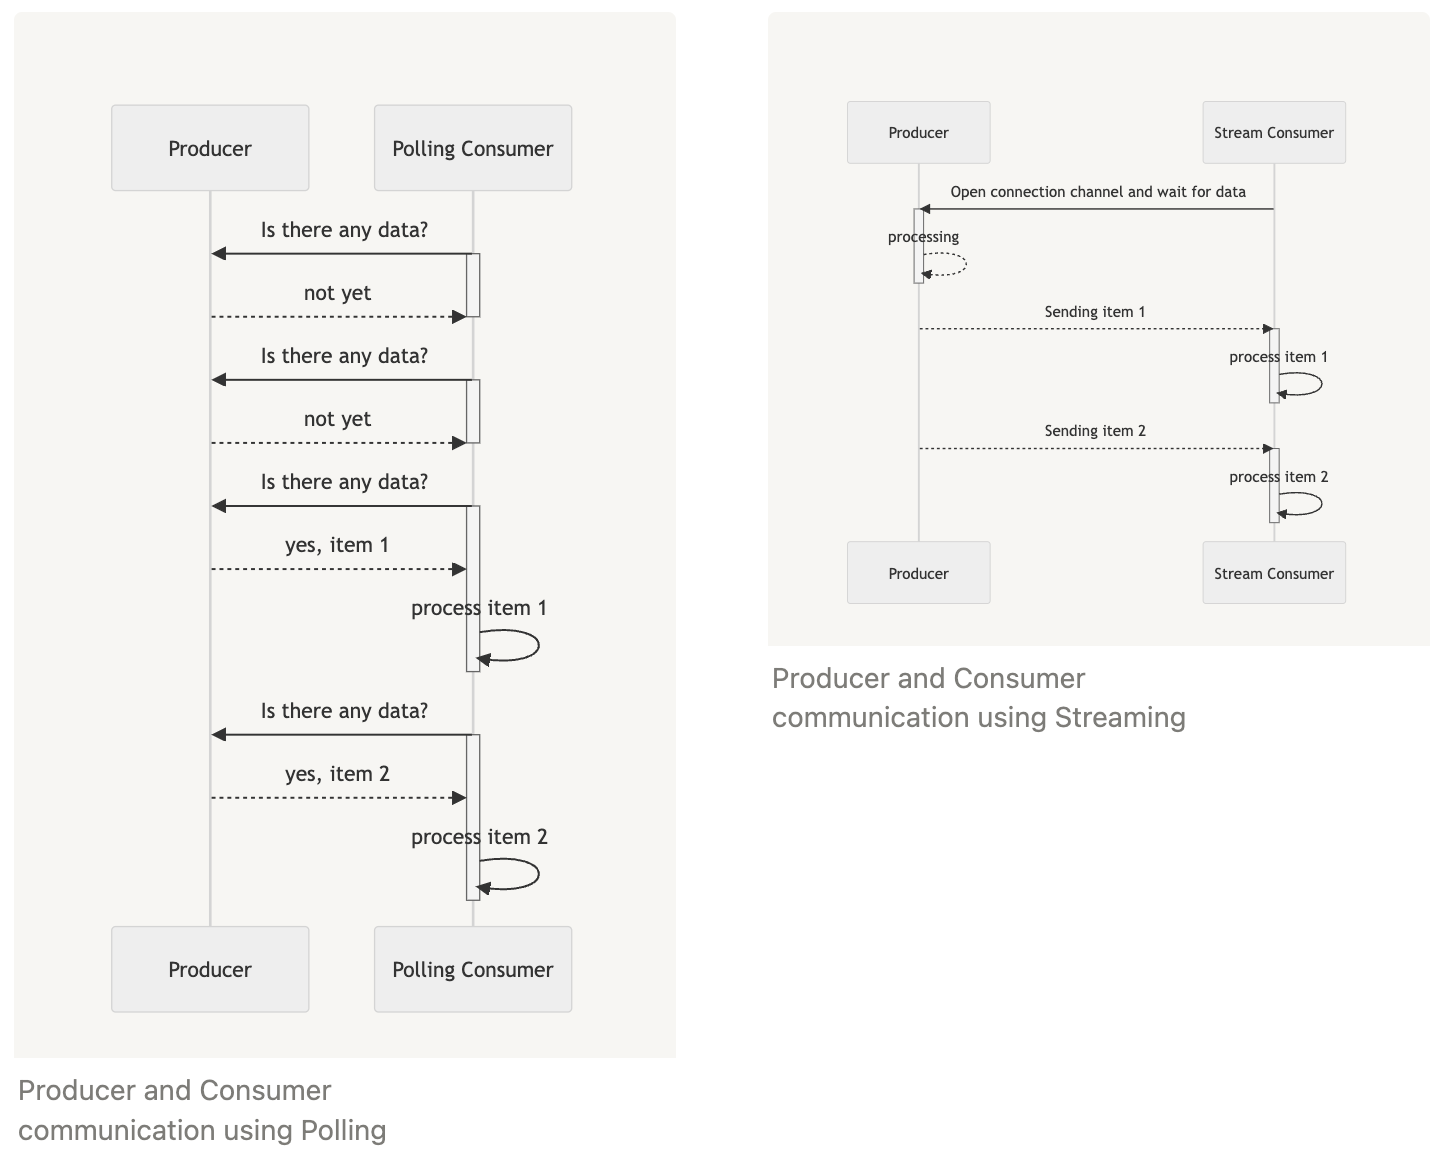
In this article, you will see an example of a system written in Go that uses gRPC streams to send data to consumers and learn:
1. how to instrument it with Traces using OpenTelemetry;
2. how to set the context propagation to track the processing of each data item;
3. how to test it and guarantee that the data item is properly processed.
The code sample for this article is available [here](https://github.com/kubeshop/tracetest/tree/main/examples/quick-start-grpc-stream-propagation), and you can run it with:
```bash
git clone git@github.com:kubeshop/tracetest.git
cd ./examples/quick-start-grpc-stream-propagation
TRACETEST_API_KEY=your-api-key docker compose up -d
```
## Using gRPC Streams to Communicate Between Systems
Suppose you have a system written in Go that receives user payments and notifies a worker that this payment has arrived, identifies if it is a high-value payment, and to do further processing:
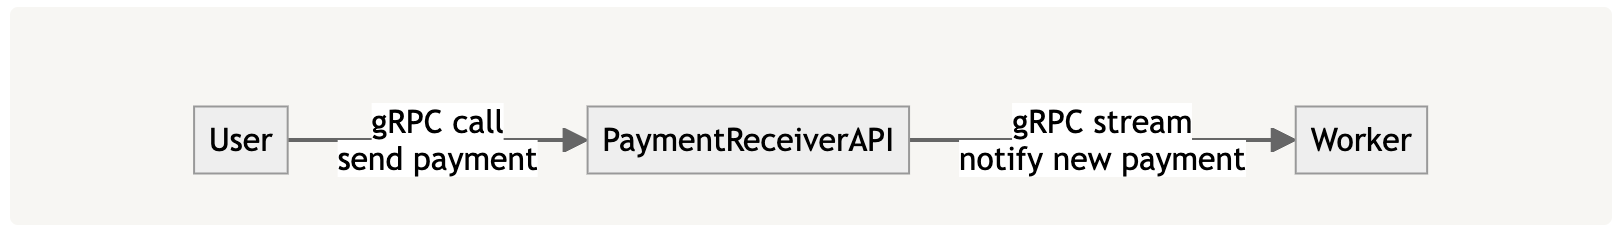
To avoid asking the `PaymentReceiverAPI`for notifications, you model two endpoints: `ReceivePayment` to receive payments and `NotifyPayment` to emit these notifications. You can specify it with the following `protobuf` file (full example [here](https://github.com/kubeshop/tracetest/blob/main/examples/quick-start-grpc-stream-propagation/proto/paymentreceiver.proto)):
```protobuf
syntax = "proto3";
package proto;
option go_package = "your.module.path/proto";
service PaymentReceiver {
rpc ReceivePayment(Payment) returns (ReceivePaymentResponse) {}
rpc NotifyPayment(Empty) returns (stream PaymentNotification) {}
}
message Empty {}
message Payment {
string customerId = 1;
float amount = 2;
}
message ReceivePaymentResponse {
bool received = 1;
}
message PaymentNotification {
Payment payment = 1;
bool highValuePayment = 2;
}
```
In a simple implementation for the PaymentReceiverAPI (full implementation [here](https://github.com/kubeshop/tracetest/blob/main/examples/quick-start-grpc-stream-propagation/producer-api/main.go)), `ReceivePayment` will enqueue the request for further processing, telling the user that it was received while processing the item:
```go
package main
import (
// ...
pb "your.module.path/proto"
)
type serverImpl struct { // Implement the PaymentReceiverServer interface
pb.PaymentReceiverServer
}
var paymentChannel = make(chan *pb.Payment) // act as an "in-memory" queue
func (s *serverImpl) ReceivePayment(ctx context.Context, payment *pb.Payment) (*pb.ReceivePaymentResponse, error) {
go func() { // enqueue payment
paymentChannel <- payment
}()
return &pb.ReceivePaymentResponse{Received: true}, nil
}
// to continue
```
While `NotifyPayment` will read from this queue, detect if the payment has a high value, and publish it into a stream:
```go
func (s *serverImpl) NotifyPayment(_ *pb.Empty, stream pb.PaymentReceiver_NotifyPaymentServer) error {
for {
payment, ok := <-paymentChannel //dequeue
if !ok {
return nil
}
highValuePayment := payment.Amount > 10_000
notification := &pb.PaymentNotification{
Payment: payment,
HighValuePayment: highValuePayment,
}
if err := stream.Send(notification); err != nil {
return err
}
}
}
```
As a consumer, you can create a simple worker that will consume the gRPC API and call the `NotifyPayment` endpoint, opening a stream connection and receiving notifications as they are available through the stream, with the command `stream.Recv()` (full example [here](https://github.com/kubeshop/tracetest/blob/main/examples/quick-start-grpc-stream-propagation/consumer-worker/main.go)):
```go
package main
import (
// ...
pb "your.module.path/proto"
)
func main() {
ctx := context.Background()
grpcClient, err := grpc.NewClient(/* ... */)
if err != nil {
log.Fatalf("could not connect to producer API: %v", err)
}
log.Printf("Connected to producer API at %s", producerAPIAddress)
client := pb.NewPaymentReceiverClient(grpcClient)
stream, err := client.NotifyPayment(ctx, &pb.Empty{}, grpc.WaitForReady(true))
if err != nil {
log.Fatalf("could not receive payment notifications: %v", err)
}
log.Printf("Listening for payment notifications...")
for {
notification, err := stream.Recv()
if err == io.EOF {
log.Printf("No more payment notifications")
return
}
if err != nil {
log.Fatalf("could not receive payment notification: %v", err)
}
// process notifications
processPaymentNotification(notification)
}
}
func processPaymentNotification(notification *pb.PaymentNotification) {
log.Printf("Received payment notification: %v", notification)
}
```
Using [grpcurl](https://github.com/fullstorydev/grpcurl), you can simulate a customer adding a payment of $50000 by calling your service with the following command:
```bash
grpcurl -plaintext -proto ./proto/paymentreceiver.proto -d '{ "customerId": "1234", "amount": 50000 }' localhost:8080 proto.PaymentReceiver/ReceivePayment
# It should output:
# {
# "received": true
# }
```
Also, you should see the following output from the consumer:
```bash
Received payment notification: payment:{customerId:"1234" amount:50000} highValuePayment:true}
```
## Adding OpenTelemetry to the System
[OpenTelemetry](https://opentelemetry.io/) is an open-source observability framework for generating, capturing, and collecting telemetry data such as logs, metrics, and traces from software services and applications. For this article, we will focus on configuring traces in the system, so you can see the entire distributed operation of processing a payment.
First, you need to set up a basic infrastructure, with an [OpenTelemetry (OTel) Collector](https://github.com/open-telemetry/opentelemetry-collector) to receive traces and [Jaeger](https://www.jaegertracing.io/) to store them, structuring the system like this:
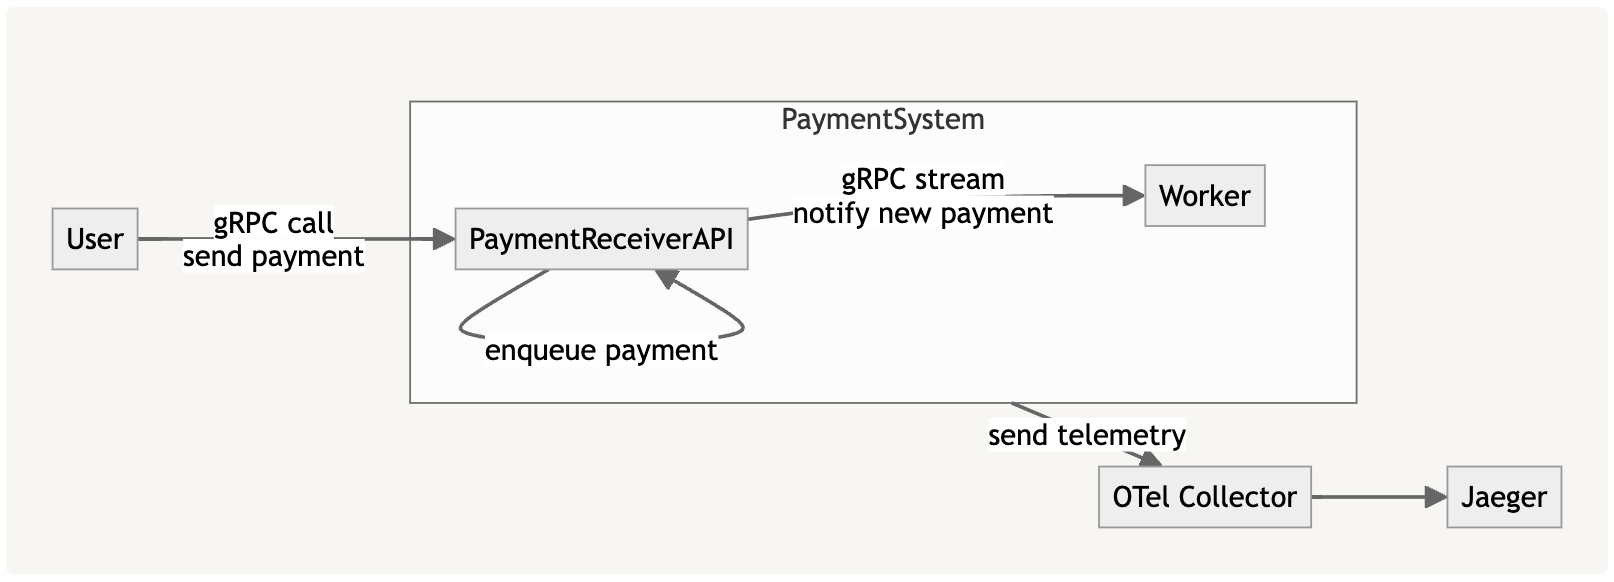
To simplify the setup, you will set up both in a `docker-compose.yaml` file (full example [here](https://github.com/kubeshop/tracetest/blob/main/examples/quick-start-grpc-stream-propagation/docker-compose.yaml#L42)), like this:
```yaml
services:
otel-collector:
image: otel/opentelemetry-collector-contrib:0.101.0
command:
- "--config"
- "/otel-local-config.yaml"
volumes:
- ./collector.config.yaml:/otel-local-config.yaml
ports:
- 4317:4317
depends_on:
jaeger:
condition: service_started
jaeger:
image: jaegertracing/all-in-one:latest
restart: unless-stopped
ports:
- 16686:16686
- 16685:16685
environment:
- COLLECTOR_OTLP_ENABLED=true
healthcheck:
test: ["CMD", "wget", "--spider", "localhost:16686"]
interval: 1s
timeout: 3s
retries: 60
```
A local `collector.config.yaml` will be used to configure the OTel Collector to receive traces and send them to Jaeger:
```yaml
receivers:
otlp:
protocols:
grpc:
http:
processors:
batch:
timeout: 100ms
exporters:
logging:
loglevel: debug
otlp/jaeger:
endpoint: jaeger:4317
tls:
insecure: true
service:
pipelines:
traces/1:
receivers: [otlp]
processors: [batch]
exporters: [otlp/jaeger]
```
You can run both locally on your machine by executing `docker compose up` in the folder where you set up the files, with access to the Jaeger UI through [`http://localhost:16686/`](http://localhost:16686/).
After configuring the infra, you will start to instrument your code by sending data to it. Since both the PaymentReceiverAPI and the Worker are written in Go, you will use [OpenTelemetry Go](https://github.com/open-telemetry/opentelemetry-go) to set up basic instrumentation and [OpenTelemetry Go Contrib](https://github.com/open-telemetry/opentelemetry-go-contrib) to instrument the gRPC server and client.
Add the following functions to your code to configure basic instrumentation:
```go
// ...
const spanExporterTimeout = 1 * time.Minute
func setupOpenTelemetry(ctx context.Context, otelExporterEndpoint, serviceName string) (trace.Tracer, error) {
log.Printf("Setting up OpenTelemetry with exporter endpoint %s and service name %s", otelExporterEndpoint, serviceName)
spanExporter, err := getSpanExporter(ctx, otelExporterEndpoint)
if err != nil {
return nil, fmt.Errorf("failed to setup span exporter: %w", err)
}
traceProvider, err := getTraceProvider(spanExporter, serviceName)
if err != nil {
return nil, fmt.Errorf("failed to setup trace provider: %w", err)
}
return traceProvider.Tracer(serviceName), nil
}
func getSpanExporter(ctx context.Context, otelExporterEndpoint string) (sdkTrace.SpanExporter, error) {
ctx, cancel := context.WithTimeout(ctx, spanExporterTimeout)
defer cancel()
conn, err := grpc.NewClient(
otelExporterEndpoint,
grpc.WithTransportCredentials(insecure.NewCredentials()),
)
if err != nil {
return nil, fmt.Errorf("failed to create gRPC connection to collector: %w", err)
}
traceExporter, err := otlptracegrpc.New(ctx, otlptracegrpc.WithGRPCConn(conn))
if err != nil {
return nil, fmt.Errorf("failed to create trace exporter: %w", err)
}
return traceExporter, nil
}
func getTraceProvider(spanExporter sdkTrace.SpanExporter, serviceName string) (*sdkTrace.TracerProvider, error) {
defaultResource := resource.Default()
mergedResource, err := resource.Merge(
defaultResource,
resource.NewWithAttributes(
defaultResource.SchemaURL(),
semconv.ServiceNameKey.String(serviceName),
),
)
if err != nil {
return nil, fmt.Errorf("failed to create otel resource: %w", err)
}
tp := sdkTrace.NewTracerProvider(
sdkTrace.WithBatcher(spanExporter),
sdkTrace.WithResource(mergedResource),
)
otel.SetTracerProvider(tp)
otel.SetTextMapPropagator(
propagation.NewCompositeTextMapPropagator(
propagation.TraceContext{},
propagation.Baggage{},
),
)
return tp, nil
}
```
This `setupOpenTelemetry` function will configure a `spanExporter` to send telemetry data to the OTel Collector via gRPC with the address specified with `otelExporterEndpoint` (which can be [`localhost:4317`](http://localhost:4317) if you are running your API locally, or `otel-collector:4317` if you are running the API inside docker), and then set up a `traceProvider` globally to start capturing traces.
You can call this function from your entrypoint in `main` with code like this ([PaymentReceiver API example](https://github.com/kubeshop/tracetest/blob/main/examples/quick-start-grpc-stream-propagation/producer-api/main.go#L83) and [Worker example](https://github.com/kubeshop/tracetest/blob/main/examples/quick-start-grpc-stream-propagation/consumer-worker/main.go#L22)):
```go
func main() {
otelExporterEndpoint := // ...
otelServiceName := // ...
tracer, err := setupOpenTelemetry(context.Background(), otelExporterEndpoint, otelServiceName)
if err != nil {
log.Fatalf("failed to initialize OpenTelemetry: %v", err)
return
}
// ...
}
```
Finally, you need to configure both the gRPC server and clients to start creating spans for each operation by setting up the OTel Contrib middleware:
```go
// in server
grpcServer := grpc.NewServer(
grpc.StatsHandler(otelgrpc.NewServerHandler()),
)
// in client
grpcClient, err := grpc.NewClient(
/* ... */,
grpc.WithStatsHandler(otelgrpc.NewClientHandler()),
)
```
Now you can run the system again with OpenTelemetry. To see that it is working you can execute another [grpcurl](https://github.com/fullstorydev/grpcurl) and check in Jaeger to see it registered:
```bash
grpcurl -plaintext -proto ./proto/paymentreceiver.proto -d '{ "customerId": "1234", "amount": 50000 }' localhost:8080 proto.PaymentReceiver/ReceivePayment
# after result, go to http://localhost:16686/search
```
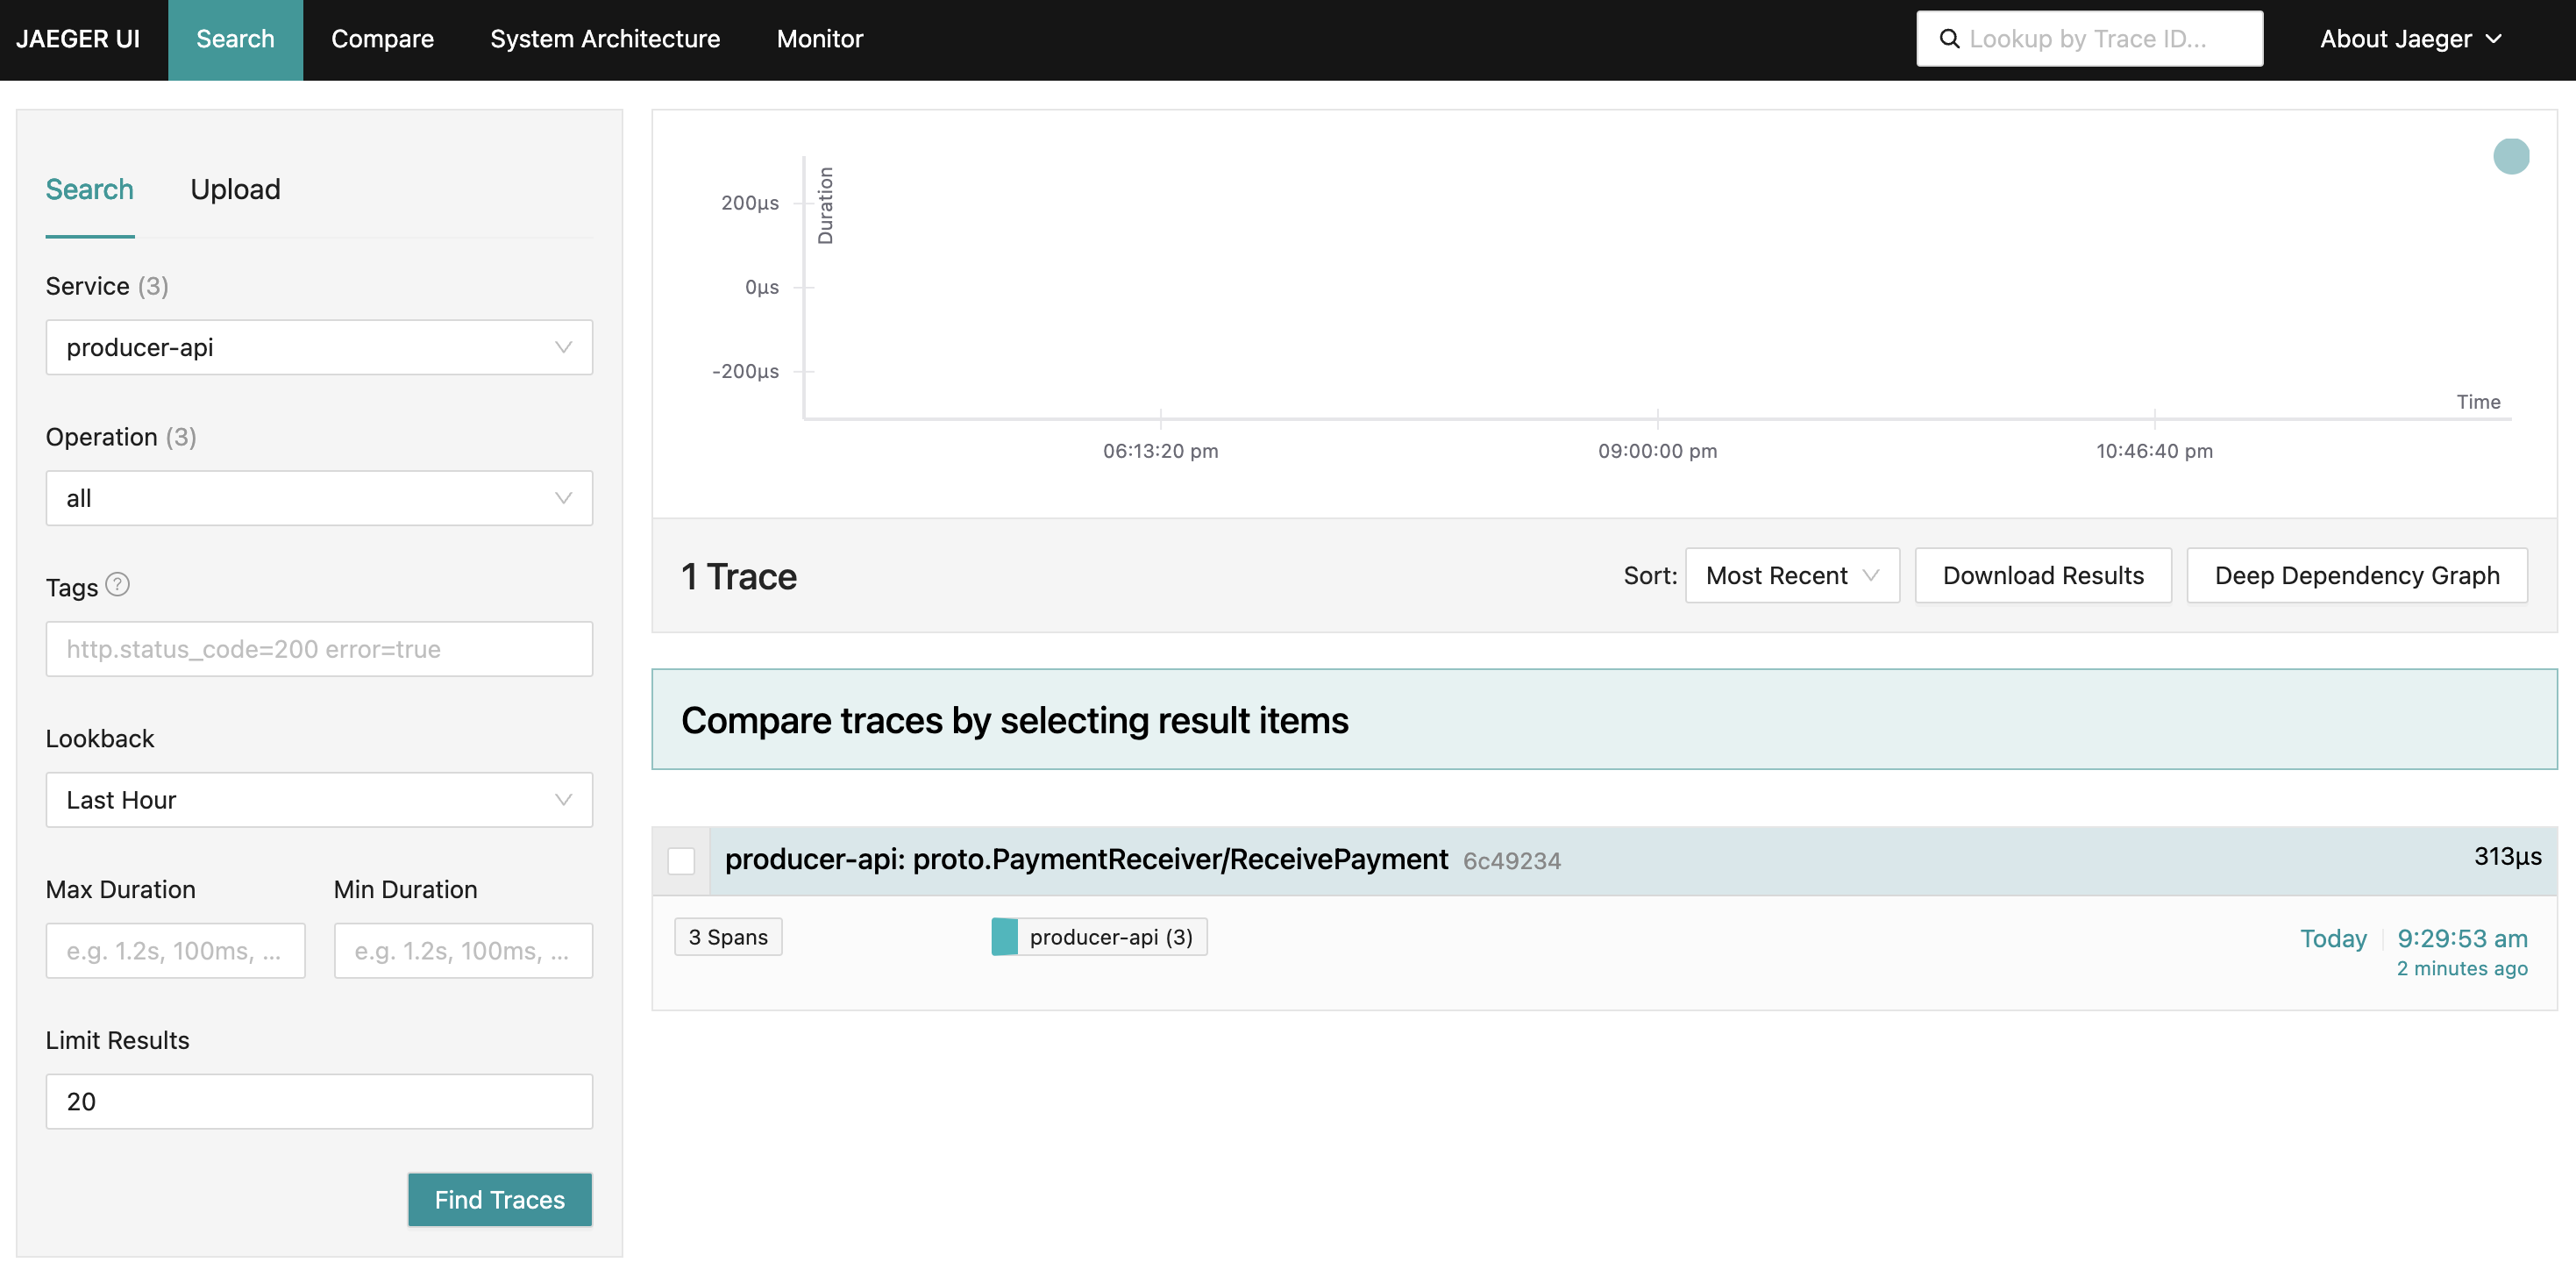
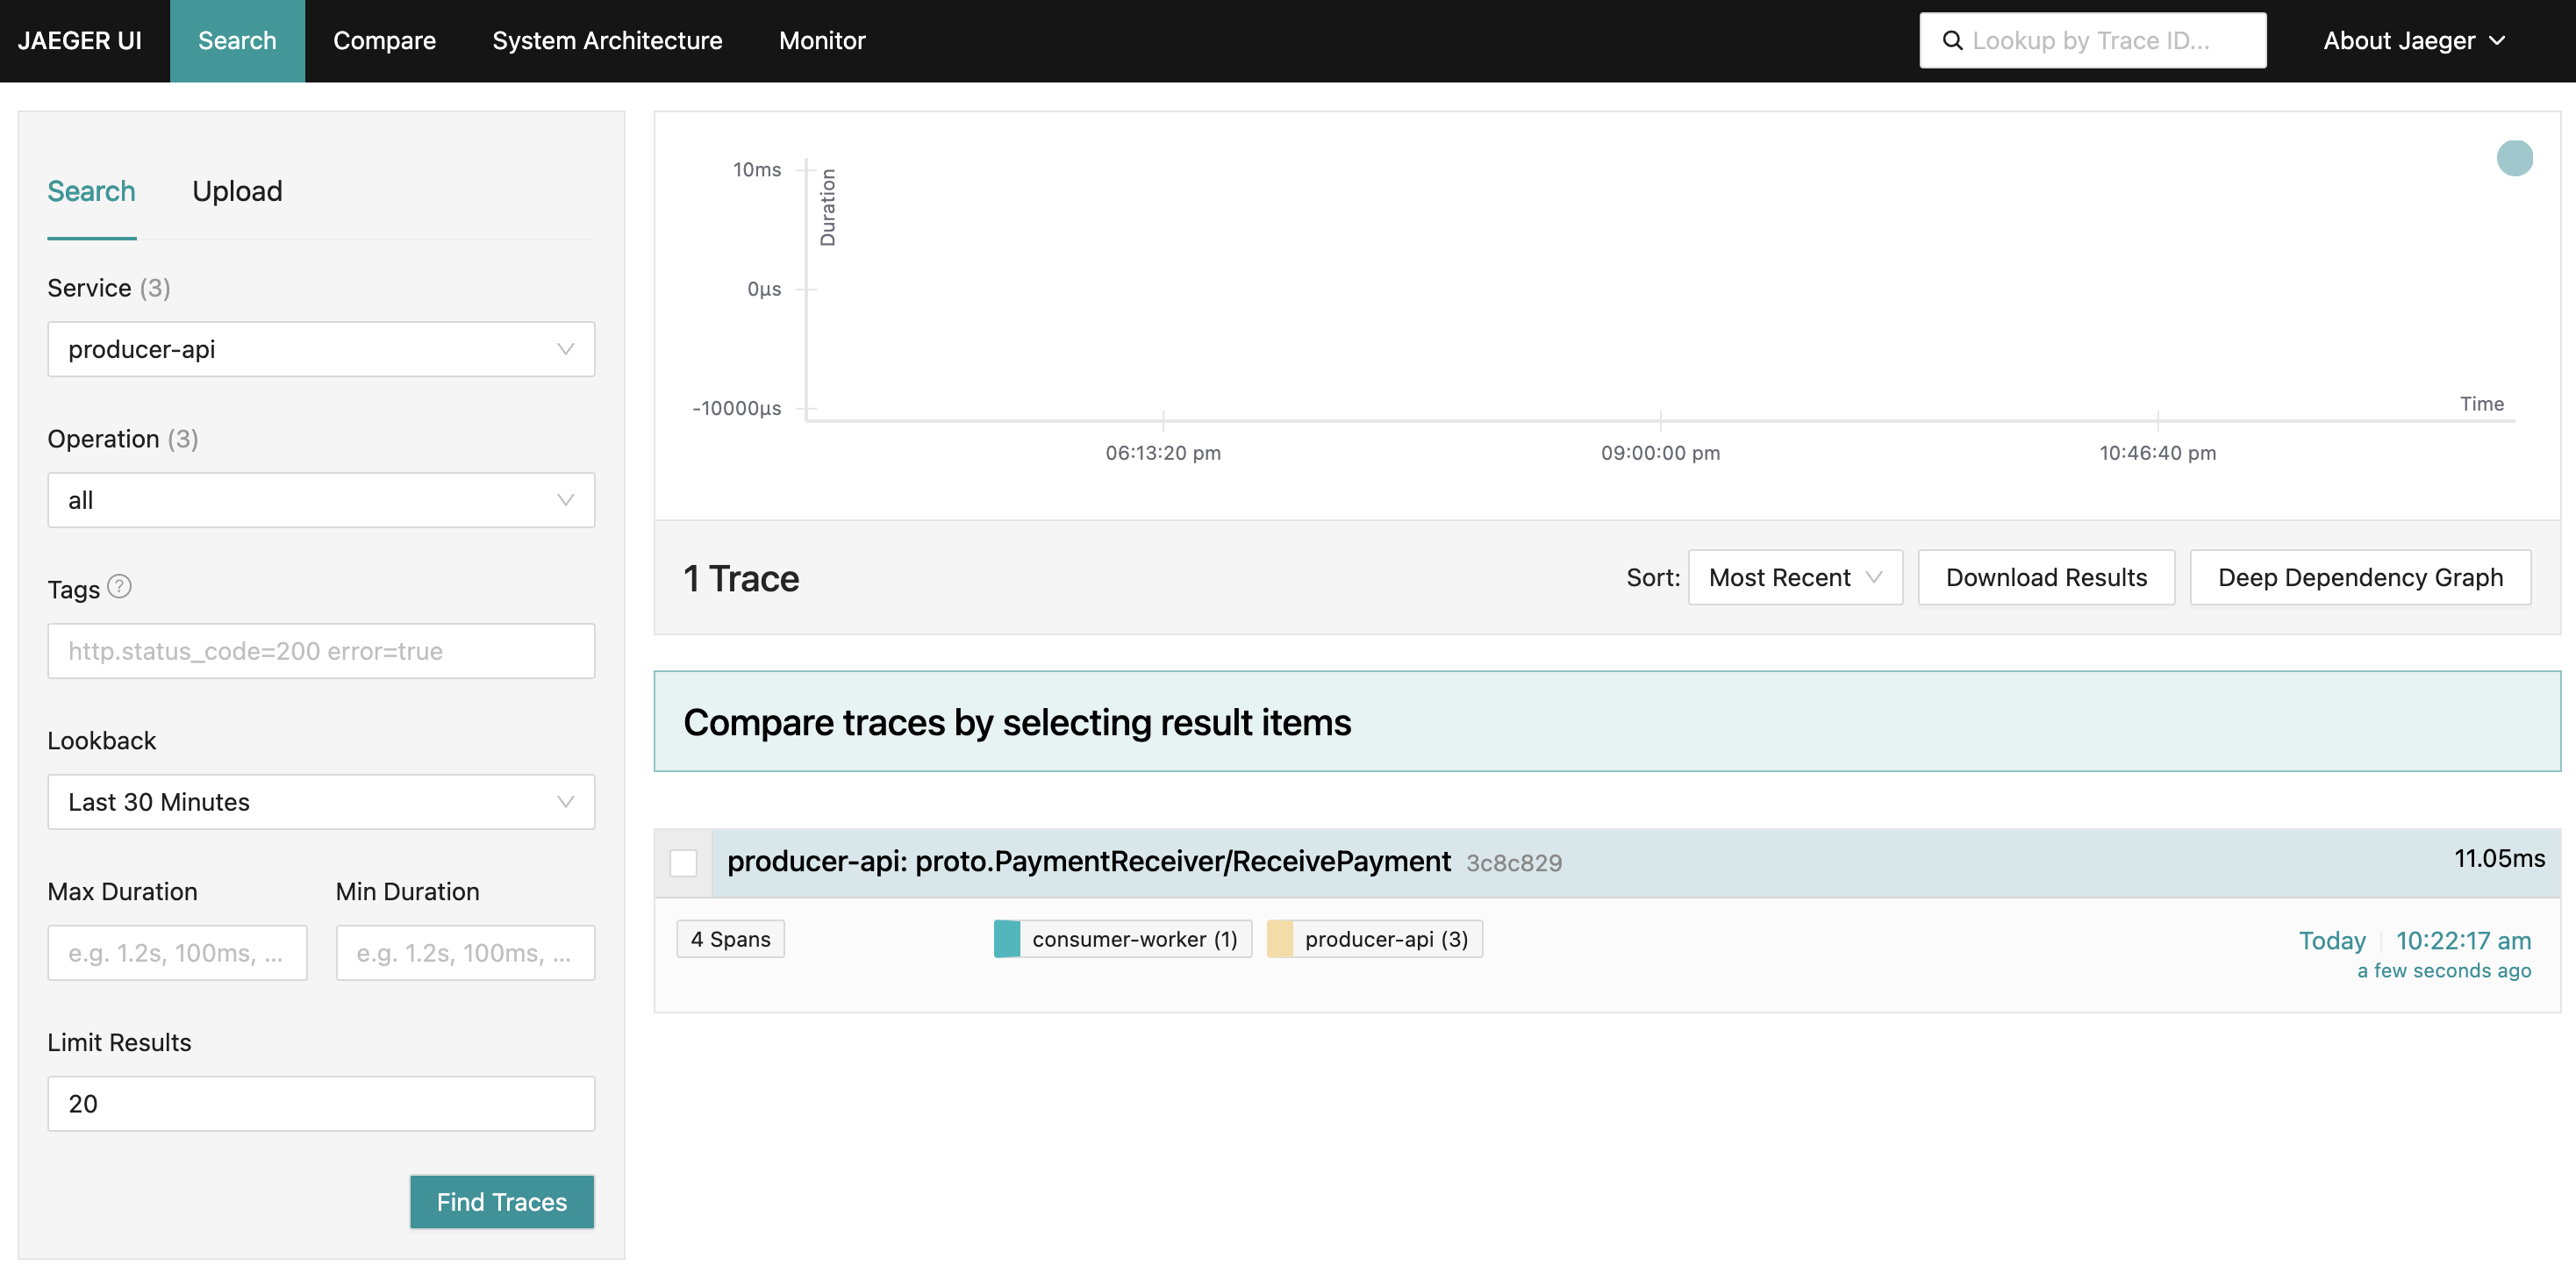
However, there is a problem.
**You can see two traces for the PaymentReceiverAPI and the Worker, for each part of the process, but you cannot see it together as a single timeline. This happens due to the lack of [Trace Context propagation](https://opentelemetry.io/docs/concepts/context-propagation/).**
The OpenTelemetry library does not have the trace metadata to identify which trace is the parent. Newly created spans are instead created as another trace instead of getting added to the trace parent.
## Fixing Context Propagation for Producer and Consumer
To propagate context through HTTP systems, OpenTelemetry libraries use HTTP Headers to send metadata informing other APIs that a trace was generated previously by another API, usually by the [`traceparent` header](https://www.w3.org/TR/trace-context/#traceparent-header), that contains the TraceID of the current transaction.
Since the Worker uses a streaming client for multiple messages (a single HTTP call to continuously receive data), you cannot rely on HTTP headers to track each time a piece of data is received. To solve that, you need to manually set the Context Propagation for your payment notifications, by attaching metadata to each notification with the `traceparent`.
Also, we will add manual instrumentation to track internal operations, so we can trace the following operations:
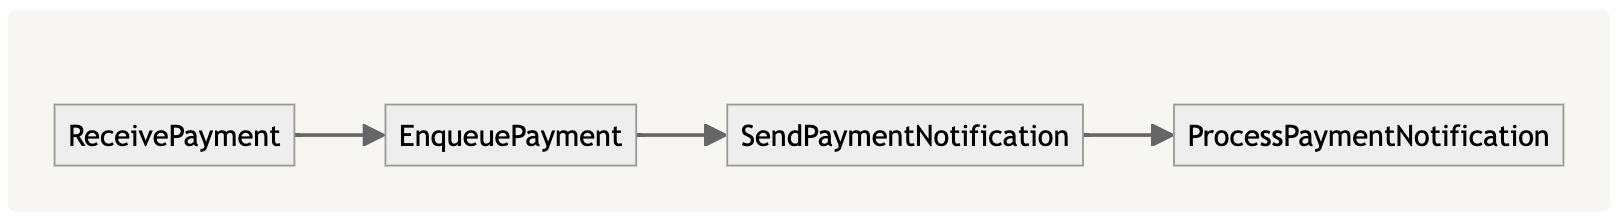
First, you will change the Protobuf definition of the `PaymentNotification` to have metadata, like this:
```protobuf
// ...
message PaymentNotification {
Payment payment = 1;
bool highValuePayment = 2;
map<string, string> metadata = 3; // new field
}
```
Then update the generated server and clients to have these fields (usually done by `protoc` command, or in the code sample, using `make build-proto`).
In Go, OTel libraries rely on setting the tracing metadata on the `context.Context` object to track operations. In the next step, we will capture the trace propagation metadata in the context and inject it into the notification. To do that, create the following helper functions:
```go
func injectMetadataIntoContext(ctx context.Context, metadata map[string]string) context.Context {
propagator := otel.GetTextMapPropagator()
return propagator.Extract(
ctx,
propagation.MapCarrier(metadata),
)
}
func extractMetadataFromContext(ctx context.Context) map[string]string {
propagator := otel.GetTextMapPropagator()
metadata := map[string]string{}
propagator.Inject(
ctx,
propagation.MapCarrier(metadata),
)
return metadata
}
```
Then, change the server to handle this metadata and add manual instrumentation for receiving and enqueuing payments:
```go
type paymentWithMetadata struct {
payment *pb.Payment
metadata map[string]string
}
// Guarantee that the serverImpl implements the PaymentReceiverServer interface
var _ pb.PaymentReceiverServer = &serverImpl{}
// Channel to store payments and used as a "in-memory" queue
var paymentChannel = make(chan *paymentWithMetadata)
func (s *serverImpl) ReceivePayment(ctx context.Context, payment *pb.Payment) (*pb.ReceivePaymentResponse, error) {
go func() {
ctx, span := s.tracer.Start(ctx, "EnqueuePayment")
defer span.End()
message := &paymentWithMetadata{
payment: payment,
metadata: extractMetadataFromContext(ctx),
}
// handle channel as in-memory queue
paymentChannel <- message
}()
return &pb.ReceivePaymentResponse{Received: true}, nil
}
```
Then, for sending it through the stream:
```go
func (s *serverImpl) NotifyPayment(_ *pb.Empty, stream pb.PaymentReceiver_NotifyPaymentServer) error {
for {
message, ok := <-paymentChannel
if !ok {
return nil
}
ctx := injectMetadataIntoContext(context.Background(), message.metadata)
ctx, span := s.tracer.Start(ctx, "SendPaymentNotification")
payment := message.payment
highValuePayment := payment.Amount > 10_000
notification := &pb.PaymentNotification{
Payment: payment,
HighValuePayment: highValuePayment,
}
// extract OTel data from context and add it to the notification
notification.Metadata = extractMetadataFromContext(ctx)
if err := stream.Send(notification); err != nil {
return err
}
span.End()
}
}
```
With the PaymentReceiverAPI instrumented, the last step is to change the Worker to get the tracing metadata and start registering spans linked to the current operation:
```go
func processPaymentNotification(tracer trace.Tracer, notification *pb.PaymentNotification) {
messageProcessingCtx := injectMetadataIntoContext(context.Background(), notification.Metadata)
_, span := tracer.Start(messageProcessingCtx, "ProcessPaymentNotification")
defer span.End()
log.Printf("Received payment notification: %v", notification)
}
```
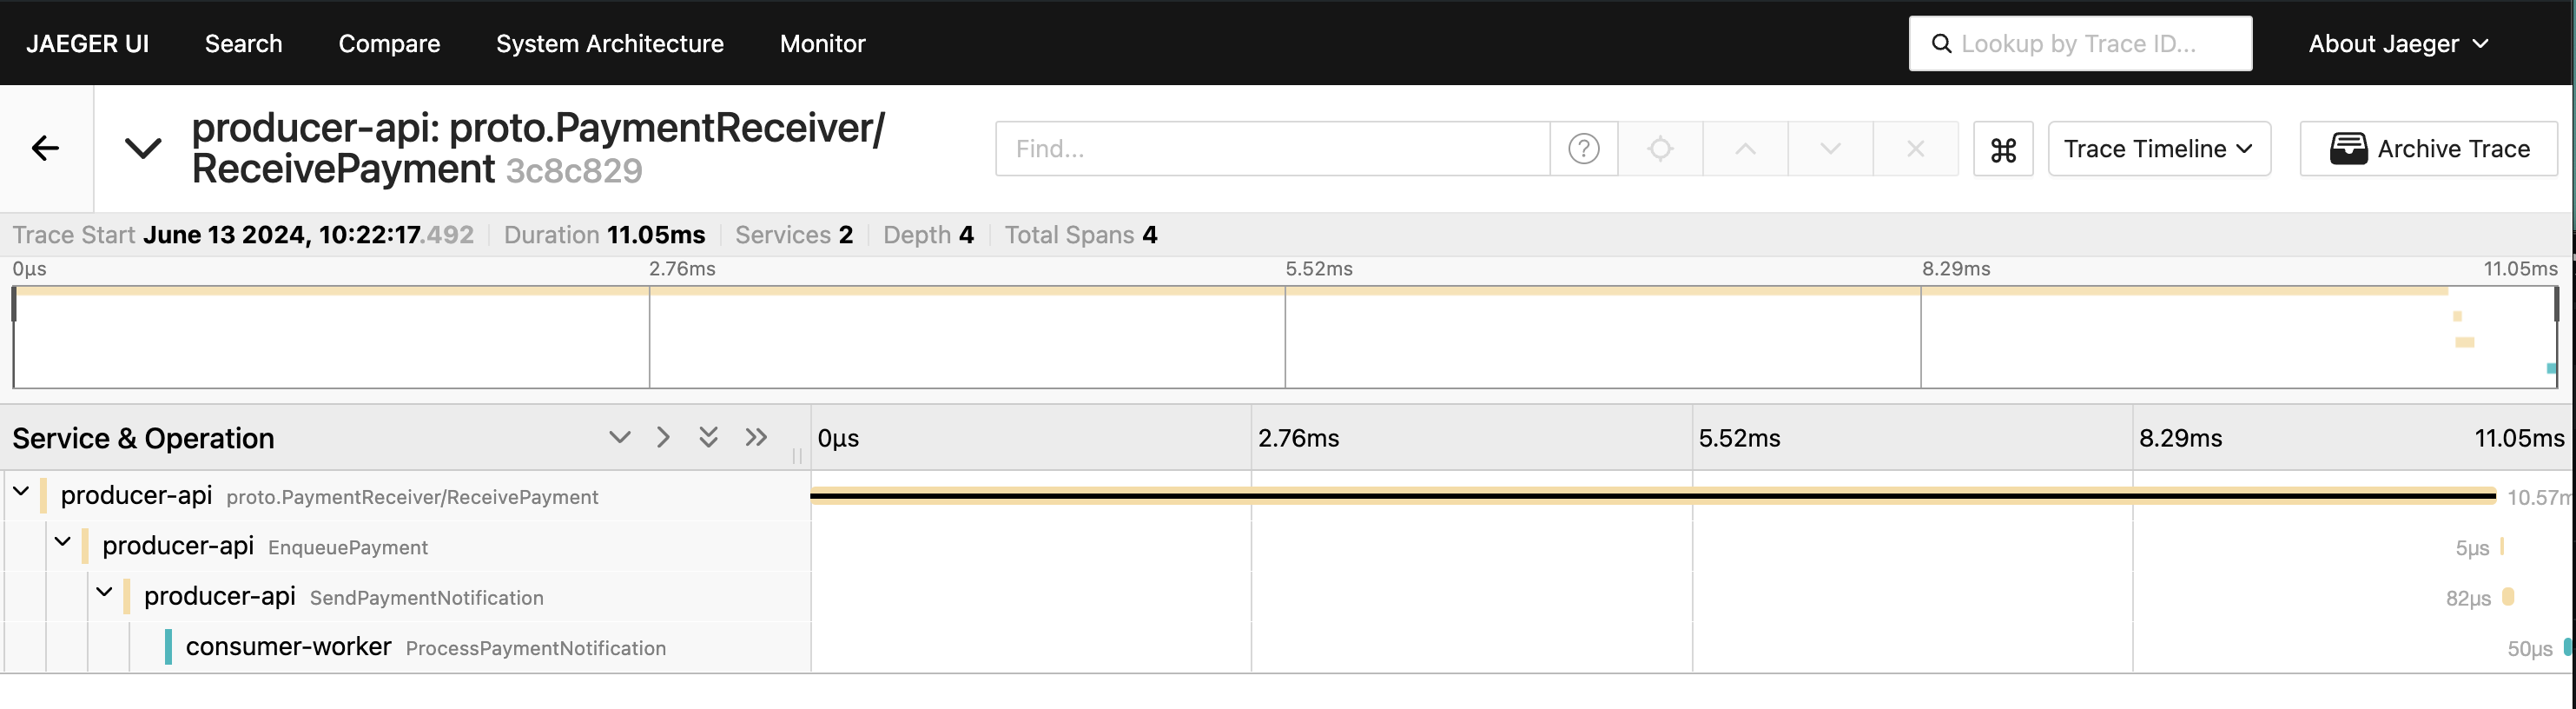
Now, use [grpcurl](https://github.com/fullstorydev/grpcurl) again and check Jaeger. You should be able to see one trace for both PaymentReceiverAPI and Worker, with the entire operation in one timeline:
```bash
grpcurl -plaintext -proto ./proto/paymentreceiver.proto -d '{ "customerId": "1234", "amount": 50000 }' localhost:8080 proto.PaymentReceiver/ReceivePayment
# after result, go to http://localhost:16686/search
```
## Testing a Payment Being Processed
To evaluate and guarantee that everything is working properly, you can create a [trace-based test](https://docs.tracetest.io/concepts/what-is-trace-based-testing) that triggers a gRPC call against the API and validates whether the trace is logged as intended and the payment is correctly processed in each part of the system.
To do that, we will use [Tracetest](https://tracetest.io/), which triggers service calls (in our case, gRPC calls like our `grpcurl` calls) and validate the emitted traces to ensure that our observability stack works as intended.
First, you will create a new account on [Tracetest](https://app.tracetest.io/), and then create a [new organization](https://docs.tracetest.io/concepts/organizations) and a [new environment](https://docs.tracetest.io/concepts/environments). This you allow you to have an [API Key for your agent](https://docs.tracetest.io/configuration/agent), you will start the local stack with a new container with a [Tracetest Agent](https://docs.tracetest.io/concepts/agent):
```bash
TRACETEST_API_KEY=your-api-key docker compose up -d
```
Then, you will [install Tracetest CLI](https://docs.tracetest.io/getting-started/installation) and configure it to access your environment with the command below. It will guide you to connect to your `personal-org` and environment.
```bash
tracetest configure
# This command will print some instructions interactively to help to connect to your env:
# What tracetest server do you want to use? (default: https://app.tracetest.io/)
# What Organization do you want to use?:
# > personal-org (ttorg_000000000000000)
# What Environment do you want to use?:
# > OTel (ttenv_000000000000000)
# SUCCESS Successfully configured Tracetest CLI
```
Now, configure the Tracetest Agent to connect to local Jaeger, using the following command:
```bash
tracetest apply datastore -f ./tracetest/tracetest-tracing-backend.yaml
# It will send the following output, which means that our environment was correctly configured:
# type: DataStore
# spec:
# id: current
# name: Jaeger
# type: jaeger
# default: true
# createdAt: 2023-10-31T00:30:47.137194Z
# jaeger:
# endpoint: jaeger:16685
# tls:
# insecure: true
```
Next, write a test that checks the trace generated by calling `ReceivePayment` gRPC endpoint and validate:
1. if `ReceivePayment` gRPC endpoint is properly called.
2. if a payment is enqueued to be sent.
3. if a payment notification is sent through a gRPC stream.
4. if the payment notification is received and processed.
To do that, we will create a test file called `./trace-based-test.yaml` with the following contents:
```yaml
type: Test
spec:
id: pprDfSUSg
name: Test gRPC Stream Propagation
trigger:
type: grpc
grpc:
address: producer-api:8080
method: proto.PaymentReceiver.ReceivePayment
protobufFile: ./proto/paymentreceiver.proto
request: |
{
"customerId": "1234",
"amount": 50000
}
specs:
- selector: span[name="proto.PaymentReceiver/ReceivePayment"]
name: It should call ReceivePayment gRPC endpoint
assertions:
- attr:tracetest.selected_spans.count = 1
- selector: span[name="EnqueuePayment"]
name: In should enqueue a payment to send it in a stream
assertions:
- attr:tracetest.selected_spans.count = 1
- selector: span[name="SendPaymentNotification"]
name: It should send a payment notification through a gRPC stream
assertions:
- attr:tracetest.selected_spans.count = 1
- selector: span[name="ProcessPaymentNotification"]
name: It should receive a PaymentNotification through a stream and process it
assertions:
- attr:tracetest.selected_spans.count = 1
- selector: span[name="proto.PaymentReceiver/ReceivePayment"] span[name="EnqueuePayment"] span[name="SendPaymentNotification"] span[name="ProcessPaymentNotification"]
name: The trace shape is correct
assertions:
- attr:tracetest.selected_spans.count = 1
```
Note that under the `spec.specs` section, you have one assertion for each span emitted by the system, checking every process step. Also, you have one last step that checks if each step is executed in the correct order.
To run it, you can execute the following command:
```bash
tracetest run test --file ./trace-based-test.yaml
# It will output:
# ✔ RunGroup: #b_CBSFUIg (https://app.tracetest.io/organizations/your-organization-id/environments/your-environment-id/run/b_CBSFUIg)
# Summary: 1 passed, 0 failed, 0 pending
# ✔ Test gRPC Stream Propagation (https://app.tracetest.io/organizations/your-organization-id/environments/your-environment-id/test/pprDfSUSg/run/1/test) - trace id: 4ec68b1a3aaa57aecf0098dd7b4a9916
# ✔ It should call ReceivePayment gRPC endpoint
# ✔ In should enqueue a payment to send it in a stream
# ✔ It should send a payment notification through a gRPC stream
# ✔ It should receive a PaymentNotification through a stream and process it
# ✔ The trace shape is correct
```
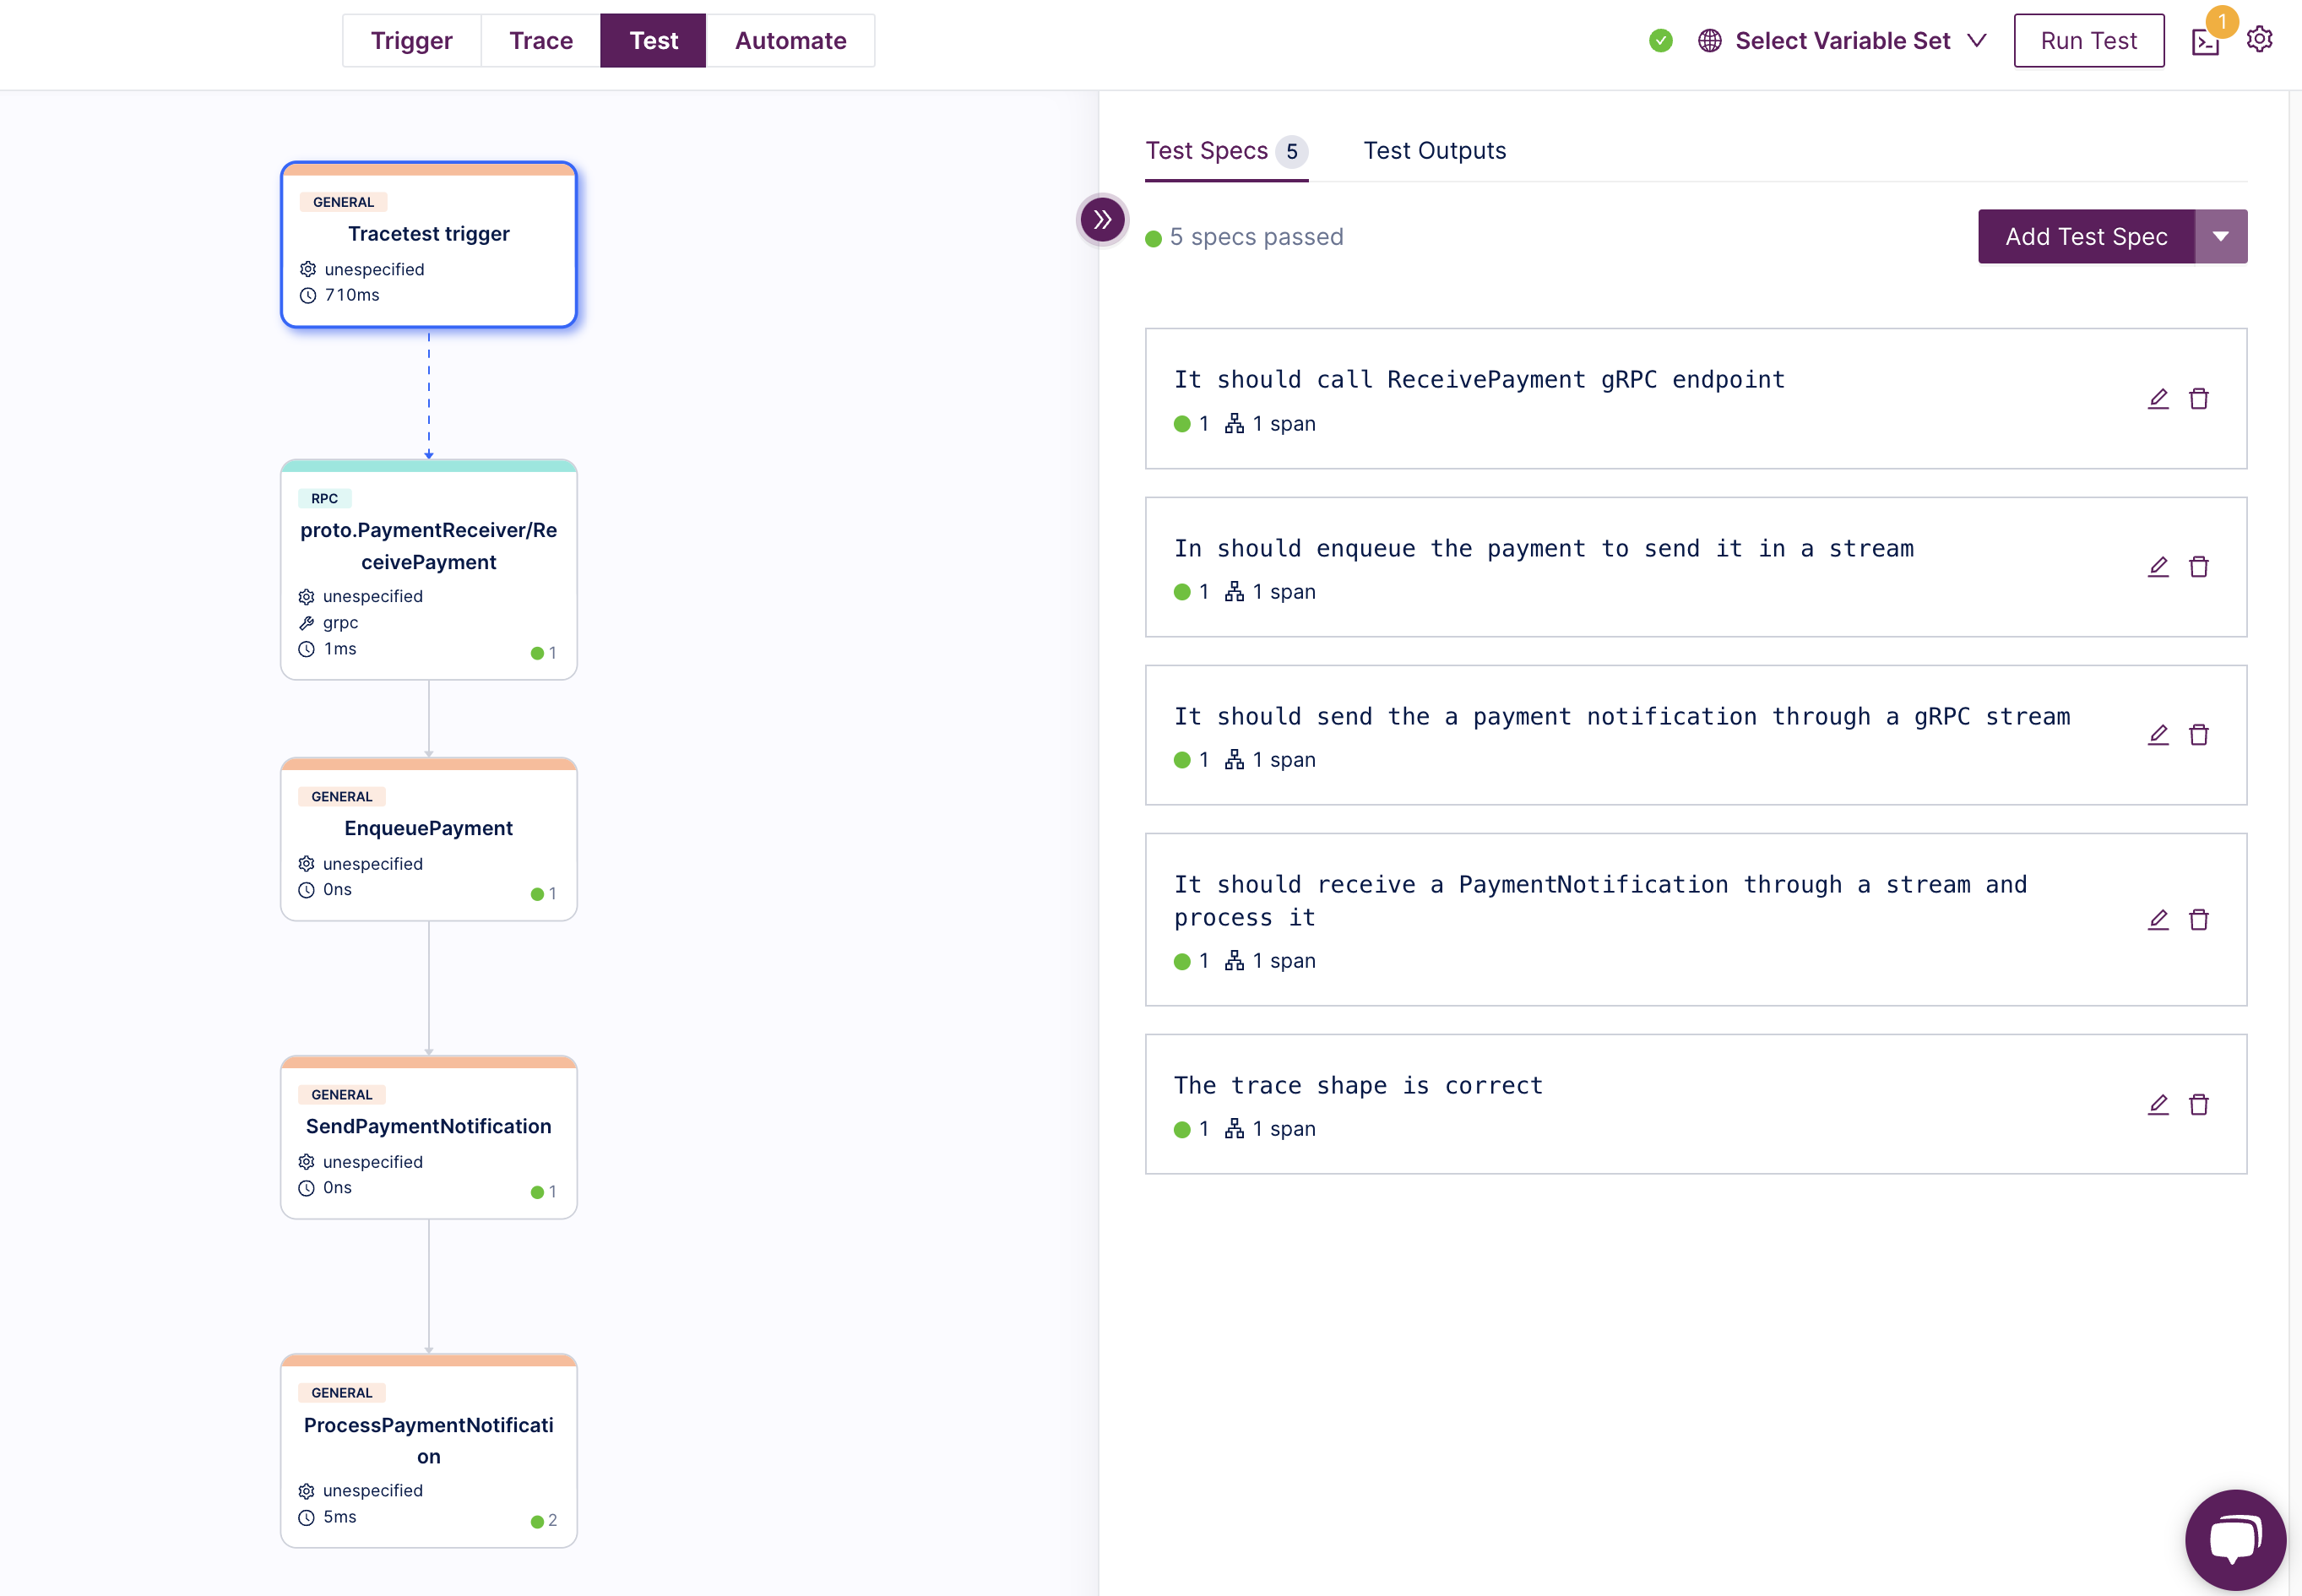
You can also see this output in the Tracetest UI through the links printed in the CLI output:
## Conclusion
gRPC streams are a great way to integrate between APIs to send a continuous flow of data. However, tracking a single trace for an operation can be tricky because of how OpenTelemetry Context propagation works for HTTP.
This article provides a guide on how to implement trace context propagation for gRPC streams using OpenTelemetry, fix context propagation issues for producers and consumers, and test them.
The [example sources](https://github.com/kubeshop/tracetest/tree/main/examples/quick-start-grpc-stream-propagation) used in this article and [setup instructions](https://github.com/kubeshop/tracetest/tree/main/examples/quick-start-grpc-stream-propagation/README.md) are available in the Tracetest GitHub repository.
Would you like to learn more about Tracetest and what it brings to the table? Visit the Tracetest [docs](https://docs.tracetest.io/getting-started/installation) and try it out by [signing up today](https://app.tracetest.io)!
Also, please feel free to join our [Slack Community](https://dub.sh/tracetest-community), give [Tracetest a star on GitHub](https://github.com/kubeshop/tracetest), or schedule a [time to chat 1:1](https://calendly.com/ken-kubeshop/45min).
.jpg)
.avif)
.avif)