
OpenTelemetry isn't just for Monitoring + Troubleshooting anymore
.avif)

Tracetest introduces its Open Beta, going beyond just monitoring and troubleshooting to be the ultimate platform for development and testing with OpenTelemetry
Table of Contents
We are excited to announce the Open Beta launch of Tracetest, the best way to develop and test with OpenTelemetry.
With this tool, we enable a concept that, up to now, has merely been an industry buzzword - [Observability-Driven Development (ODD)](https://tracetest.io/blog/the-difference-between-tdd-and-odd). The promise of observability-driven development is that Observability will be “baked in” from the beginning of the development process, not just bolted on at the end to satisfy the need for visibility in production.
## How will this shift occur?
Ted Young, co-founder of the [OpenTelemetry project](https://opentelemetry.io/), told me in a recent conversation:
> *“In general, I would like to see more tools that are focused on development and instrumentation, not production.”*
Currently, most Observability tools are focused on one thing - Production. Without tooling that enables developers to seamlessly instrument code, maintain consistency, and write tests to verify functionality, Observability remains primarily a solution geared towards operations. This limits its potential to deliver value to other parts of the organization.
## How will Tracetest fill the gap?
Tracetest is already [the leading trace-based testing solution on the market today, and part of the OpenTelemetry Demo repo](https://opentelemetry.io/blog/2023/testing-otel-demo/). It uses the power of distributed tracing, offering comprehensive insights into the inner workings of your code during testing. When you can observe what your code is doing and the interaction between services, writing tests becomes a trivial process.
Tracetest achieves this by providing a comprehensive service map of your system under test. In essence, Tracetest leverages distributed traces, allowing users to construct tests based on these traces. This enables the creation of specific criteria and assertions tailored to each unique end-to-end flow.
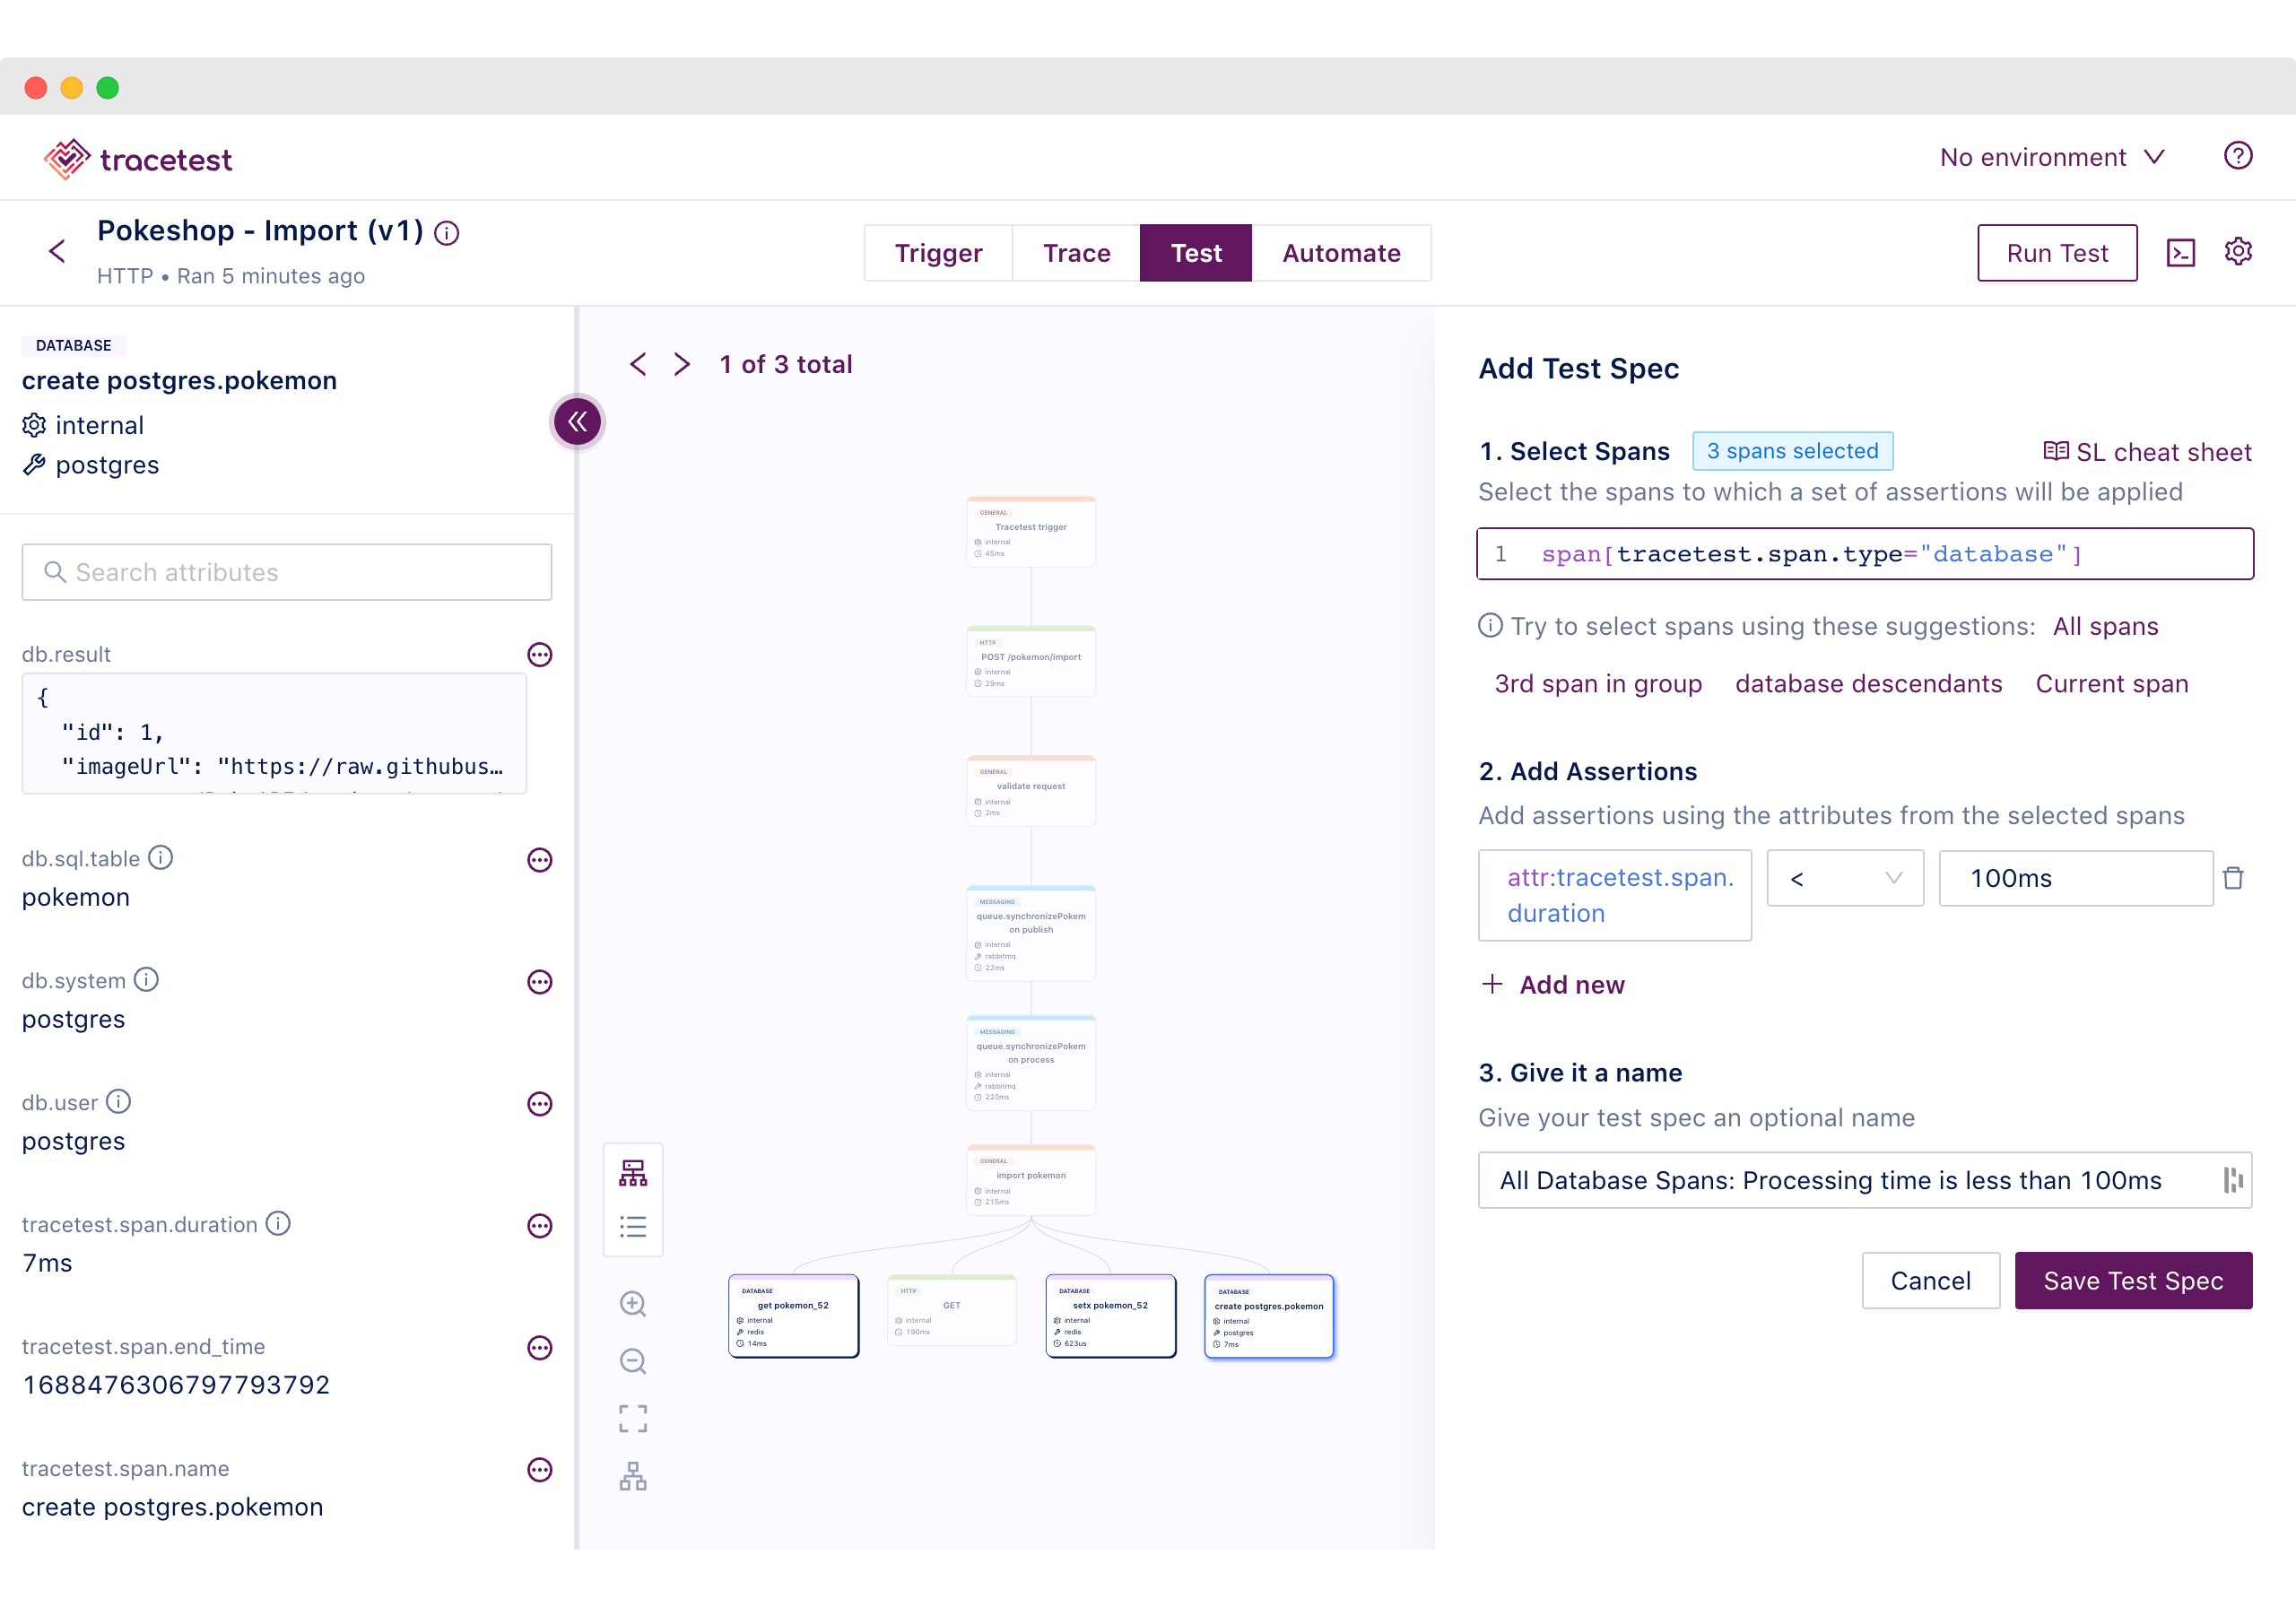
*Image 1: Tracetest Assertions based on Distributed Traces*
Adoptees see the time required for writing integration or end-to-end tests across their Cloud Native systems drop from hours to minutes. It is platform agnostic, working with all the major observability vendors such as Datadog, New Relic, Honeycomb, Dynatrace, [and 10 others](https://tracetest.io/integrations).
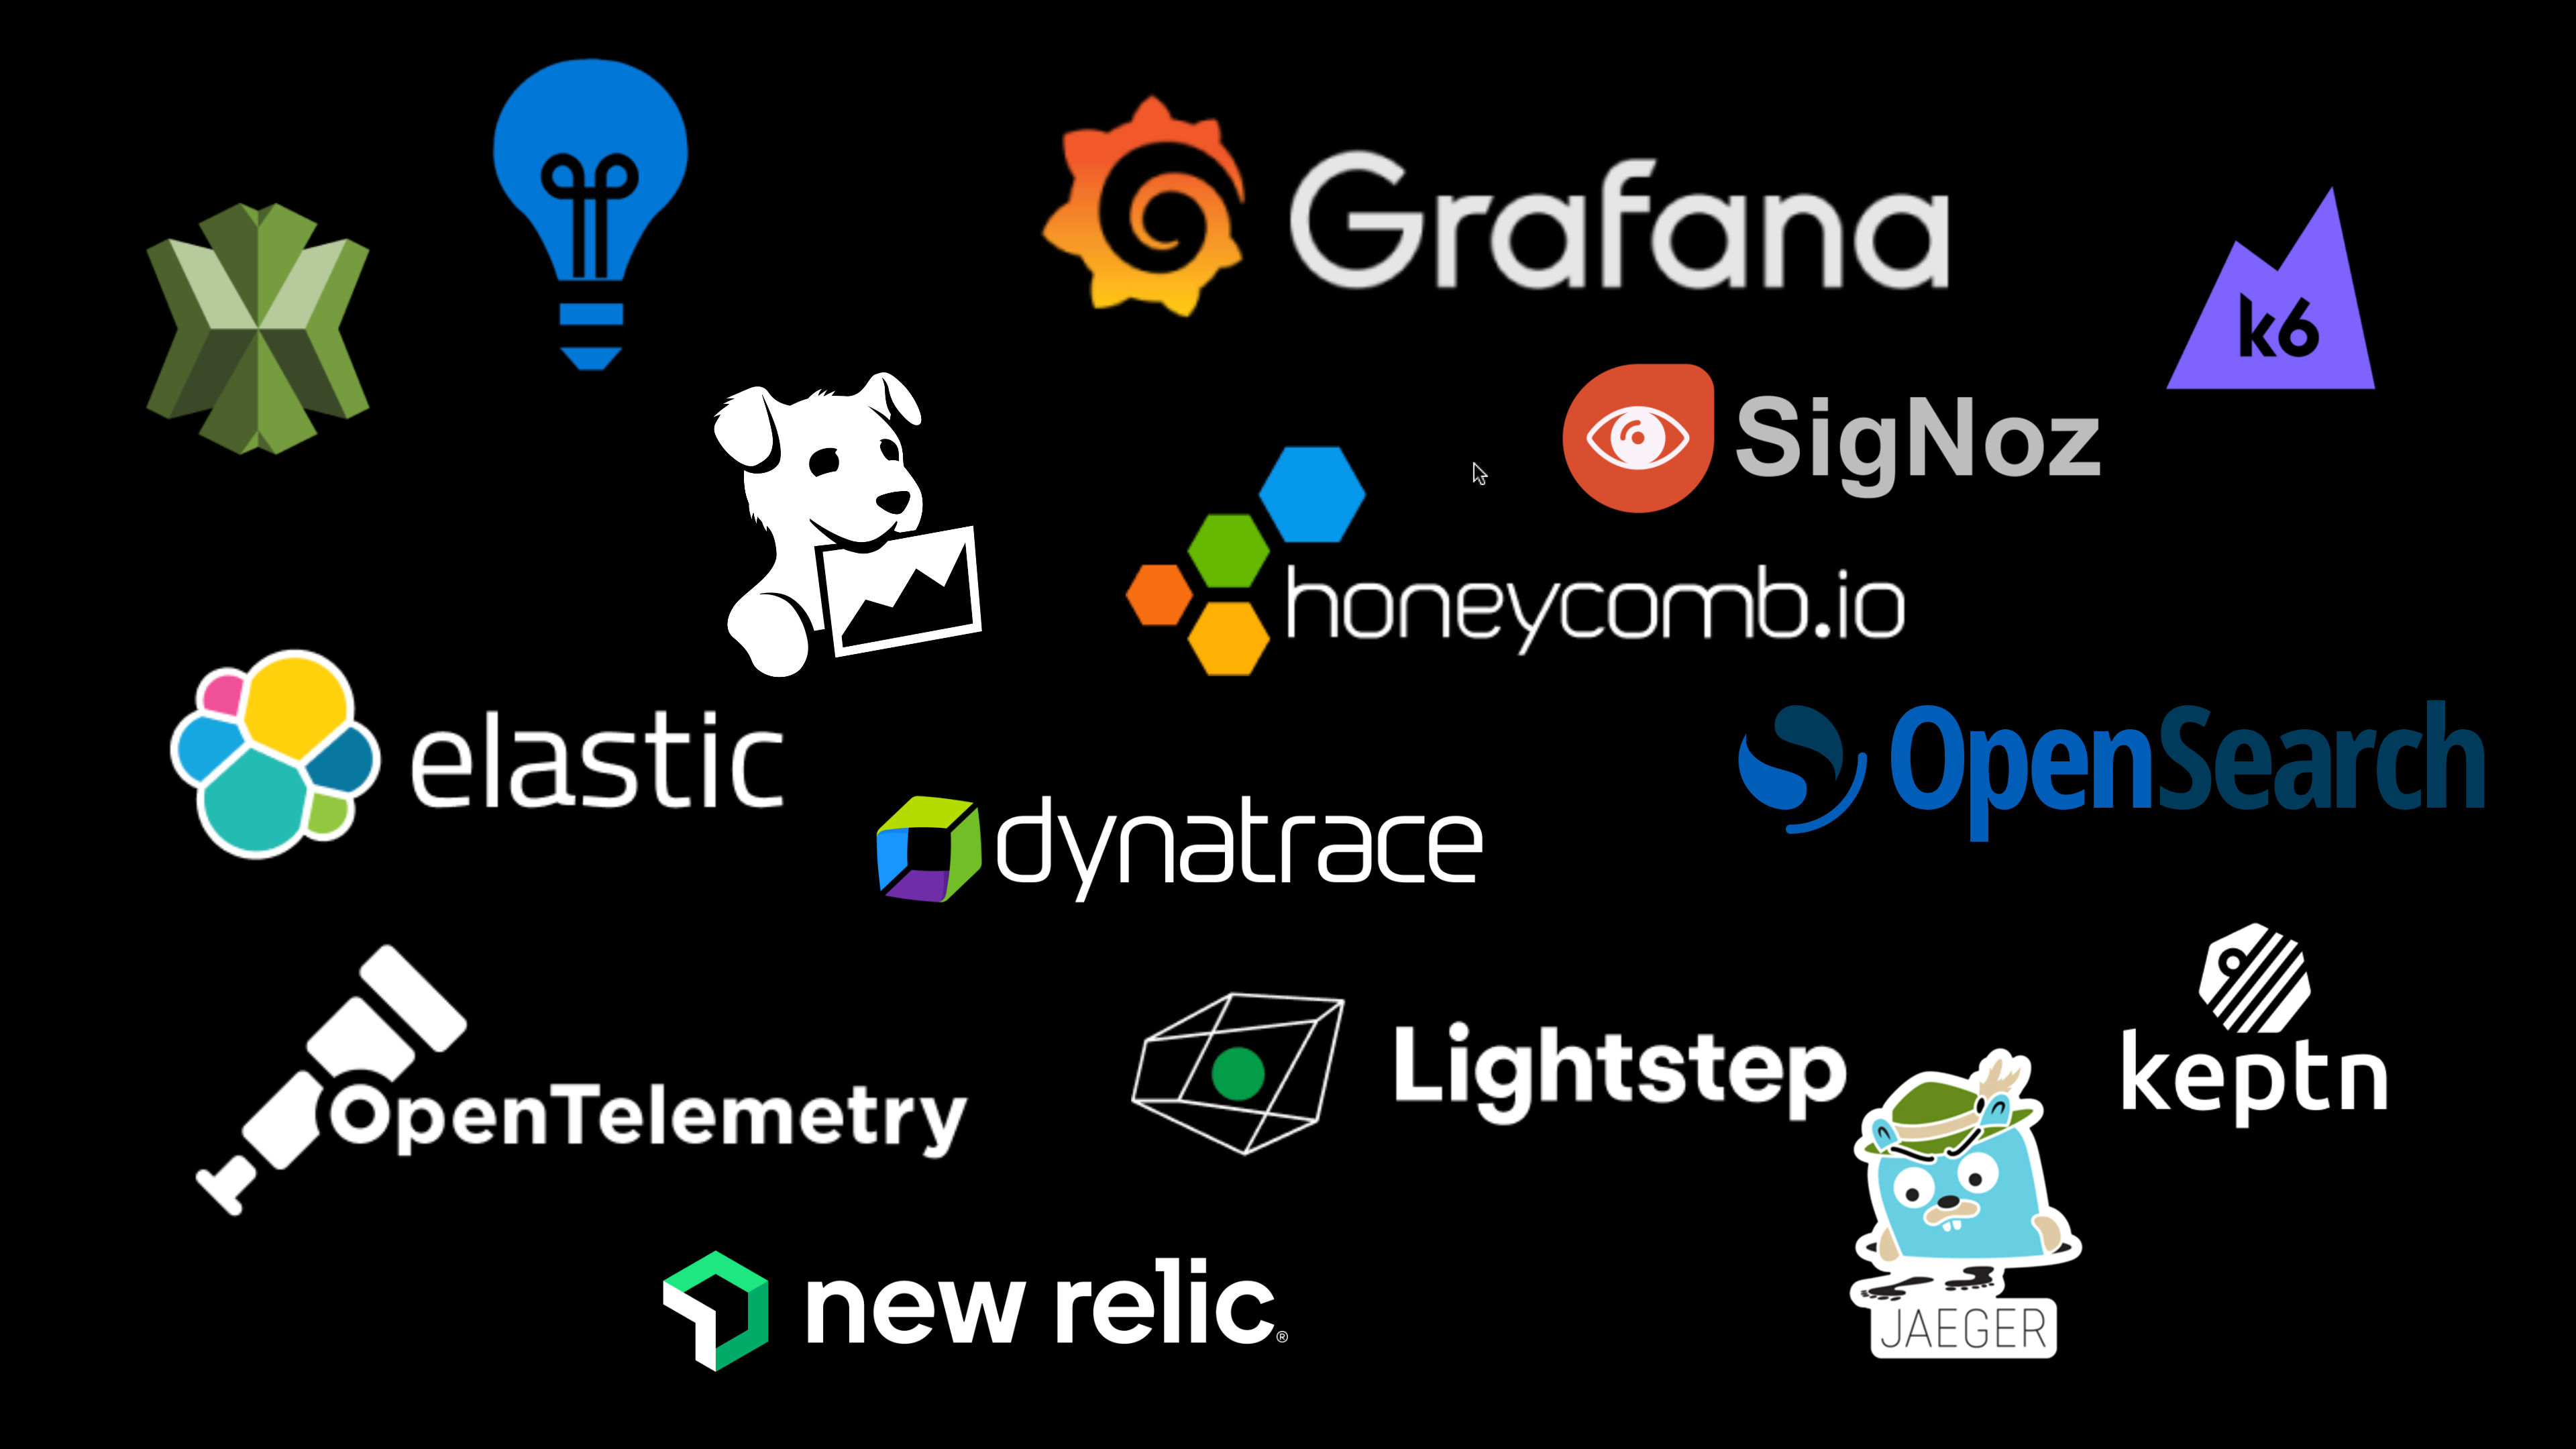
*Image 2: Tracetest Data Store Integrations*
Additionally, the individual developer experience surrounding instrumentation of your code is vastly improved with a newly introduced (and [free](https://tracetest.io/pricing)) “localMode”.
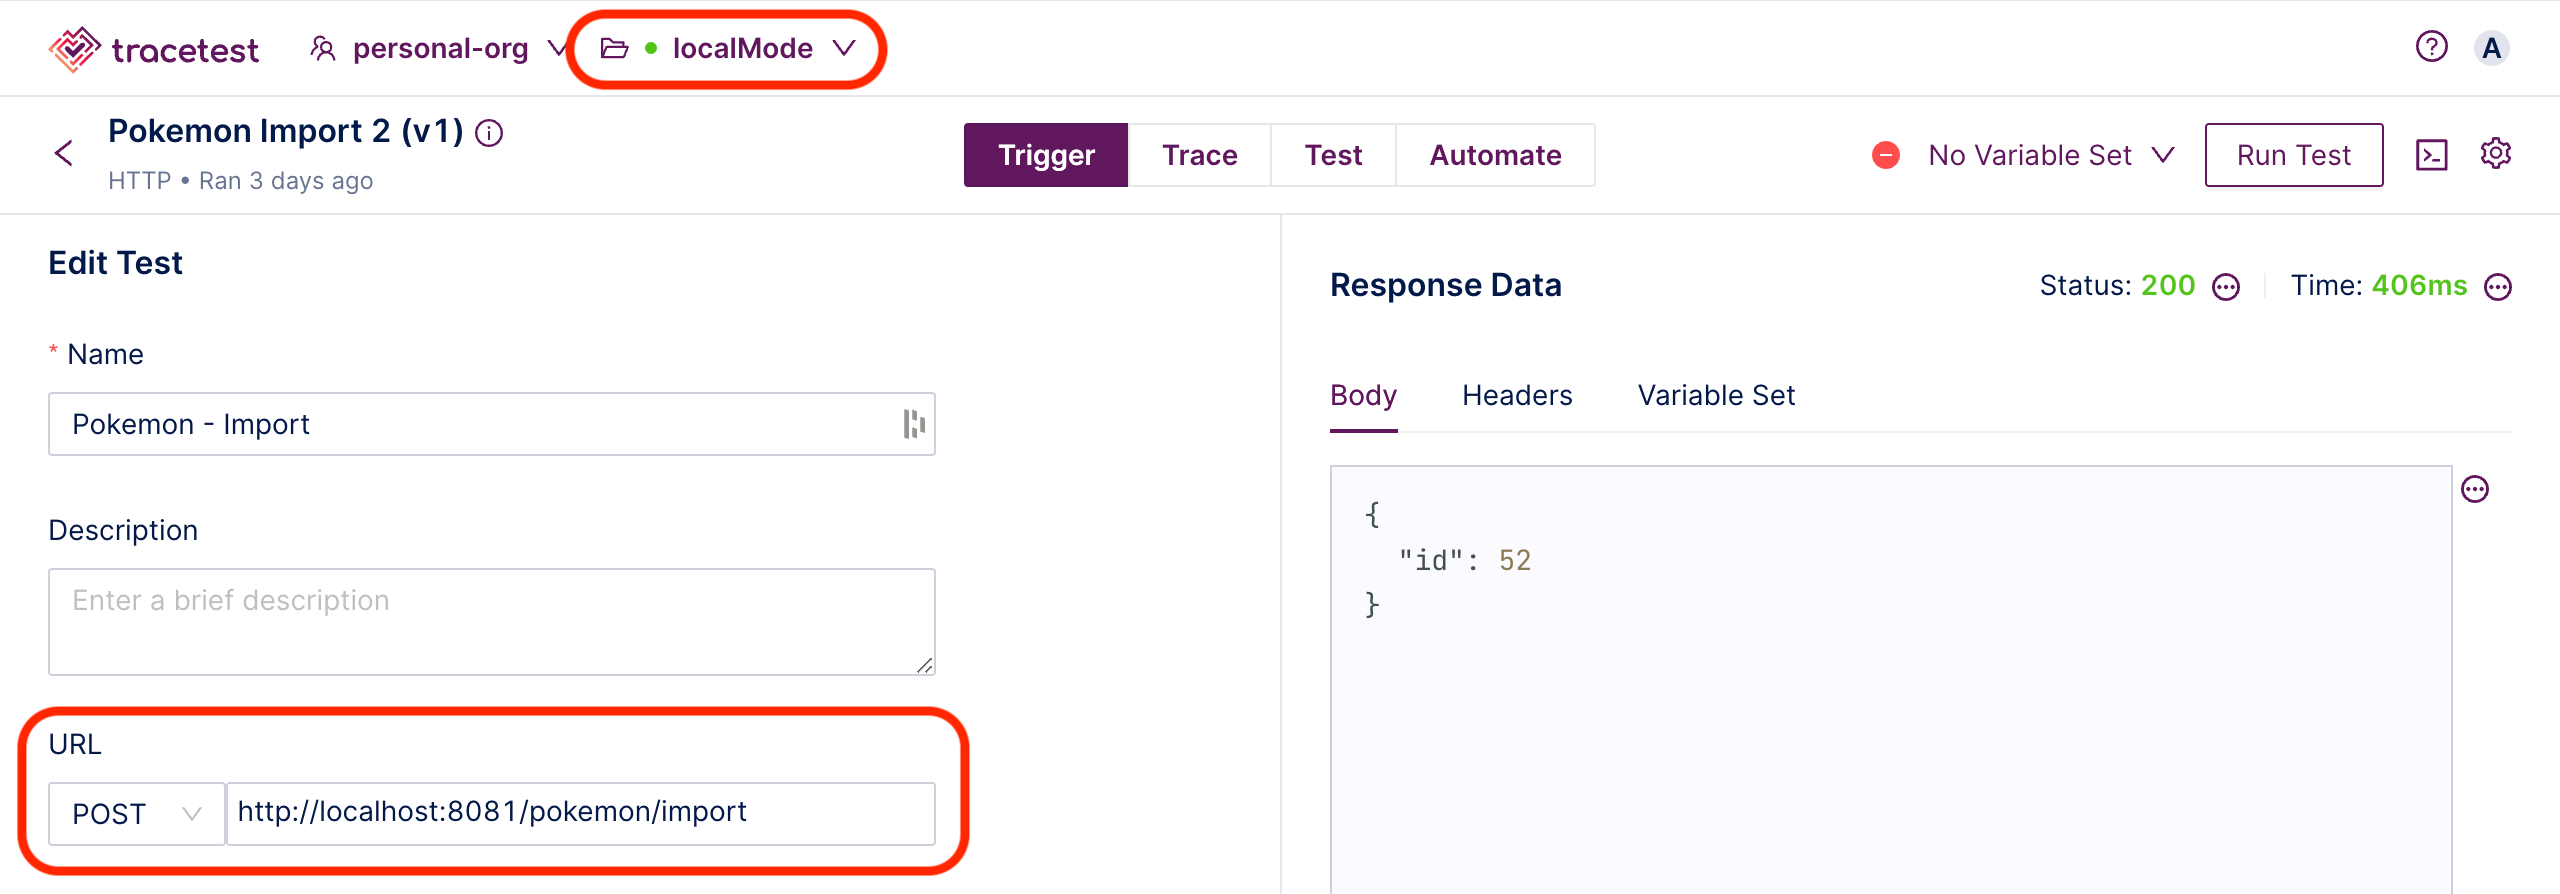
*Image 3: Tracetest localMode*
With localMode, developers can run a simple agent in their console, Docker, or Kubernetes workspace and immediately begin seeing and improving their instrumentation.
Tracetest will also let you know if you are not following the [OpenTelemetry semantic conventions](https://opentelemetry.io/docs/concepts/semantic-conventions/), and you can use the [Analyzer](https://docs.tracetest.io/analyzer/concepts) to enforce the [OpenTelemetry specification standards](https://opentelemetry.io/docs/specs/otel/) across your dev teams.
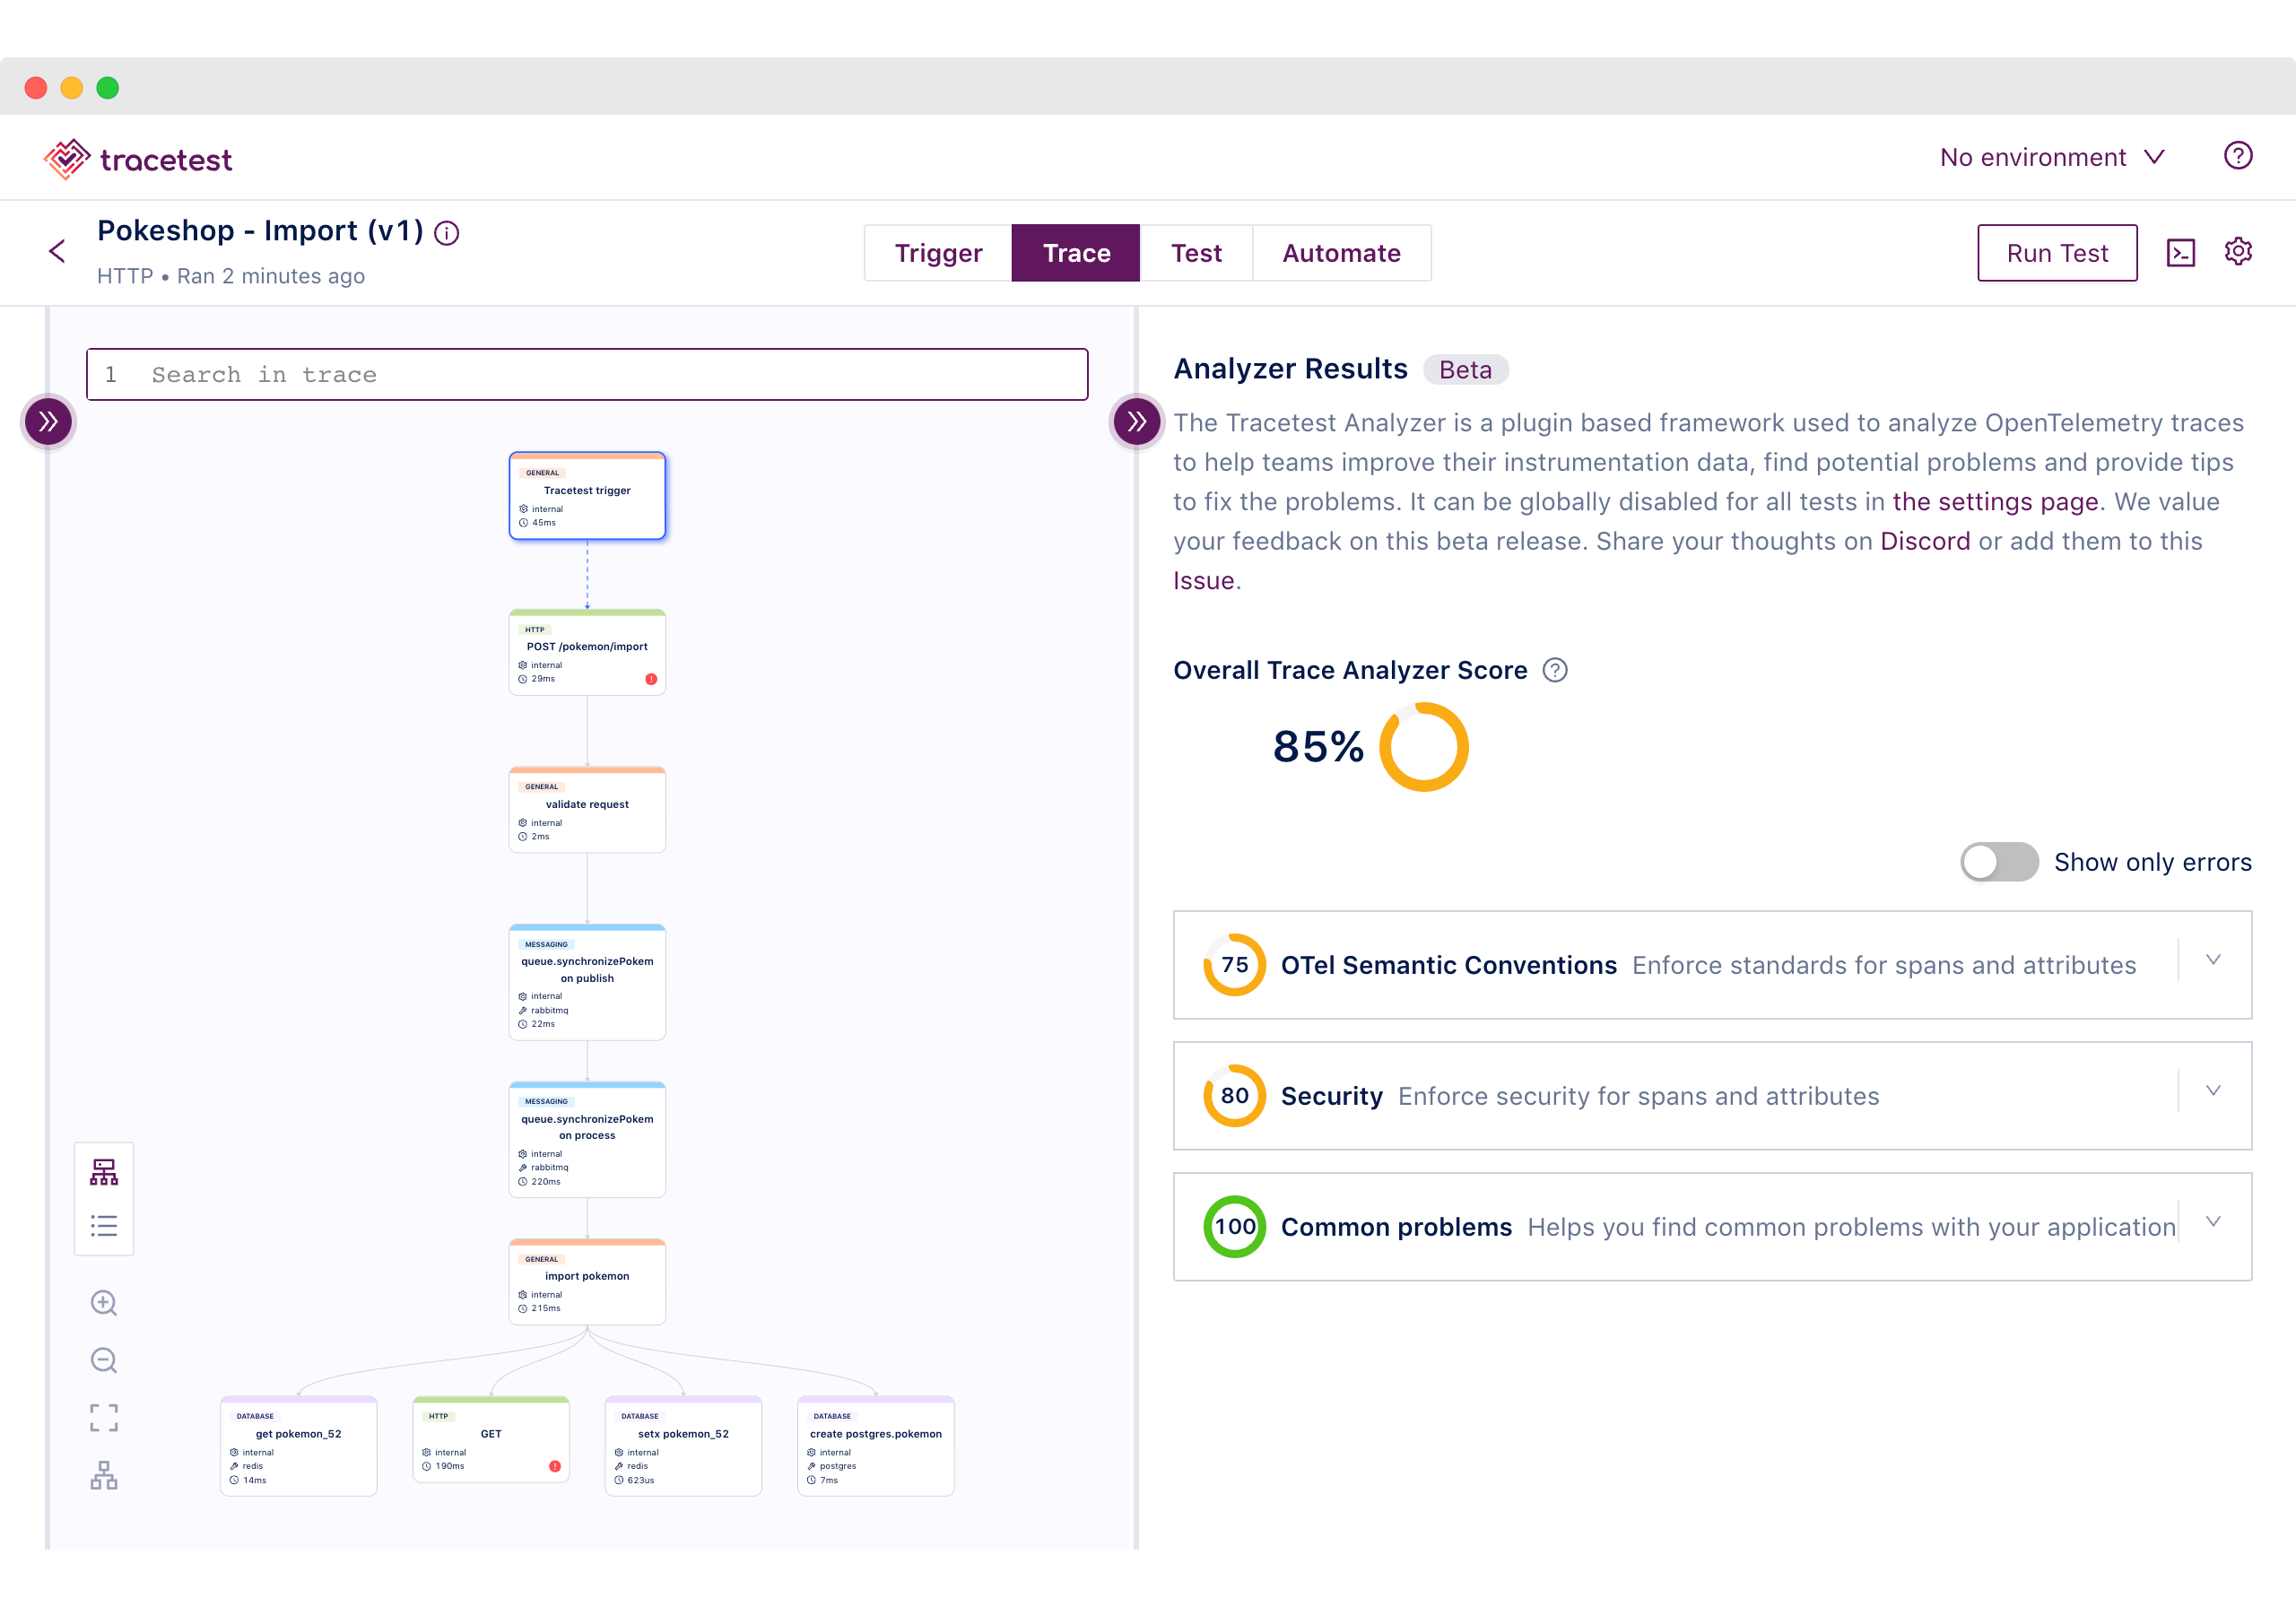
*Image 4: Tracetest Analyzer*
## Key Features of Tracetest Core
The [open-source version](https://github.com/kubeshop/tracetest) of Tracetest, which we are referring to as Tracetest Core, has had a warm reception, generating excitement across the industry and garnering over 700 stars in its first 18 months.
Tracetest Core offers a unique feature that makes building integration tests much faster. By using Distributed Tracing, it reduces the required time by 98%.
Here's how it works:
1. **Trigger:** Use tailored test triggers, like API calls (HTTP or gRPC) or Kafka streams, to get system responses and initiate tracing. Tracetest Core automatically adds essential headers to these requests for comprehensive tracing.
2. **Trace:** Tracetest Core uses a polling algorithm to query the existing tracing solution and gather a complete trace for analysis. The trace is shown in both a timeline and system view.
3. **Test:** Based on response and trace data, developers can create customized assertions. These assertions can check status codes, business data, span existence, anticipated flow, and more. For example, you can validate that all database calls complete within a specific time frame.
4. **Automate:** Tracetest Core can run in your CI/CD pipelines.
With Tracetest Core, creating integration tests is no longer a time-consuming task. Instead of taking days, you can now build comprehensive integration and end-to-end tests within minutes.
## Why Create a SaaS Version of Tracetest?
Our users did point out some limitations with Tracetest Core.
**It’s Heavy.** Not super heavy, mind you, but it needs several parts and pieces to run - the core executable, Postgres, etc. Due to this, the install took a few minutes and was limited to Docker and Kubernetes environments. It’s not the “grab it and go” test tool we think it can be.
**Networking is Hard.** We are not all Cisco certified engineers or experts in Docker networking. Not being able to collect trace information directly from the environment you are working in made getting started with Tracetest harder than desired and lead to more support needs.
**Server Installation is Not Ephemeral-friendly**. GitHub Actions or other CI/CD environments you spin up, and then spin down, as part of the test environment resulted in a use pattern we did not expect - the installation of Tracetest server into a transient environment. Spin up Tracetest, run tests, shut it down. This eliminates one of the most valuable capabilities of Tracetest - seeing your trace-based test results via the UI. By viewing a failed test in the UI, you can see not just failed assertions, but also look at the system surrounding it using the full captured trace. It also allows you to adjust your assertions at that point and resave your test.
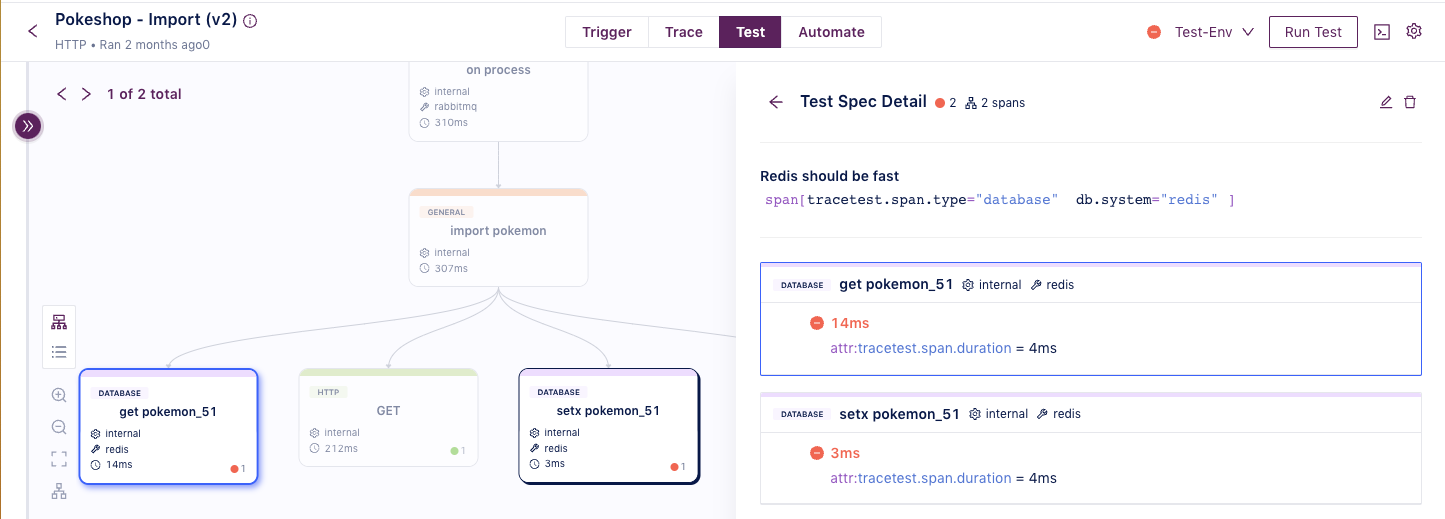
*Image 5: Tracetest Test Specs*
**Monetization.** We are a small, dedicated team working full time on Tracetest. We draw salaries, have house notes to pay, and have children and pets to feed. Putting Tracetest on a path to sustainability is critical to the success of continuing to develop Tracetest Core. There… we said the quiet part out loud.
*Image 6: Tracetest’s Chief Happiness Officer Scout likes treats*
## Why Use Tracetest SaaS instead of Tracetest Core
**Managed infrastructure.** Tracetest runs in the cloud (available for on-prem deployments as well), where you have a central location for storing, viewing and running tests. No need to manage your own Tracetest Core instance. It’s a clear benefit for distributed systems, serverless, and microservice architectures.
**It is super lightweight.** With Tracetest you install a lightweight agent in your working environment, whether it's on your local machine, Docker, Kubernetes, Github Actions, or similar platforms.
This agent has two jobs when a test is run:
1. Trigger your local code via REST, gRPC, or Kafka.
2. Collect the distributed trace either directly or by reaching out to your observability solution.
**It has a super easy install.** For MacOS, there are just two commands:
```yaml
brew install kubeshop/tracetest/tracetest
tracetest start
```
Click [here](https://docs.tracetest.io/getting-started/installation) to view installation instructions for other operating systems.
You can start visualizing traces and creating tests right away, whether it's ad hoc tests for code in development or complete integration tests.
**Networking is Easy (Really!)** Since you install the agent directly into the environment where you are running your application, there is no complex networking. When developing in localMode, the agent listens on the common [OpenTelemetry Line Protocol (OTLP)](https://github.com/open-telemetry/opentelemetry-proto/blob/main/docs/specification.md) on ports 4317 & 4318 automatically.
**Tracetest is persistent, not ephemeral!** You can work and run tests in ephemeral environments such as GitHub Actions using the Tracetest Agent, which sends test results to Tracetest. These results will be available for you to examine the full trace, diagnose the issue, or share with the team.
**It is Free!** Tracetest will be the easiest, most convenient tool to instrument and test your application. As a developer, you can launch the Tracetest Agent in the free localMode and immediately begin visualizing the trace, improving the quality of your instrumentation, and building tests.
**I thought you needed $$$ to feed your dog?** Eventually, you will want to run these tests in automated CI/CD pipelines, create a shared environment, configure the data store you are using for traces, and run the tests. These shared environments for automated testing will eventually be part of a paid plan. You can collect data from OTLP or connect to a wide range of observability backends, such as Grafana Tempo, OpenSearch, CloudWatch, and more. For the Beta period, these shared environments are also free as we seek feedback and input to improve Tracetest.
## Try it! Give us feedback!
We are looking for feedback. Go to Tracetest.io and click “Get Started”. If you have questions, you can talk to us in the Slack community. You can also reach out to me on LinkedIn.
.jpg)
.avif)
.avif)