
Observability and Trace-based Testing in AWS

%20(1).avif)
In-depth tutorial on how to configure OpenTelemetry instrumentation on AWS Lambda with Serverless Framework, OpenSearch, & Tracetest.
Table of Contents
The OpenTelemetry ecosystem has been growing rapidly in the last year, as it solves one of the major pain points when it comes to observability and tracing for distributed systems.
A frequent question for developers wanting to start with OpenTelemetry is how to install the required toolset in their platforms to start instrumenting their applications.
The current technology trend is leaning towards Kubernetes and Serverless applications. In this tutorial, we want to showcase a way to instrument a distributed system that uses AWS Lambda and Serverless.
We’ll start with the basics and show how to set up the required infrastructure that makes it easy to get started, but also to scale. From there we’ll move on to networking, how to instrument a Node.js lambda function, and last, but not least, how you can introduce trace-based testing with the help of [Tracetest](https://tracetest.io/).
This article will focus on answering three main issues:
- How to provide the required AWS infrastructure for [OpenTelemetry](https://opentelemetry.io/) with [OpenSearch](https://opensearch.org/).
- How to instrument a Lambda using OpenTelemetry.
- How to perform end-to-end tests on your instrumented Lambda's endpoints with [Tracetest](https://tracetest.io/download).
## What are we building?
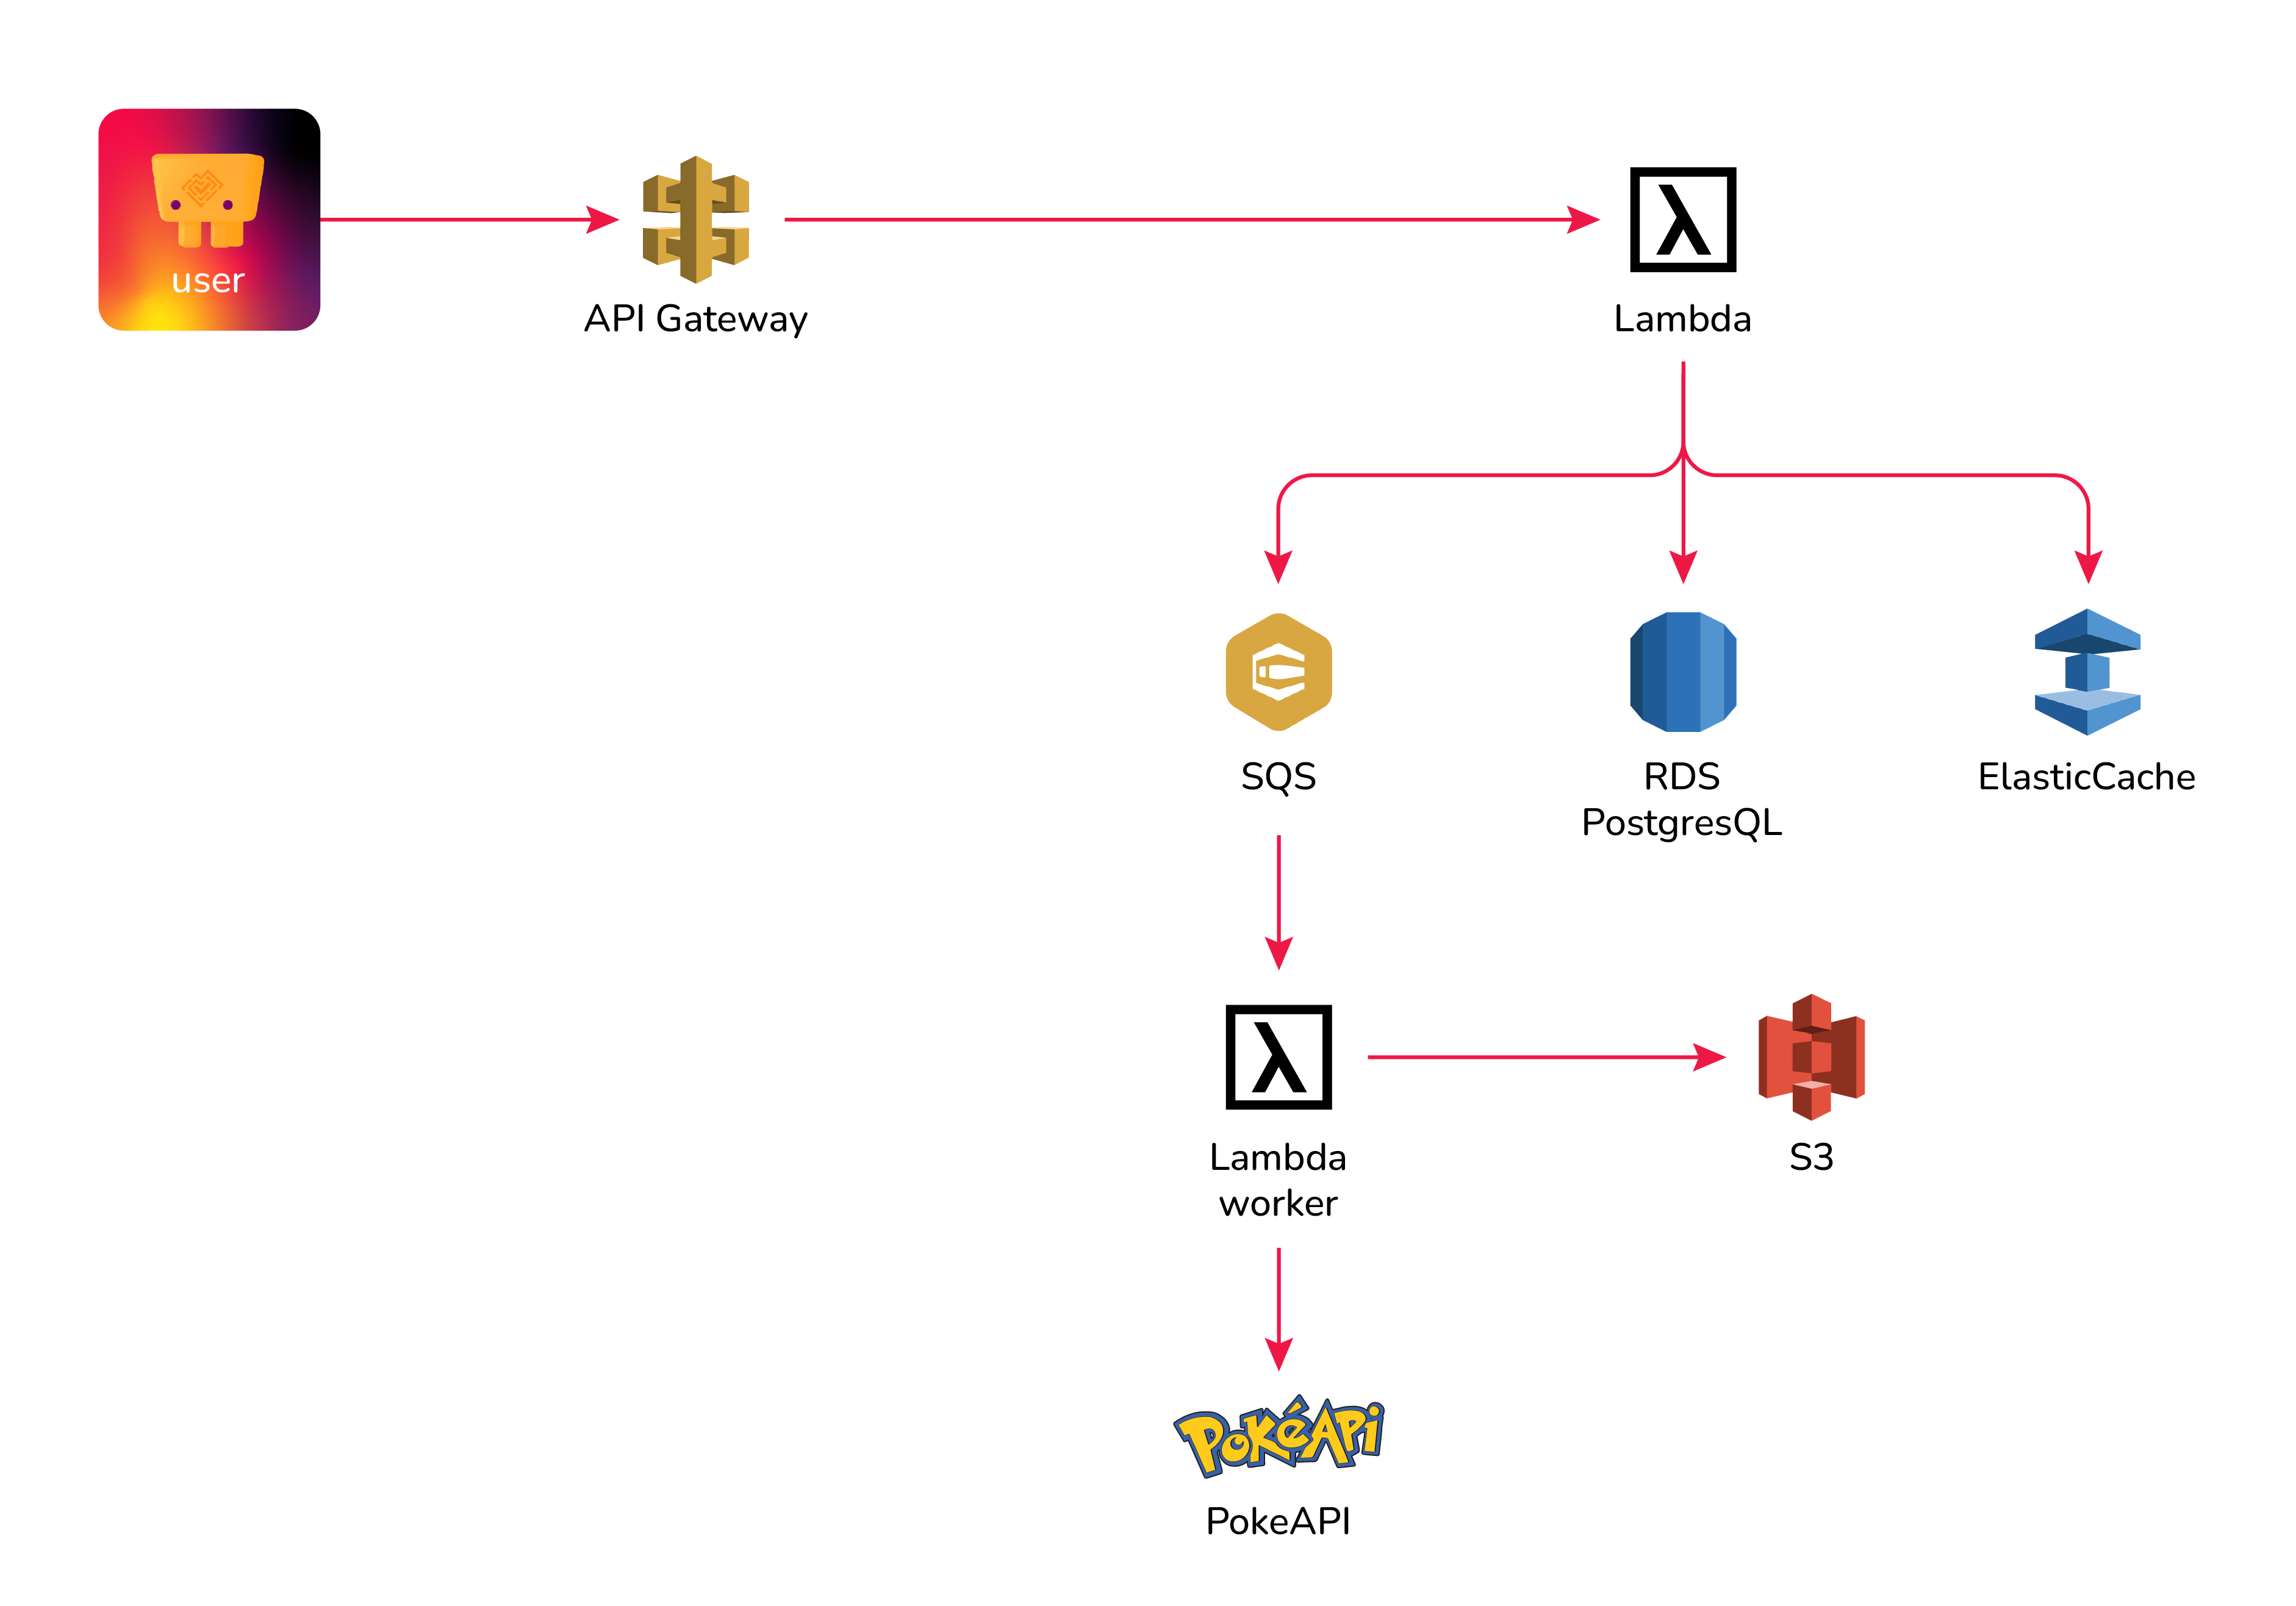
We came up with the idea of creating a basic Node.js Pokemon REST API called Pokeshop to help us validate the different scenarios a real-life application would have. The available endpoints are:
- Get a list of Pokemon.
- Create a Pokemon.
- Delete a Pokemon.
- Update a Pokemon.
- Import by ID - An async process that uses the Pokeshop API, SQS, and a Lambda Worker.
- Get Featured - Uses Redis.
After reading this tutorial, you will learn how we added OpenTelemetry instrumentation to the Pokeshop API and deployed it to AWS using the [Serverless Framework](https://www.serverless.com/).
**Note**: You can always deploy the demo yourself by following the instructions we have provided in our official [Pokeshop Repo](https://github.com/kubeshop/pokeshop).
## What are we using to build the distributed system?
**Development Framework**. As was mentioned, we’ll be using the Serverless Framework as the main tool to provision, deploy and update our application code and infrastructure.
**Infrastructure**. We’ll use AWS services as resources for this tutorial, providing an alternative for teams that are not using Kubernetes or some of its variants.
## What does our OpenTelemetry Infrastructure contain?
There are several moving parts we need to configure to set up OpenTelemetry instrumentation.
### VPC
To simplify the networking configuration, we’ll be using the [Serverless VPC Plugin](https://www.serverless.com/plugins/serverless-vpc-plugin) which provides an easy way to create the networking infrastructure for public and private services. It also generates security groups, bastion instances, and NAT gateways that we will be leveraging to interconnect the different AWS resources.
### Amazon OpenSearch Domain
AWS provides a simple way to generate OpenSearch Domain instances. We’ll be using it as a trace data store and it will be a secure endpoint behind the VPC.
### ECS Side Cart
A simple option to deploy and run containers in AWS is [ECS](https://aws.amazon.com/ecs/). It lets you manage your cloud infrastructure by first connecting to instances, then by defining services and task definitions to execute tasks.
We’ll use ECS for the side cart services.
We are going to be using the [ADOT collector](https://aws-otel.github.io/docs/getting-started/collector) which provides an AWS containerized version of the collector ready to be used. The ADOT collector will function as the main gateway to gather tracing information from the Pokeshop API Lambdas.
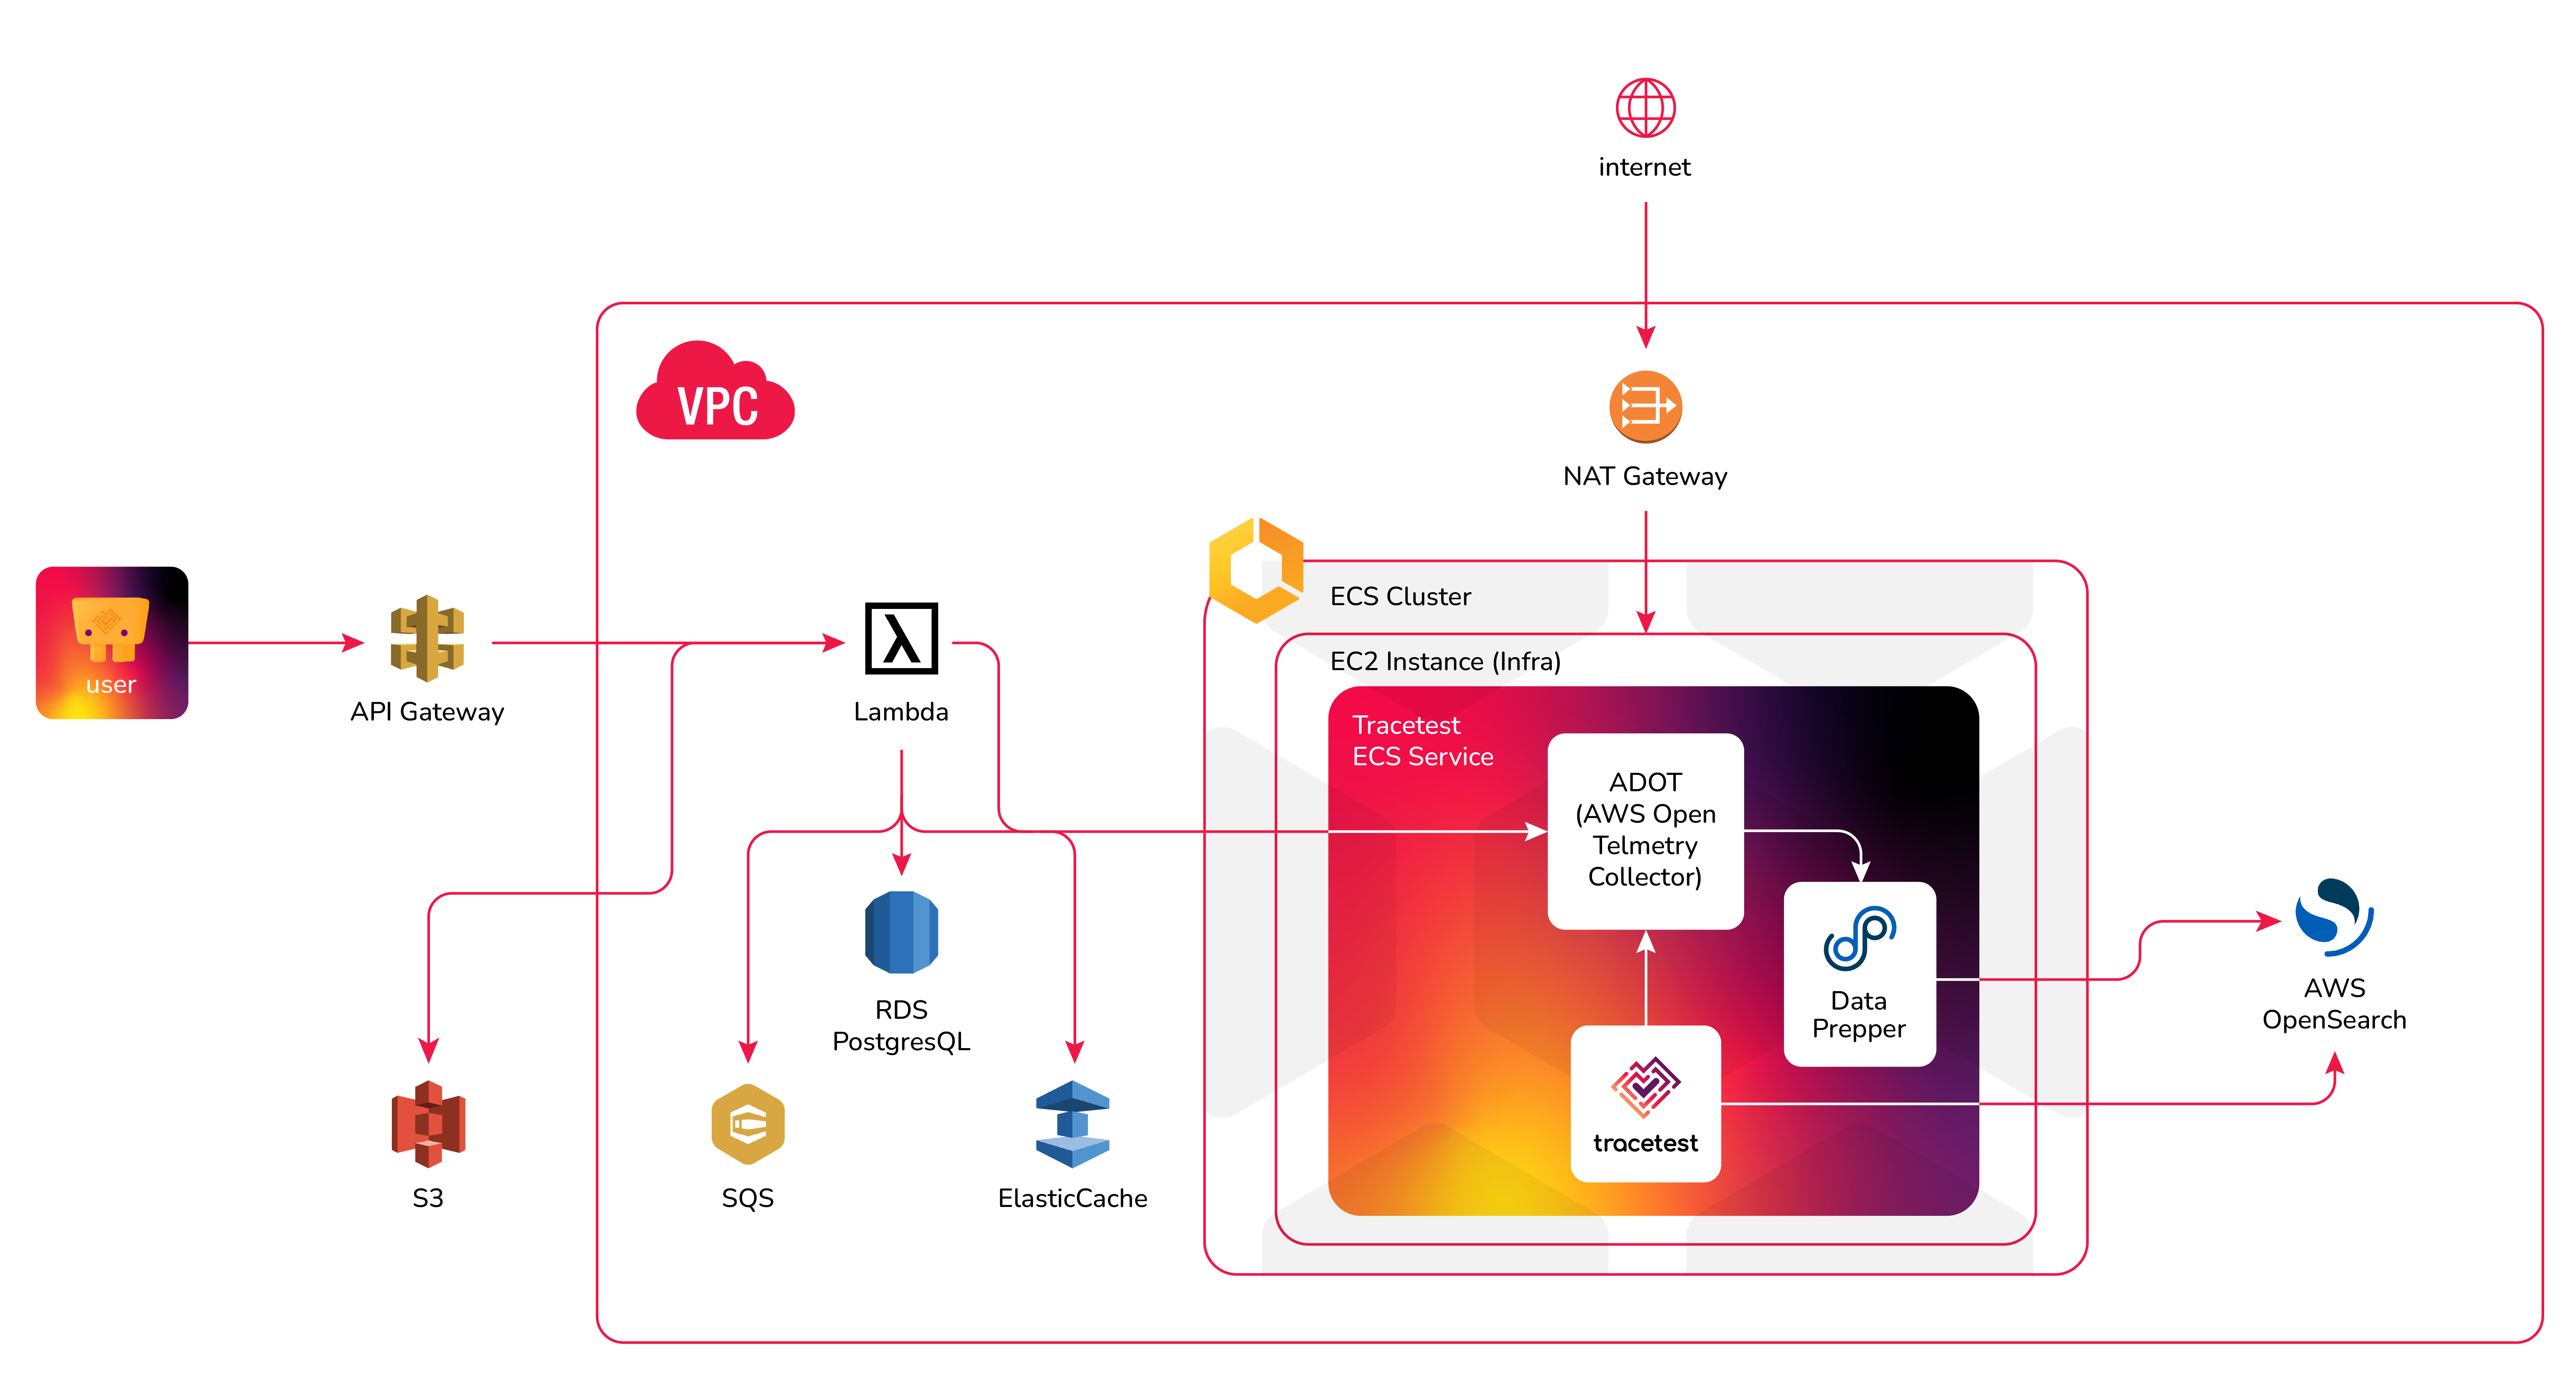
### OpenTelemetry Tracing Data Flow
The final destination should be an OpenSearch domain that will be the store for all of our trace data.
When it comes to using OpenSearch as a store for OpenTelemetry data, there’s a particular caveat that needs to be addressed before it can be added to the stack. OpenSearch doesn’t automatically support the [OpenTelemetry protocol](https://opentelemetry.io/docs/reference/specification/protocol/otlp/#:~:text=OpenTelemetry%20Protocol%20(OTLP)%20specification%20describes,the%20scope%20of%20OpenTelemetry%20project.) so it requires a proxy service called [Data Prepper](https://opensearch.org/docs/2.4/data-prepper/index/) to be used as a processing proxy to translate the data coming from the ADOT collector into a format that OpenSearch can use.
### Tracetest Trace-based Testing Data Flow
The Tracetest ECS Service will fetch trace data from OpenSearch when you run a test against a lambda function endpoint. Check the [task-definition.yaml](https://github.com/kubeshop/pokeshop/blob/master/serverless/infra/task-definition.yml) to see how to configure Tracetest, ADOT, and the Data Prepper.
For more clarity, check out the entire [config folder in the GitHub repo](https://github.com/kubeshop/pokeshop/tree/master/serverless/config) and the [tracetest-config.yaml](https://github.com/kubeshop/pokeshop/blob/master/serverless/config/tracetest-config.yaml) to see that Tracetest will fetch trace data from the OpenSearch instance.
To better visualize the data flow you can refer to the following diagram:
### Pokeshop API AWS Resources
Lastly, we need to provide the required infrastructure used by the main application. The Pokeshop API uses the following external services to emulate a more complex distributed system:
- **RDS (Postgres)**. Main storage for the Pokeshop API.
- **Elasticache (Redis)**. In memory storage for featured Pokemons.
- **SQS**. The async messaging queue for Pokemon imports.
- **S3**. For Pokemon image upload.
After that, everything should be ready for us to start adding the code implementation for the services and the instrumentation.
## Using Serverless to Deploy the Infrastructure
Serverless makes it possible to use custom Cloudformation Templates to provision the AWS resources we need. The goal is to have a single command to deploy all of the required infrastructure so you can start playing with the demo by yourself with minimal friction.
First, let’s have a look at the `serverless.yaml` to see the entire layout [here](https://github.com/kubeshop/pokeshop/blob/master/serverless/serverless.yml). We’ll walk through the different sections and what they are used for.
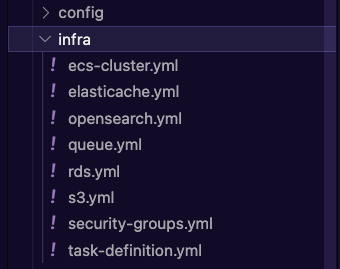
You can find all of the definitions for the AWS resources within the [`/serverless/infra` folder in the Pokeshop repo](https://github.com/kubeshop/pokeshop/tree/master/serverless/infra).
Here’s what the files looks like:
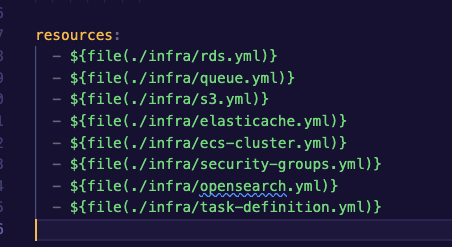
And, how we load them into the `serverless.yaml` as resources:
**Note**: If you are following the Pokeshop repo README you’ll find a step-by-step tutorial on how to deploy this demo yourself.
## OpenTelemetry Instrumentation for AWS Lambda
Once we have defined the required resources and have everything ready, we can start working on the Pokeshop services and how to instrument them.
For simplicity, we are going to go over the creation of the `get all pokemon` service, which is going to return the total count plus the first 20 results from the database.
With [Prisma](https://www.prisma.io/) we will generate the client based on the schema definition file. Then, use it to communicate with the database.
We’ll do this by executing the following command:
```bash
npx prisma generate
```
Once that’s done, we can proceed by adding the handler function where we can use the ORM client to fetch both the number of items and the list.
```tsx
import { PromiseHandler } from '@lambda-middleware/utils';
import { prisma } from '../utils/db';
const get: PromiseHandler = async ({ queryStringParameters }, context) => {
context.callbackWaitsForEmptyEventLoop = false;
const { skip = '0', take = '20' } = queryStringParameters || {};
const query = { skip: +skip, take: +take };
const [items, totalCount] = await Promise.all([prisma.pokemon.findMany(query), prisma.pokemon.count()]);
return {
totalCount,
items,
};
};
export default get;
```
Having that ready, we can focus on integrating the instrumentation for our lambda functions. Start by creating a JavaScript named `tracer.js` that will be preloaded before the handler functions for each of the services.
We will be adding the base implementation for the Node provider, the creation of the GRPC exporter, the propagation configuration, and the auto instrumentation for Node.js and Prisma.
```tsx
const { SimpleSpanProcessor } = require('@opentelemetry/sdk-trace-base');
const { NodeTracerProvider } = require('@opentelemetry/sdk-trace-node');
const { registerInstrumentations } = require('@opentelemetry/instrumentation');
const { getNodeAutoInstrumentations } = require('@opentelemetry/auto-instrumentations-node');
const { OTLPTraceExporter } = require('@opentelemetry/exporter-trace-otlp-grpc');
const { PrismaInstrumentation } = require('@prisma/instrumentation');
const { Resource } = require('@opentelemetry/resources');
const { SemanticResourceAttributes } = require('@opentelemetry/semantic-conventions');
const { B3Propagator, B3InjectEncoding } = require('@opentelemetry/propagator-b3');
const api = require('@opentelemetry/api');
api.diag.setLogger(new api.DiagConsoleLogger(), api.DiagLogLevel.ALL);
api.propagation.setGlobalPropagator(new B3Propagator({ injectEncoding: B3InjectEncoding.MULTI_HEADER }));
const collectorOptions = {
url: process.env.COLLECTOR_ENDPOINT,
};
const provider = new NodeTracerProvider({
resource: new Resource({
[SemanticResourceAttributes.SERVICE_NAME]: 'pokeshop-api',
}),
});
const exporter = new OTLPTraceExporter(collectorOptions);
provider.addSpanProcessor(new SimpleSpanProcessor(exporter));
registerInstrumentations({
instrumentations: [
getNodeAutoInstrumentations({
'@opentelemetry/instrumentation-aws-lambda': {
disableAwsContextPropagation: true,
},
}),
new PrismaInstrumentation(),
],
});
provider.register();
['SIGINT', 'SIGTERM'].forEach(signal => {
process.on(signal, () => provider.shutdown().catch(console.error));
});
```
This file will be included as part of the bundle by configuring the package options in the `serverless.yaml` files.
To avoid including unwanted files and make sure the bundle is below the maximum size, we can decide which modules to include.
Your `serverless.yaml` should look like this:
```yaml
package:
patterns:
- src/**
- "!.vscode/**"
- "!infra/**"
- "!node_modules/typescript/**"
- "!node_modules/aws-sdk/**"
- "!node_modules/serverless-offline/**"
- "!node_modules/.prisma/client/libquery_engine-*"
- "node_modules/.prisma/client/libquery_engine-rhel-*"
- "!node_modules/prisma/libquery_engine-*"
- "!node_modules/@prisma/engines/**"
```
Next, we need to configure environment variables for our lambda functions to be able to connect to our different AWS resources. To avoid hardcoding any configuration we can use the dynamic refs that are available as part of the Cloudformation Template System.
```yaml
environment:
NODE_OPTIONS: --require ./src/utils/tracer.js
COLLECTOR_ENDPOINT:
Fn::Join:
- ""
- - "http://"
- { Ref: ECSEIP }
- ":4317"
DATABASE_URL:
Fn::Join:
- ""
- - "postgres://"
- ${self:custom.databaseUsername}
- ":"
- ${self:custom.databasePassword}
- "@"
- ${self:custom.databaseEndpoint}
- "/"
- ${self:custom.databaseName}
- "?schema=public"
SQS_QUEUE_URL: { Ref: AssetsQueue }
S3_ARN: { Ref: ImageBucket }
POKE_API_BASE_URL: "https://pokeapi.co/api/v2"
REDIS_URL:
Fn::GetAtt: [PokeCache, "RedisEndpoint.Address"]
```
The first entry for `NODE_OPTIONS` specifies that our new `tracer.js` file will be required before any handler function. That way we can be sure the OpenTelemetry instrumentation configuration is always loaded first and available from the handler functions in case we want to add manual instrumentation.
**Note**: You can find the full [serverless.yaml](https://github.com/kubeshop/pokeshop/blob/master/serverless/serverless.yml) file in the Pokeshop repo.
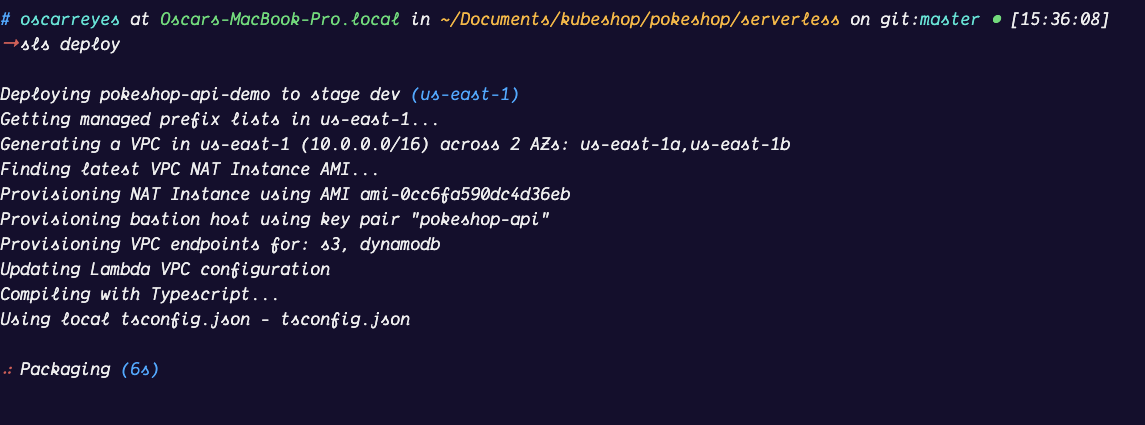
Once we have the handler function, the tracer logic, and the `serverless.yaml` file ready. We can run the initial `serverless deploy` command that will start packaging the Node.js bundle and trigger the initial creation of all AWS resources.
```yaml
sls deploy
```
**Note**: If you want to learn more about how to instrument a Serverless Lambda Function you can head to the [OpenTelemetry official documentation](https://opentelemetry.io/docs/instrumentation/js/serverless/).
## OpenSearch Configuration
In this section, we’ll configure OpenSearch as our trace data store.
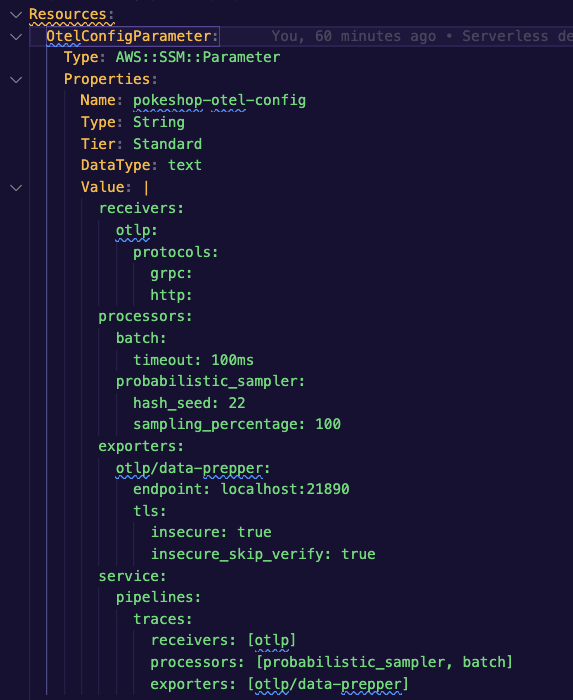
### ADOT Collector configuration
The Docker version of the collector provides a way to inject the configuration from an environment variable, which matches a regular configuration for the OpenTelemetry collector.
We’ll be using SSM to store the variable and to be injected directly into the container during execution.
The collector should be pointing to the same EC2 instance we’ll be using for the data prepper. You can see this in the [`task-definition.yaml`](https://github.com/kubeshop/pokeshop/blob/master/serverless/infra/task-definition.yml).
### Data Prepper Configuration
At the time I’m writing this post, the Docker image for Data Prepper doesn’t support a way to inject the config through environment variables, so, in this case, we’ll need to use the Docker volume where we’ll be dropping the config files using SSH.
The Data Prepper config should point to the OpenSearch VPC endpoint which will be secured behind a private subnet.
### AWS RDS Database Setup
Besides the resource creation, there is one more thing that needs to be done to prepare the database schema for the API queries. To achieve this, we will be using an SSH tunnel that binds the RDS Postgres port to your local machine so we can run the Prisma migrations against it.
Once we have the infrastructure ready to use, we can start executing some validation checks. In order to do this we have to gather some information first. The list of things we need and how to get them is the following:
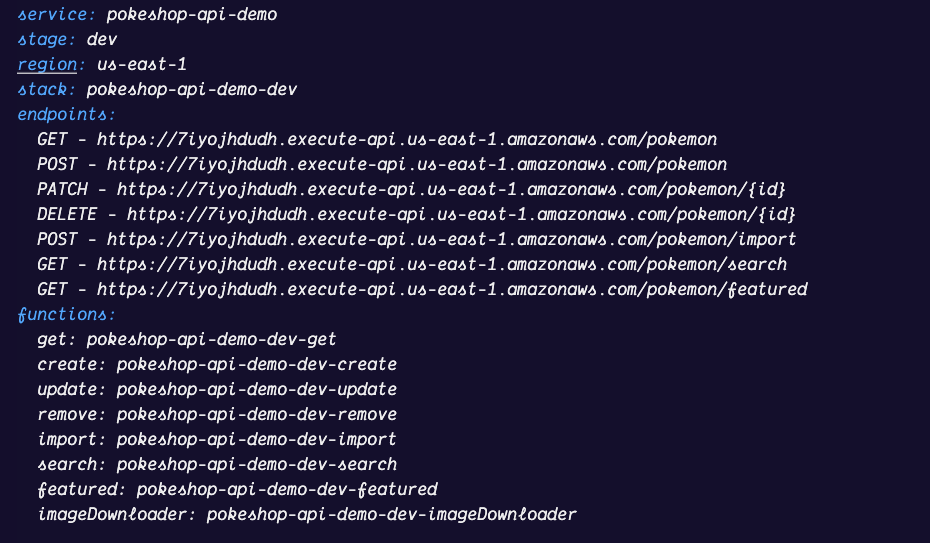
1. Serverless API endpoints. You will find the endpoints as outputs from the `serverless deploy` command.
2. ECS Instance associated Public Elastic IP. You can find it as part of the outputs from the AWS Cloudformation stack.
3. OpenSearch VPC endpoint. This can also be found as an output from the stack.
Next, let’s create an SSH tunnel from your local machine to the OpenSearch secure endpoint. We are going to be using the created SSH key to achieve this, the command should look like this:
```yaml
ssh -i "pokeshop-api.pem" -N -L 9200:<opensearch-vpc-endpoint>:443 ec2-user@<elastic-ip>
```
We can now access the localhost port to reach the OpenSearch instance. It should be accessible at `localhost:9200/_dashboards`. There you’ll find yourself looking at a login form that looks like this:
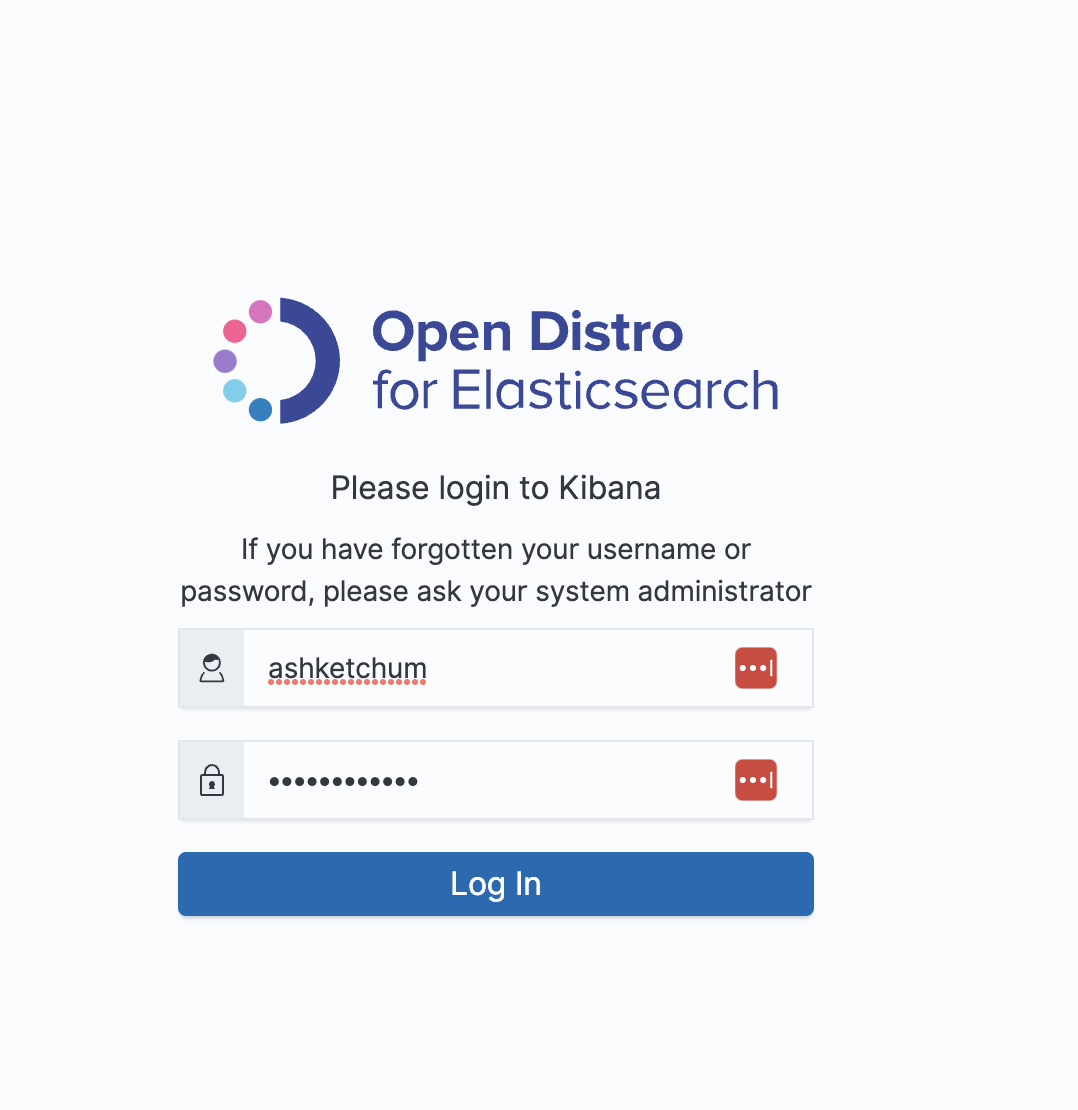
Add the username and password from the `serverless.yaml` file and you will have access to the dashboard.
Open the Trace Analytics section and you’ll find all of the data produced by the Serverless API endpoints.
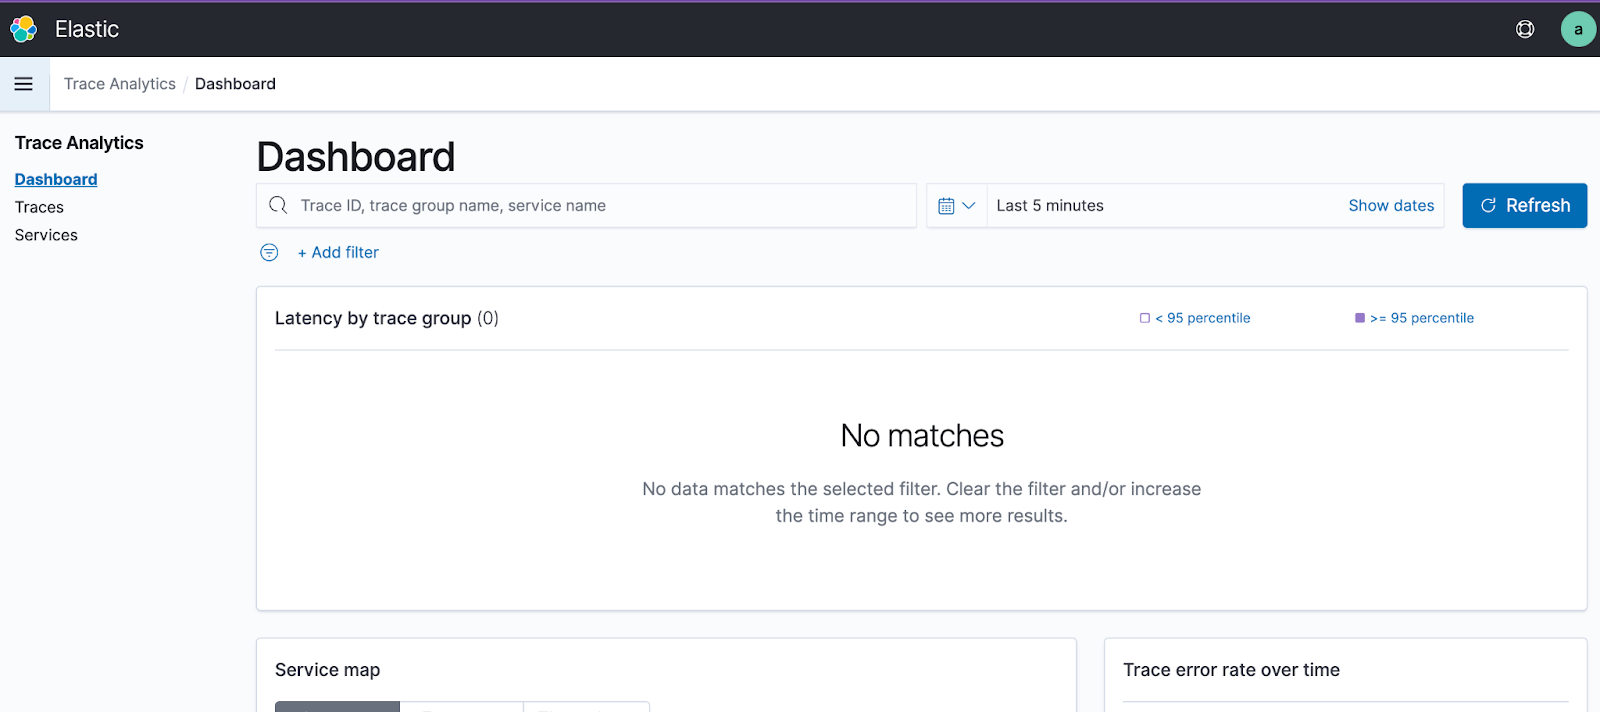
## Test the OpenTelemetry Instrumentation in your Infrastructure
Triggering one of the AWS Lambda functions will generate trace data.
The whole process consists of sending trace data to the OpenTelemetry collector. From there, it continues to the Data Prepper, and finally to OpenSearch where the trace data is stored.
Let’s run a test against the POST endpoint to create a new pokemon with CURL.
```yaml
curl --location --request GET 'https://d0lith9uac.execute-api.us-east-1.amazonaws.com/pokemon'
```
**Note**: AWS Lambda cold start can be a little bit slow but it should speed up after the initial 3x requests.
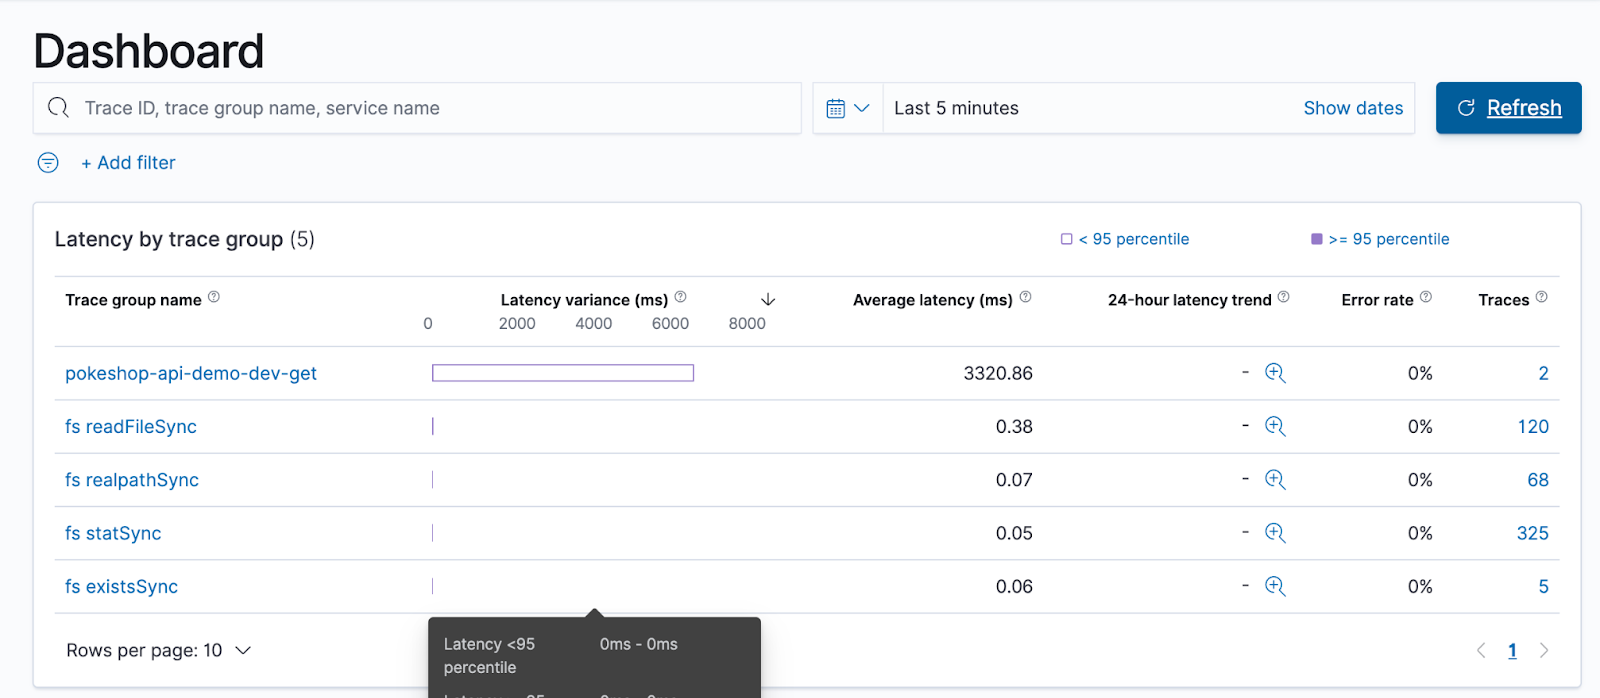
After doing all of this, you can come back to the OpenSearch dashboard and find the tracing information.
Congratulations! You have successfully provided the required AWS infrastructure and instrumented your first AWS Lambda function using Serverless.
You can now tell your peers how great and important tracing is!
But, it doesn’t end here. In the next section, we’ll go into detail about trace-based testing and how it is a crucial component in your infrastructure.
## Trace-based Testing
Testing large distributed systems and multiple microservices is hard. You need to understand how the whole system works, including how all microservices interconnect.
With tracing you get a map of all services which makes your whole system easier to understand. But, let’s take it a step further. With trace-based testing, you can enrich your end-to-end and integration tests and leverage trace data to improve assertion capabilities.
Now, you can set test specs and assertions against every single trace data point in a transaction, not just the response. Pretty cool, right?
That’s where Tracetest comes into play.
## What is Tracetest?
Tracetest is the next-generation, open-source project for running end-to-end, system, and integration tests for distributed systems, powered by OpenTelemetry traces. It uses the observability you enabled by implementing a distributed tracing solution to empower a totally new, modern way of testing.
With Tracetest, you can create tests and transactions based on the common request patterns or pain points of your application. You can also create assertions based on the different attributes that are part of the spans generated by your application instrumentation.
- Do you have an internal GRPc that you want to start validating? We have that covered.
- Do you want to enable trace-based testing to the booking funnel of your application? That is possible with Tracetest.
- Do you want to run trace-based validations as part of your CI/CD process? Done!
## How to Use Tracetest
Tracetest will work alongside whatever instrumentation setup you have. We’ve used AWS and Serverless, but you can achieve the same results by using any type of infrastructure.
Tracetest supports triggers for:
- HTTP
- GRPc
- CURL Commands
- Postman Collections/Environments
There are two ways of using Tracetest.
**First, you can use the visual interface**. The GUI allows users to create different assertions to validate trace data. It empowers users with a more visual representation for traces, displaying different graphical views and shortcuts for easy test spec creation.
**Second, you can use the Tracetest CLI**. With the CLI you can add trace-based tests to your CI/CD pipelines. Now, you can run integration tests with test specs that assert against trace data from every single part of the transaction. You’re not just limited to unit tests and boring response-only integration tests anymore. Welcome to the future!
## How to Create Trace-based Tests with Tracetest
For this, you need to get the ECS instance associated with the Public Elastic IP. You can find it as part of the outputs from the AWS CloudFormation stack. You can now access Tracetest through the ECS instance’s associated Elastic IP. Tracetest uses port number `11633`.
In our infrastructure, it would be this link: `ecs-domain.us-west-1.aws.com:11633`.
Check your infrastructure configuration and open up your Tracetest instance in a browser.
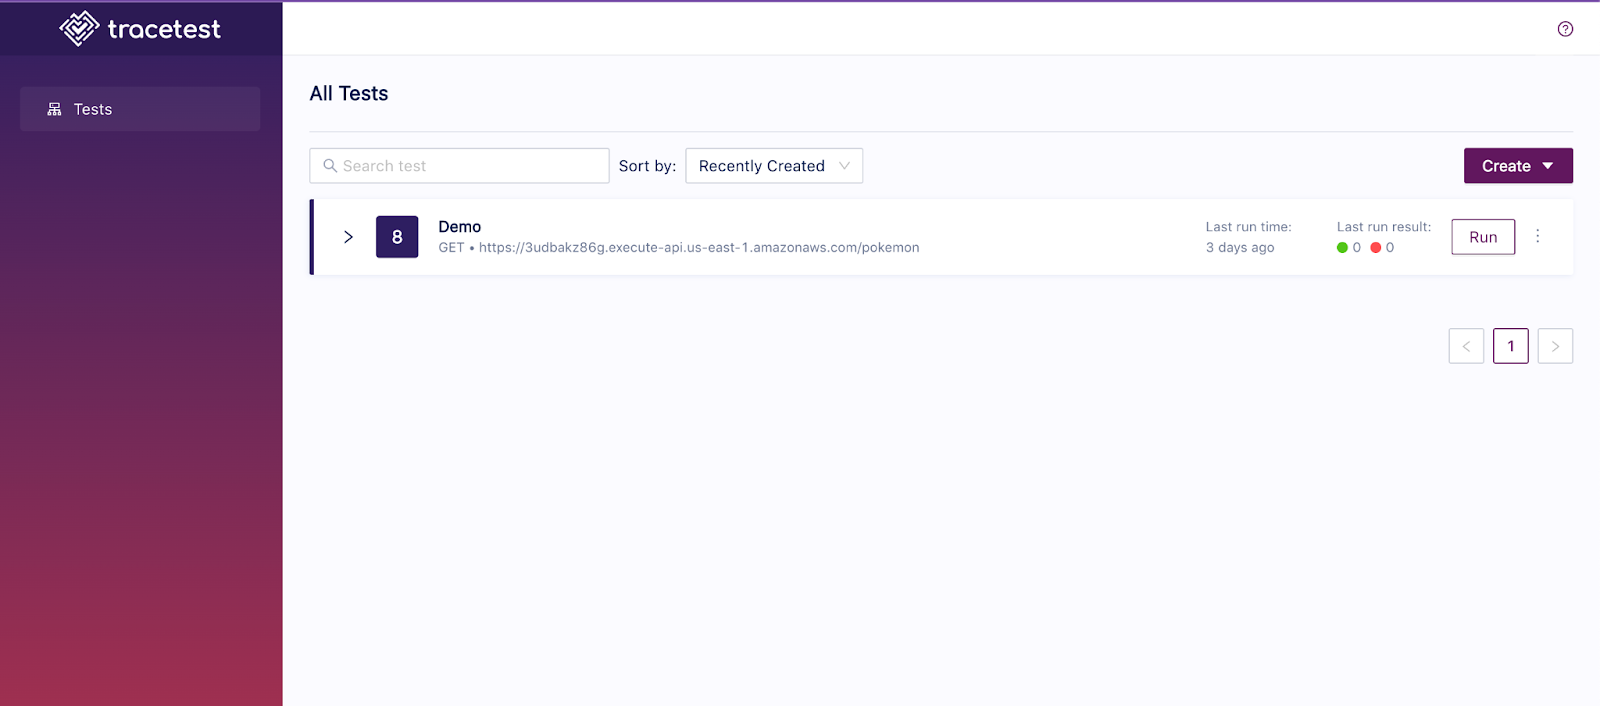
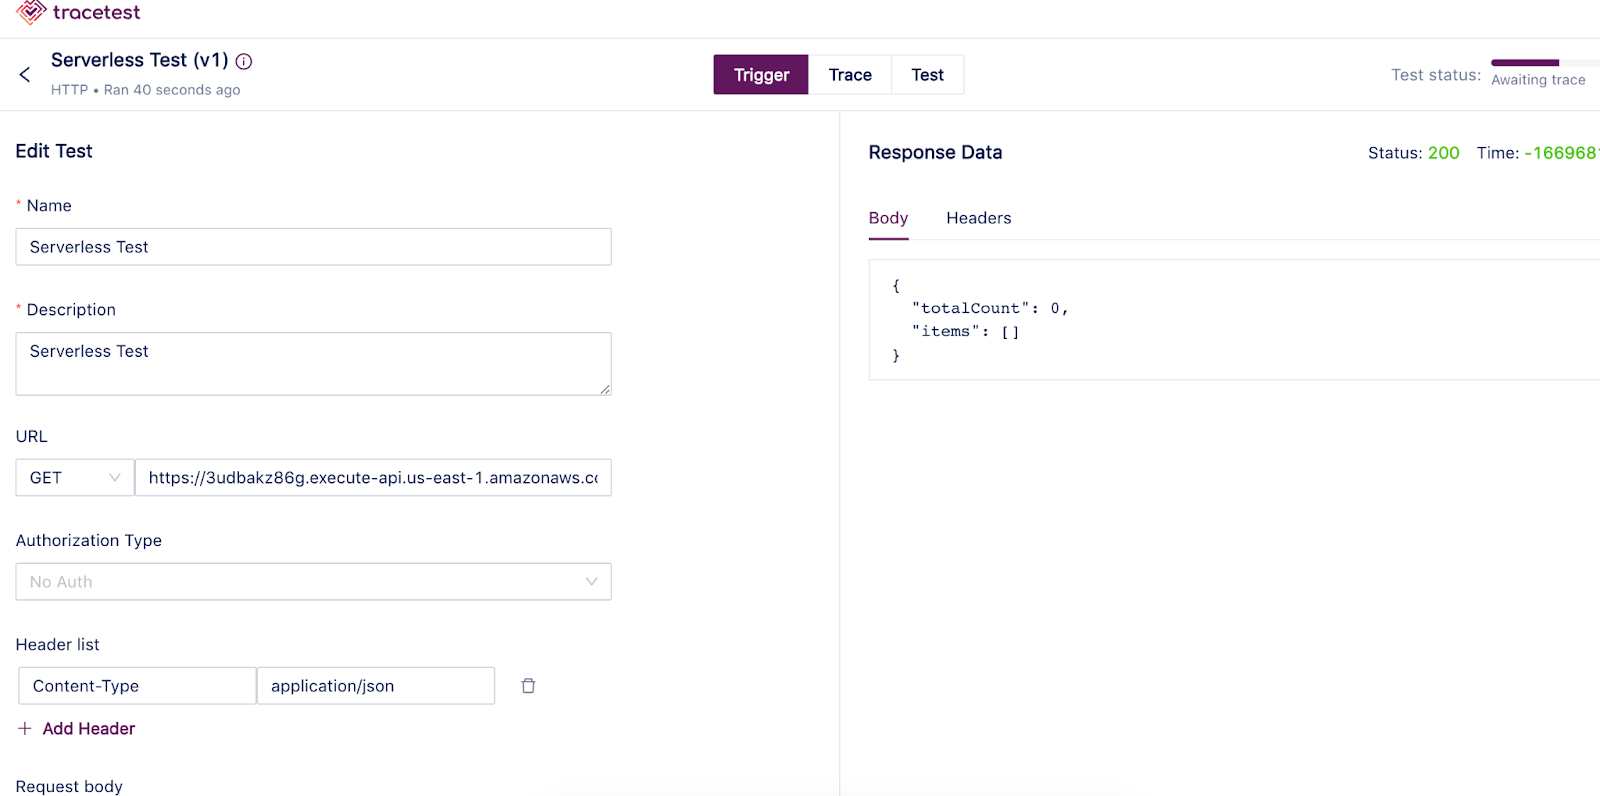
Create a new test and run a quick validation check. Copy-paste the same endpoint we used above with CURL.
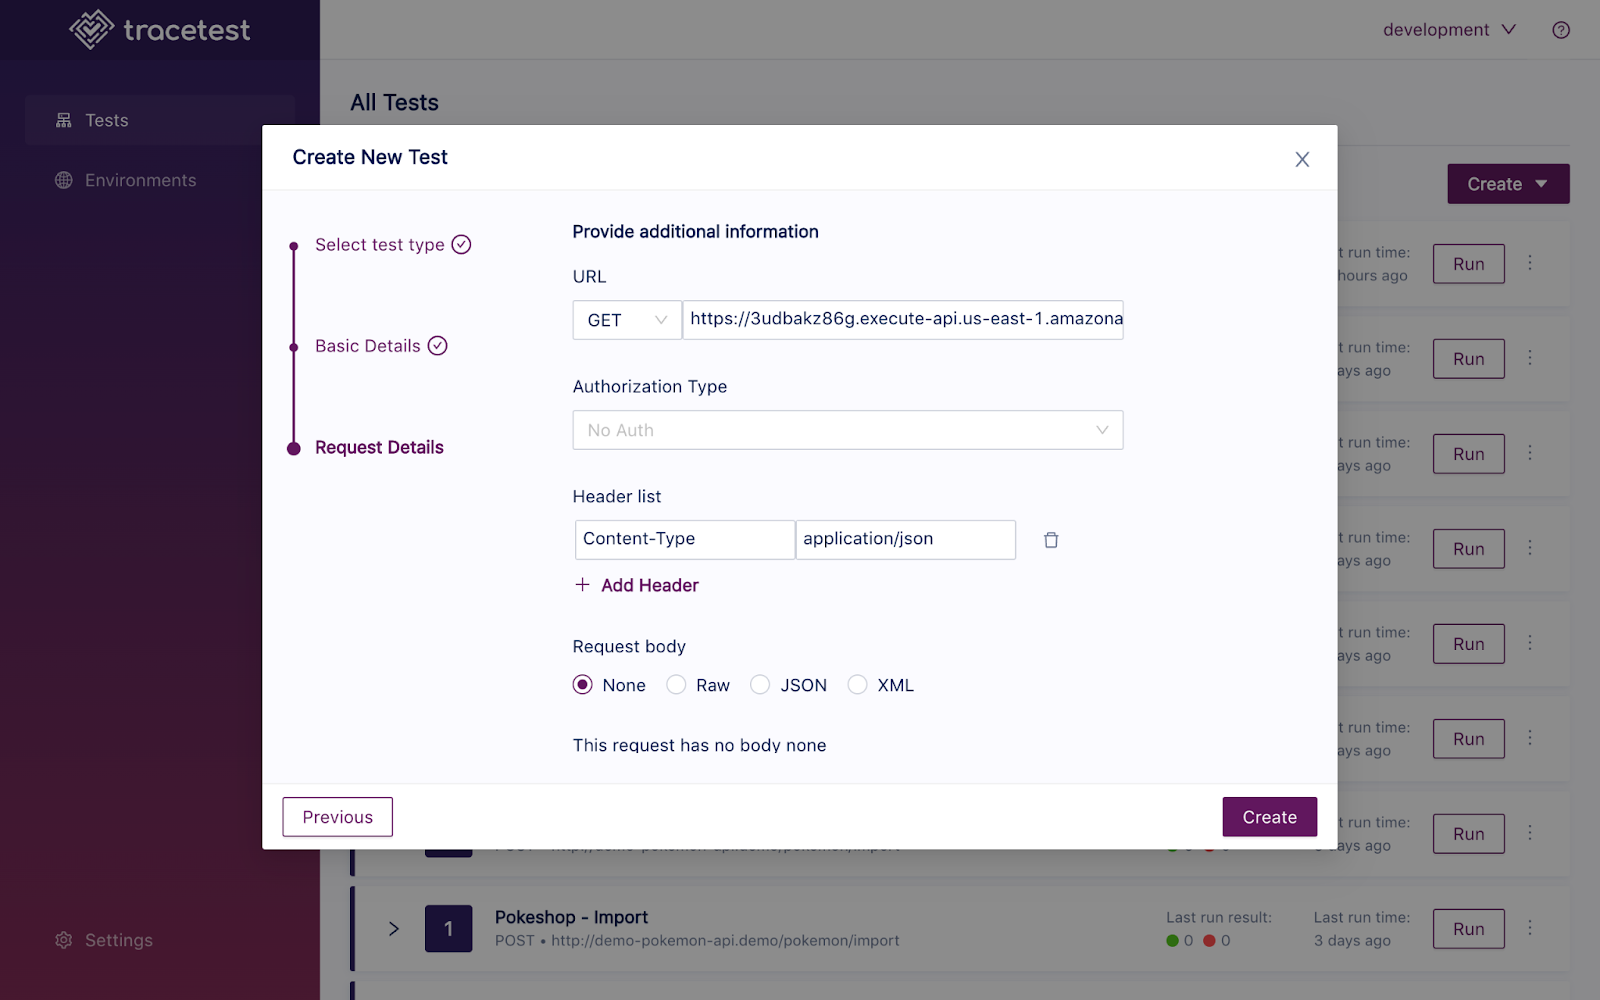
The first thing you’ll see after creating a test will be the initial service request and response, where you can validate if the endpoint you are using is accessible and if the setup is correct.
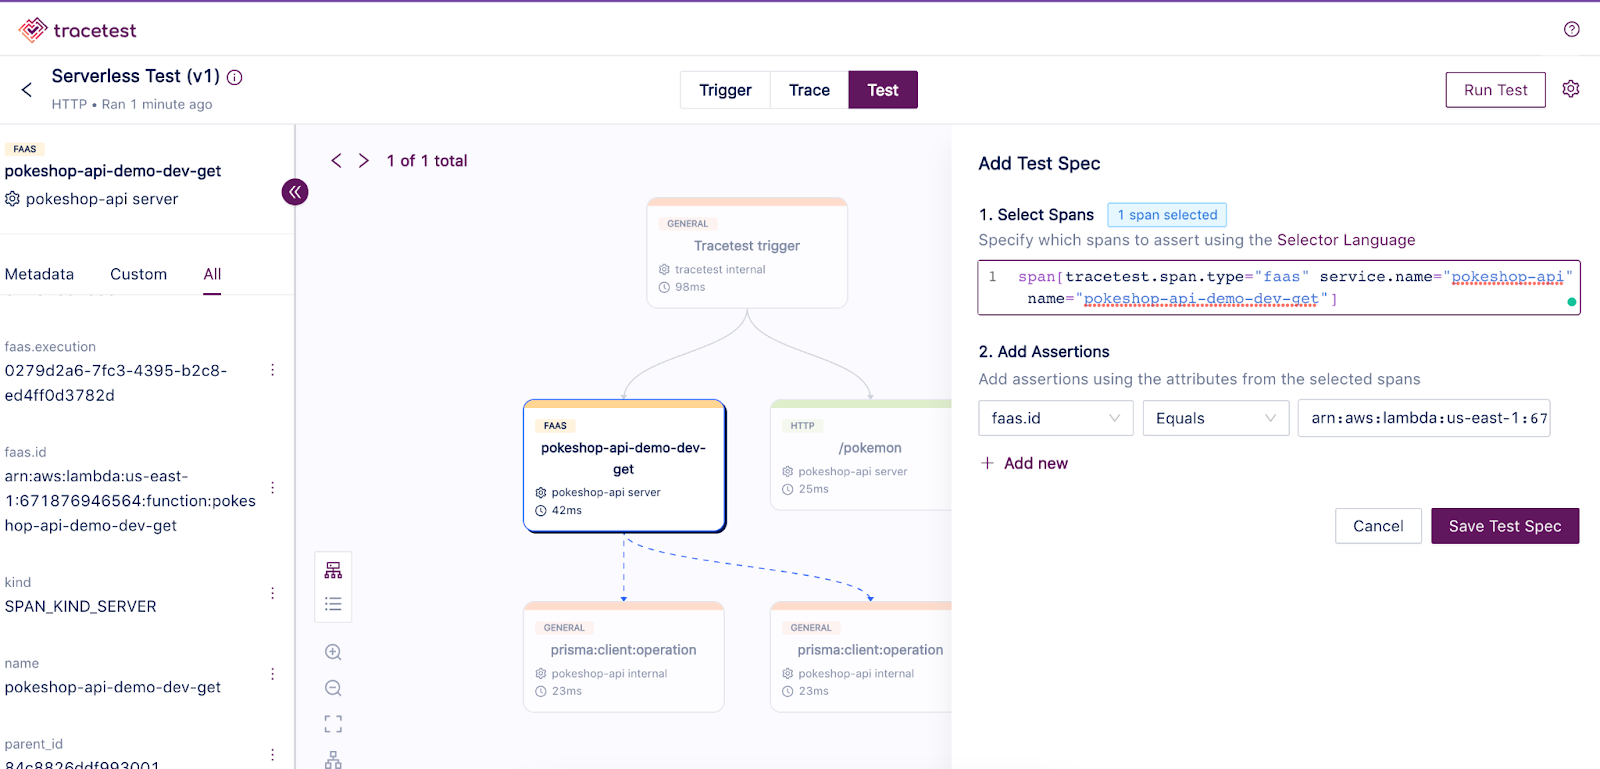
If everything is working as expected, the test run will change to a completed state. Now you can navigate to the test tab and start adding assertions based on the generated trace spans. Check out the [Tracetest docs for more information about adding assertions](https://docs.tracetest.io/using-tracetest/adding-assertions).
**Note**: If you are using the [automated script provided](https://github.com/kubeshop/pokeshop/blob/master/serverless/scripts/deploy.sh) as part of the Pokeshop Serverless README Tracetest will be automatically deployed and configured.
## Conclusion
OpenTelemetry is a great tool to better understand the internal processes of a microservices application. It outlines different techniques that are used to provide better insight into what is happening within the system, the different asynchronous processes, and how the data flows.
And as every team might be looking to start using it, coming from different backgrounds and using different stacks, we at Tracetest want to provide a way for teams that are using AWS and the Serverless Framework to start that process.
At Tracetest, we are committed to the community and we are always looking for ways to help and contribute to improving OpenTelemetry adoption by providing tutorials and assisting teams. If you have any questions or you want to reach out you can always find us in our official [Slack channel](https://dub.sh/tracetest-community). Feel free to [give us a star on GitHub](https://github.com/kubeshop/tracetest) if you like Tracetest!
Thank you for reading this tutorial and happy coding.
.jpg)
.avif)
.avif)