
Observability-driven development with Go and Tracetest


Hands-on tutorial covering observability-driven development, how to develop microservices with Go & how to run trace-based tests with Tracetest.
Table of Contents
We’re entering a new era of [observability-driven development](https://stackoverflow.blog/2022/10/12/how-observability-driven-development-creates-elite-performers/). ODD uses OpenTelemetry instrumentation as assertions in tests!
> [Here's](https://twitter.com/mipsytipsy/status/1203578004397383681) an awesome explanation on Twitter!
This is driving a new culture of [trace-based testing](https://tracetest.io/blog/introducing-tracetest-trace-based-testing-with-opentelemetry). With trace-based testing, you can generate integration tests from OpenTelemetry-based traces, enforce quality, encourage velocity, and increase test coverage in microservices and distributed apps.
Today, you’ll learn to build a distributed system with Go and Docker. You’ll instrument it with OpenTelemetry traces and use Tracetest to run trace-based tests on top of OpenTelemetry infrastructure.
We’ll follow observability-driven development principles and showcase why it’s powerful in today’s world of developing distributed systems in the cloud.
By the end of this tutorial you’ll learn observability-driven development, how to develop microservices with Go, and how to run trace-based tests with Tracetest.
To check out the [entire code, jump over to GitHub](https://github.com/kubeshop/tracetest/tree/main/examples/observability-driven-development-go-tracetest/bookstore).
## What are we building?
The distributed app we’re building will have two microservices and a dedicated module for OpenTelemetry trace instrumentation.
We’ll use Go to write the code and Docker Compose to deploy the microservices. The app itself is a bookstore that shows books with their price and availability.
We will follow observability-driven development best practices of first writing a test, then writing the code and adding OpenTelemetry instrumentation to validate the test spec, and finally run trace-based tests with Tracetest and make sure they pass
The tutorial consists of 3 parts.
The first part will be dedicated to configuring the basic bookstore infrastructure and books service, setting up OpenTelemetry instrumentation, and installing Tracetest.
In the second part we will focus on running ODD tests hands-on and creating trace-based tests for the books service.
The third, and final, part will focus on creating the availability service and covering it with tests.
Before we begin, let’s quickly explain what OpenTelemetry and Tracetest are.
## What is OpenTelemetry?
[OpenTelemetry](https://opentelemetry.io/) is an observability framework that assist in generating and capturing telemetry data from cloud-native software.
OpenTelemetry gathers observability data including traces, metrics, and logs.
OpenTelemetry is a community-driven open-source project and as of August 2021 is a CNCF incubating project. OpenTelemetry is the [second most active CNCF project](https://all.devstats.cncf.io/d/1/activity-repository-groups?orgId=1) behind Kubernetes.
These are the three components we’ll use in this guide:
- [OpenTelemetry Go APIs and SDKs](https://opentelemetry.io/docs/instrumentation/go/manual/) for generating and emitting telemetry
- [OpenTelemetry Collector](https://opentelemetry.io/docs/collector/) to receive, process and export telemetry data
- [OTLP protocol](https://opentelemetry.io/docs/reference/specification/protocol/) for transmitting telemetry data
Because OpenTelemetry is a framework, you need a data store to persist traces. We’ll demo how to use Jaeger as the trace data store and the OpenTelemetry Collector as the gateway to funnel traces to Jaeger for storage.
## What is Tracetest?
[Tracetest](https://tracetest.io/) uses your existing [OpenTelemetry](https://opentelemetry.io/docs/getting-started/) traces to power trace-based testing with assertions against your trace data at every point of the request transaction.
You’ll point Tracetest to the existing Jaeger trace data source. Tracetest will then pull traces from Jaeger while running integration tests to run assertions against the trace data itself.
There is an option to bypass using a trace data store entirely, and send traces to Tracetest right away by configuring the OpenTelemetry collector as [explained in our docs](https://docs.tracetest.io/configuration/connecting-to-data-stores/opentelemetry-collector).
With that, we’re ready to start coding!
## Setting up the infrastructure for observability-driven development
This section will explain the initial configuration of both the bookstore app and Tracetest. We’ll use Docker Compose for the infrastructure. Once done, you’ll have a running app with Tracetest configured for running tests.
### Installing Tracetest for local development
You can follow the [sample code we’ve prepared for part 1 of this tutorial](https://github.com/kubeshop/tracetest/tree/main/examples/observability-driven-development-go-tracetest/bookstore/part1). Follow the instructions below:
```bash
git clone git@github.com:kubeshop/tracetest.git
cd examples/observability-driven-development-go-tracetest/bookstore/part1
docker compose -f docker-compose.yaml -f tracetest/docker-compose.yaml up
```
Let’s walk through the installation step-by-step.
Start by installing the Tracetest CLI. It’s the easiest way of getting started with Tracetest.
```bash
brew install kubeshop/tracetest/tracetest
```
Note: Follow [this guide](https://docs.tracetest.io/getting-started/installation) to install for your specific operating system.
Once the CLI is installed, create a directory called `bookstore`, and install a Tracetest server.
```bash
tracetest server install
```
Follow the prompts and install a bare-bones setup with just Tracetest. This will generate an empty `docker-compose.yaml` file and a `./tracetest/` directory that contains another `docker-compose.yaml`.
### Configuring OpenTelemetry Collector and Jaeger with Tracetest
Let’s edit the `docker-compose.yaml` to add OpenTelemetry Collector and Jaeger.
```yaml
# ./tracetest/docker-compose.yaml
services:
jaeger:
healthcheck:
test:
- CMD
- wget
- --spider
- localhost:16686
timeout: 3s
interval: 1s
retries: 60
image: jaegertracing/all-in-one:latest
networks:
default: null
restart: unless-stopped
otel-collector:
command:
- --config
- /otel-local-config.yaml
depends_on:
jaeger:
condition: service_started
image: otel/opentelemetry-collector:0.54.0
networks:
default: null
volumes:
- type: bind
source: tracetest/otel-collector.yaml
target: /otel-local-config.yaml
bind:
create_host_path: true
postgres:
environment:
POSTGRES_PASSWORD: postgres
POSTGRES_USER: postgres
healthcheck:
test:
- CMD-SHELL
- pg_isready -U "$$POSTGRES_USER" -d "$$POSTGRES_DB"
timeout: 5s
interval: 1s
retries: 60
image: postgres:14
networks:
default: null
tracetest:
depends_on:
otel-collector:
condition: service_started
postgres:
condition: service_healthy
extra_hosts:
host.docker.internal: host-gateway
healthcheck:
test:
- CMD
- wget
- --spider
- localhost:11633
timeout: 3s
interval: 1s
retries: 60
image: kubeshop/tracetest:v0.9.3
networks:
default: null
ports:
- mode: ingress
target: 11633
published: 11633
protocol: tcp
volumes:
- type: bind
source: tracetest/tracetest.yaml
target: /app/config.yaml
networks:
default:
name: _default
```
Let me explain what’s going on in the `docker-compose.yaml` file:
- We hook up the OpenTelemetry Collector to act as a gateway for all the traces our app will generate and Jaeger as a trace data store.
- The OpenTelemetry Collector will receive all traces from our Go microservices and send them to Jaeger.
- We will then configure Tracetest to fetch trace data from Jaeger when running trace-based tests.
Make sure your config files for Tracetest and the OpenTelemetry Collector match the sample code. First copy-paste this into your `otel-collector.yaml`.
```yaml
# ./tracetest/otel-collector.yaml
exporters:
jaeger:
endpoint: jaeger:14250
tls:
insecure: true
processors:
batch:
timeout: 100ms
receivers:
otlp:
protocols:
grpc: null
http: null
service:
pipelines:
traces:
exporters:
- jaeger
processors:
- batch
receivers:
- otlp
```
Now, from the `bookstore` directory, start Docker Compose to test the Tracetest installation.
```bash
docker compose -f docker-compose.yaml -f tracetest/docker-compose.yaml up
```
This command will spin up the infrastructure, and expose Tracetest on port `11633`. Open up `http://localhost:11633/` in your browser.
Configure your trace data store to point to Jaeger in the Web UI.
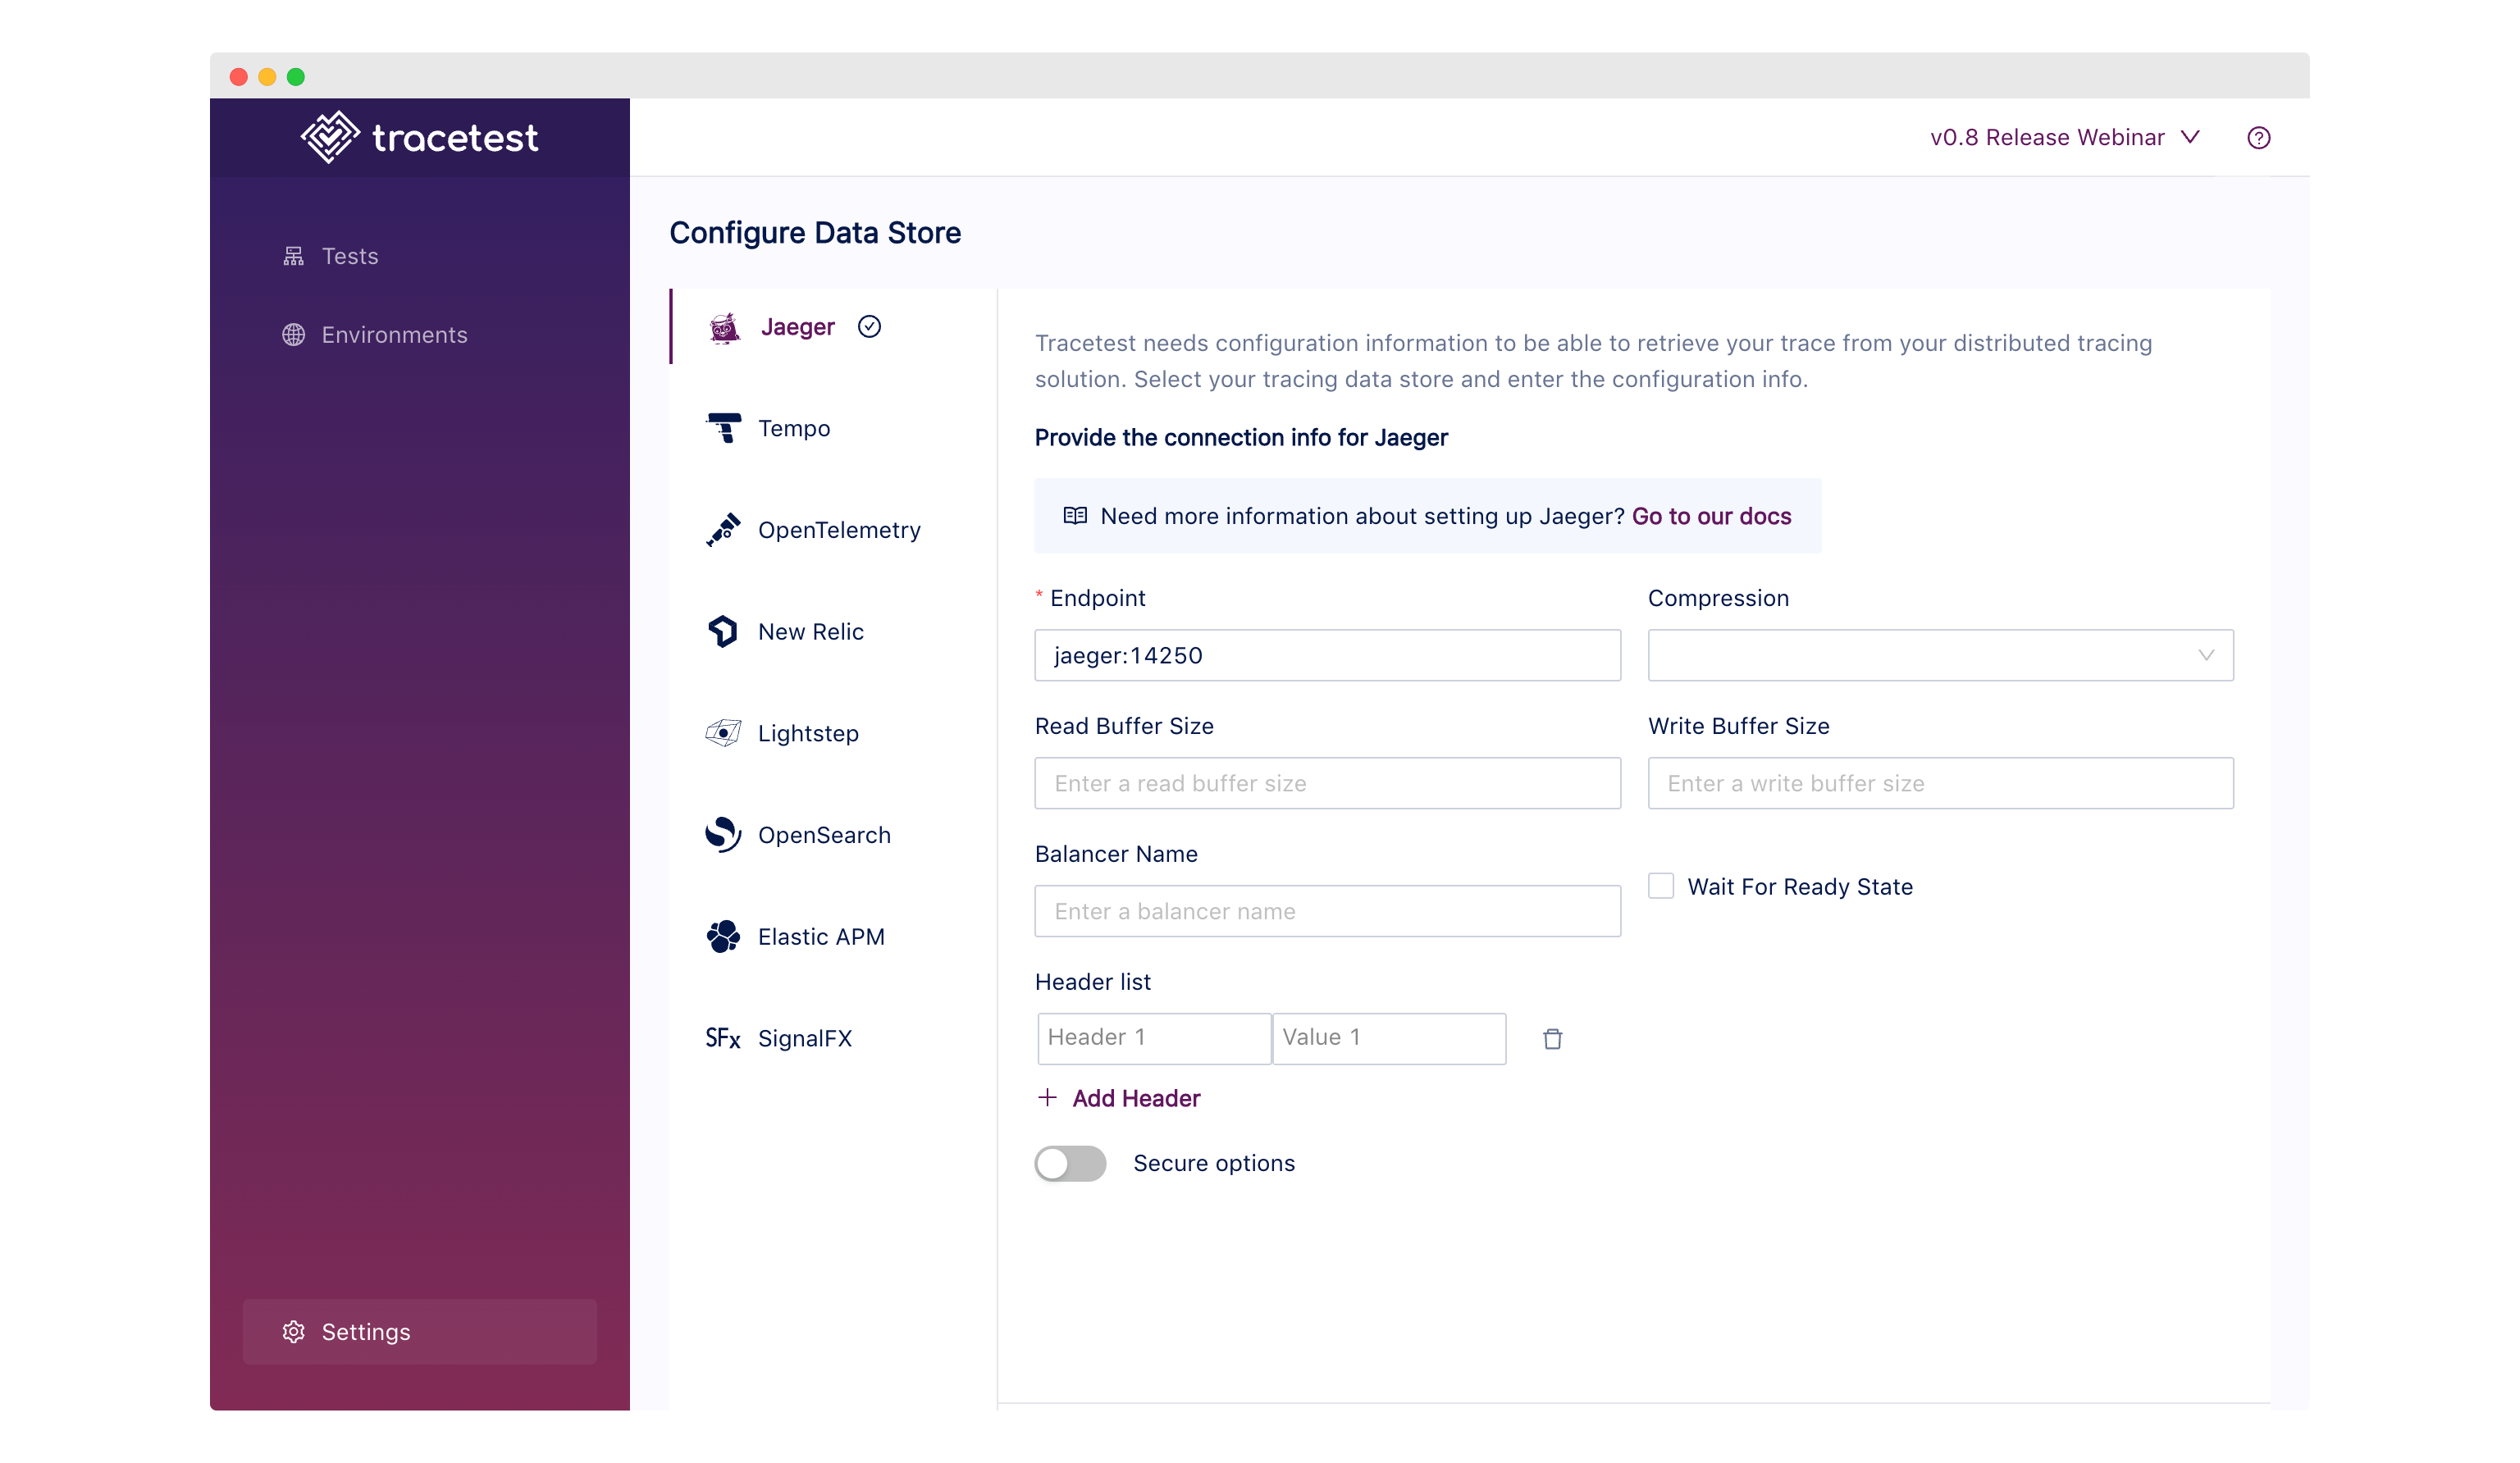
You can also [configure Jaeger via the CLI](https://docs.tracetest.io/cli/creating-data-stores#jaeger).
### Adding the `books` microservice
In the `bookstore` directory, create a `books` directory, and initialize a Go module.
```bash
cd ./books
go mod init github.com/your-username/bookstore/books
```
In the `books` directory create a `main.go` file. Paste this code into the `main.go`:
```go
// ./books/main.go
package main
import (
"context"
"fmt"
"io"
"log"
"net/http"
"time"
"github.com/gorilla/mux"
"go.opentelemetry.io/contrib/instrumentation/github.com/gorilla/mux/otelmux"
"go.opentelemetry.io/otel"
"go.opentelemetry.io/otel/exporters/otlp/otlptrace/otlptracegrpc"
"go.opentelemetry.io/otel/propagation"
"go.opentelemetry.io/otel/sdk/resource"
sdktrace "go.opentelemetry.io/otel/sdk/trace"
semconv "go.opentelemetry.io/otel/semconv/v1.12.0"
"go.opentelemetry.io/otel/trace"
"google.golang.org/grpc"
"google.golang.org/grpc/credentials/insecure"
)
const svcName = "books"
var tracer trace.Tracer
func newExporter(ctx context.Context) (sdktrace.SpanExporter, error) {
ctx, cancel := context.WithTimeout(ctx, time.Second)
defer cancel()
conn, err := grpc.DialContext(ctx, "otel-collector:4317", grpc.WithTransportCredentials(insecure.NewCredentials()), grpc.WithBlock())
if err != nil {
return nil, fmt.Errorf("failed to create gRPC connection to collector: %w", err)
}
traceExporter, err := otlptracegrpc.New(ctx, otlptracegrpc.WithGRPCConn(conn))
if err != nil {
return nil, fmt.Errorf("failed to create trace exporter: %w", err)
}
return traceExporter, nil
}
func newTraceProvider(exp sdktrace.SpanExporter) *sdktrace.TracerProvider {
// Ensure default SDK resources and the required service name are set.
r, err := resource.Merge(
resource.Default(),
resource.NewWithAttributes(
semconv.SchemaURL,
semconv.ServiceNameKey.String(svcName),
),
)
if err != nil {
panic(err)
}
tp := sdktrace.NewTracerProvider(
sdktrace.WithBatcher(exp),
sdktrace.WithResource(r),
)
otel.SetTextMapPropagator(
propagation.NewCompositeTextMapPropagator(
propagation.TraceContext{},
propagation.Baggage{},
),
)
return tp
}
func main() {
ctx := context.Background()
exp, err := newExporter(ctx)
if err != nil {
log.Fatalf("failed to initialize exporter: %v", err)
}
// Create a new tracer provider with a batch span processor and the given exporter.
tp := newTraceProvider(exp)
// Handle shutdown properly so nothing leaks.
defer func() { _ = tp.Shutdown(ctx) }()
otel.SetTracerProvider(tp)
// Finally, set the tracer that can be used for this package.
tracer = tp.Tracer(svcName)
r := mux.NewRouter()
r.Use(otelmux.Middleware(svcName)
r.HandleFunc("/books", booksListHandler)
http.Handle("/", r)
log.Fatal(http.ListenAndServe(":8001", nil))
}
func booksListHandler(w http.ResponseWriter, r *http.Request) {
_, span := tracer.Start(r.Context(), "Books List")
defer span.End()
io.WriteString(w, "Hello!\n")
}
```
Let’s walk through what’s happening in the `./books/main.go` file:
- The `newExporter` function is defining how to export trace data and to forward it to the OpenTelemetry Collector we have running on `otel-collector:4317`.
- The `newTraceProvider` function is initializing the tracer that we use to instrument the code.
- The main function is initializing everything and defines an HTTP route called `/books` to trigger a `booksListHandler`.
- The `booksListHandler` function will return a simple `"Hello!"` string. It also starts the OpenTelemetry tracer and defines a span called `"Books List"` .
With all this added, fetch Go dependencies by running this command in the terminal from the `books` directory:
```bash
go mod tidy
```
This will generate a `go.sum` file.
Lastly, add a `books` service to the `docker-compose.yaml` file in the `bookstore` directory. This is the root `docker-compose.yaml` file, not the one inside the `./tracetest/` directory.
```yaml
# ./docker-compose.yaml
services:
books:
image: your_username/books
build:
args:
SERVICE: books
ports:
- 8001:8001
depends_on:
otel-collector:
condition: service_started
```
Next, create a `Dockerfile` and paste this code into it:
```docker
# ./Dockerfile
FROM golang:1.19
ARG SERVICE
WORKDIR /app/${SERVICE}
COPY ./${SERVICE}/go.* /app/${SERVICE}
RUN go mod download
COPY ./${SERVICE}/* /app/${SERVICE}
RUN go build -o /app/server .
ENTRYPOINT [ "/app/server" ]
```
Finally, restart Docker Compose to try out the `books` service.
```bash
docker compose -f docker-compose.yaml -f tracetest/docker-compose.yaml up
```
### Running a trace-based test in the Tracetest web UI
With the Tracetest service running on port `11633`, open it up on `http://localhost:11633/` in your browser.
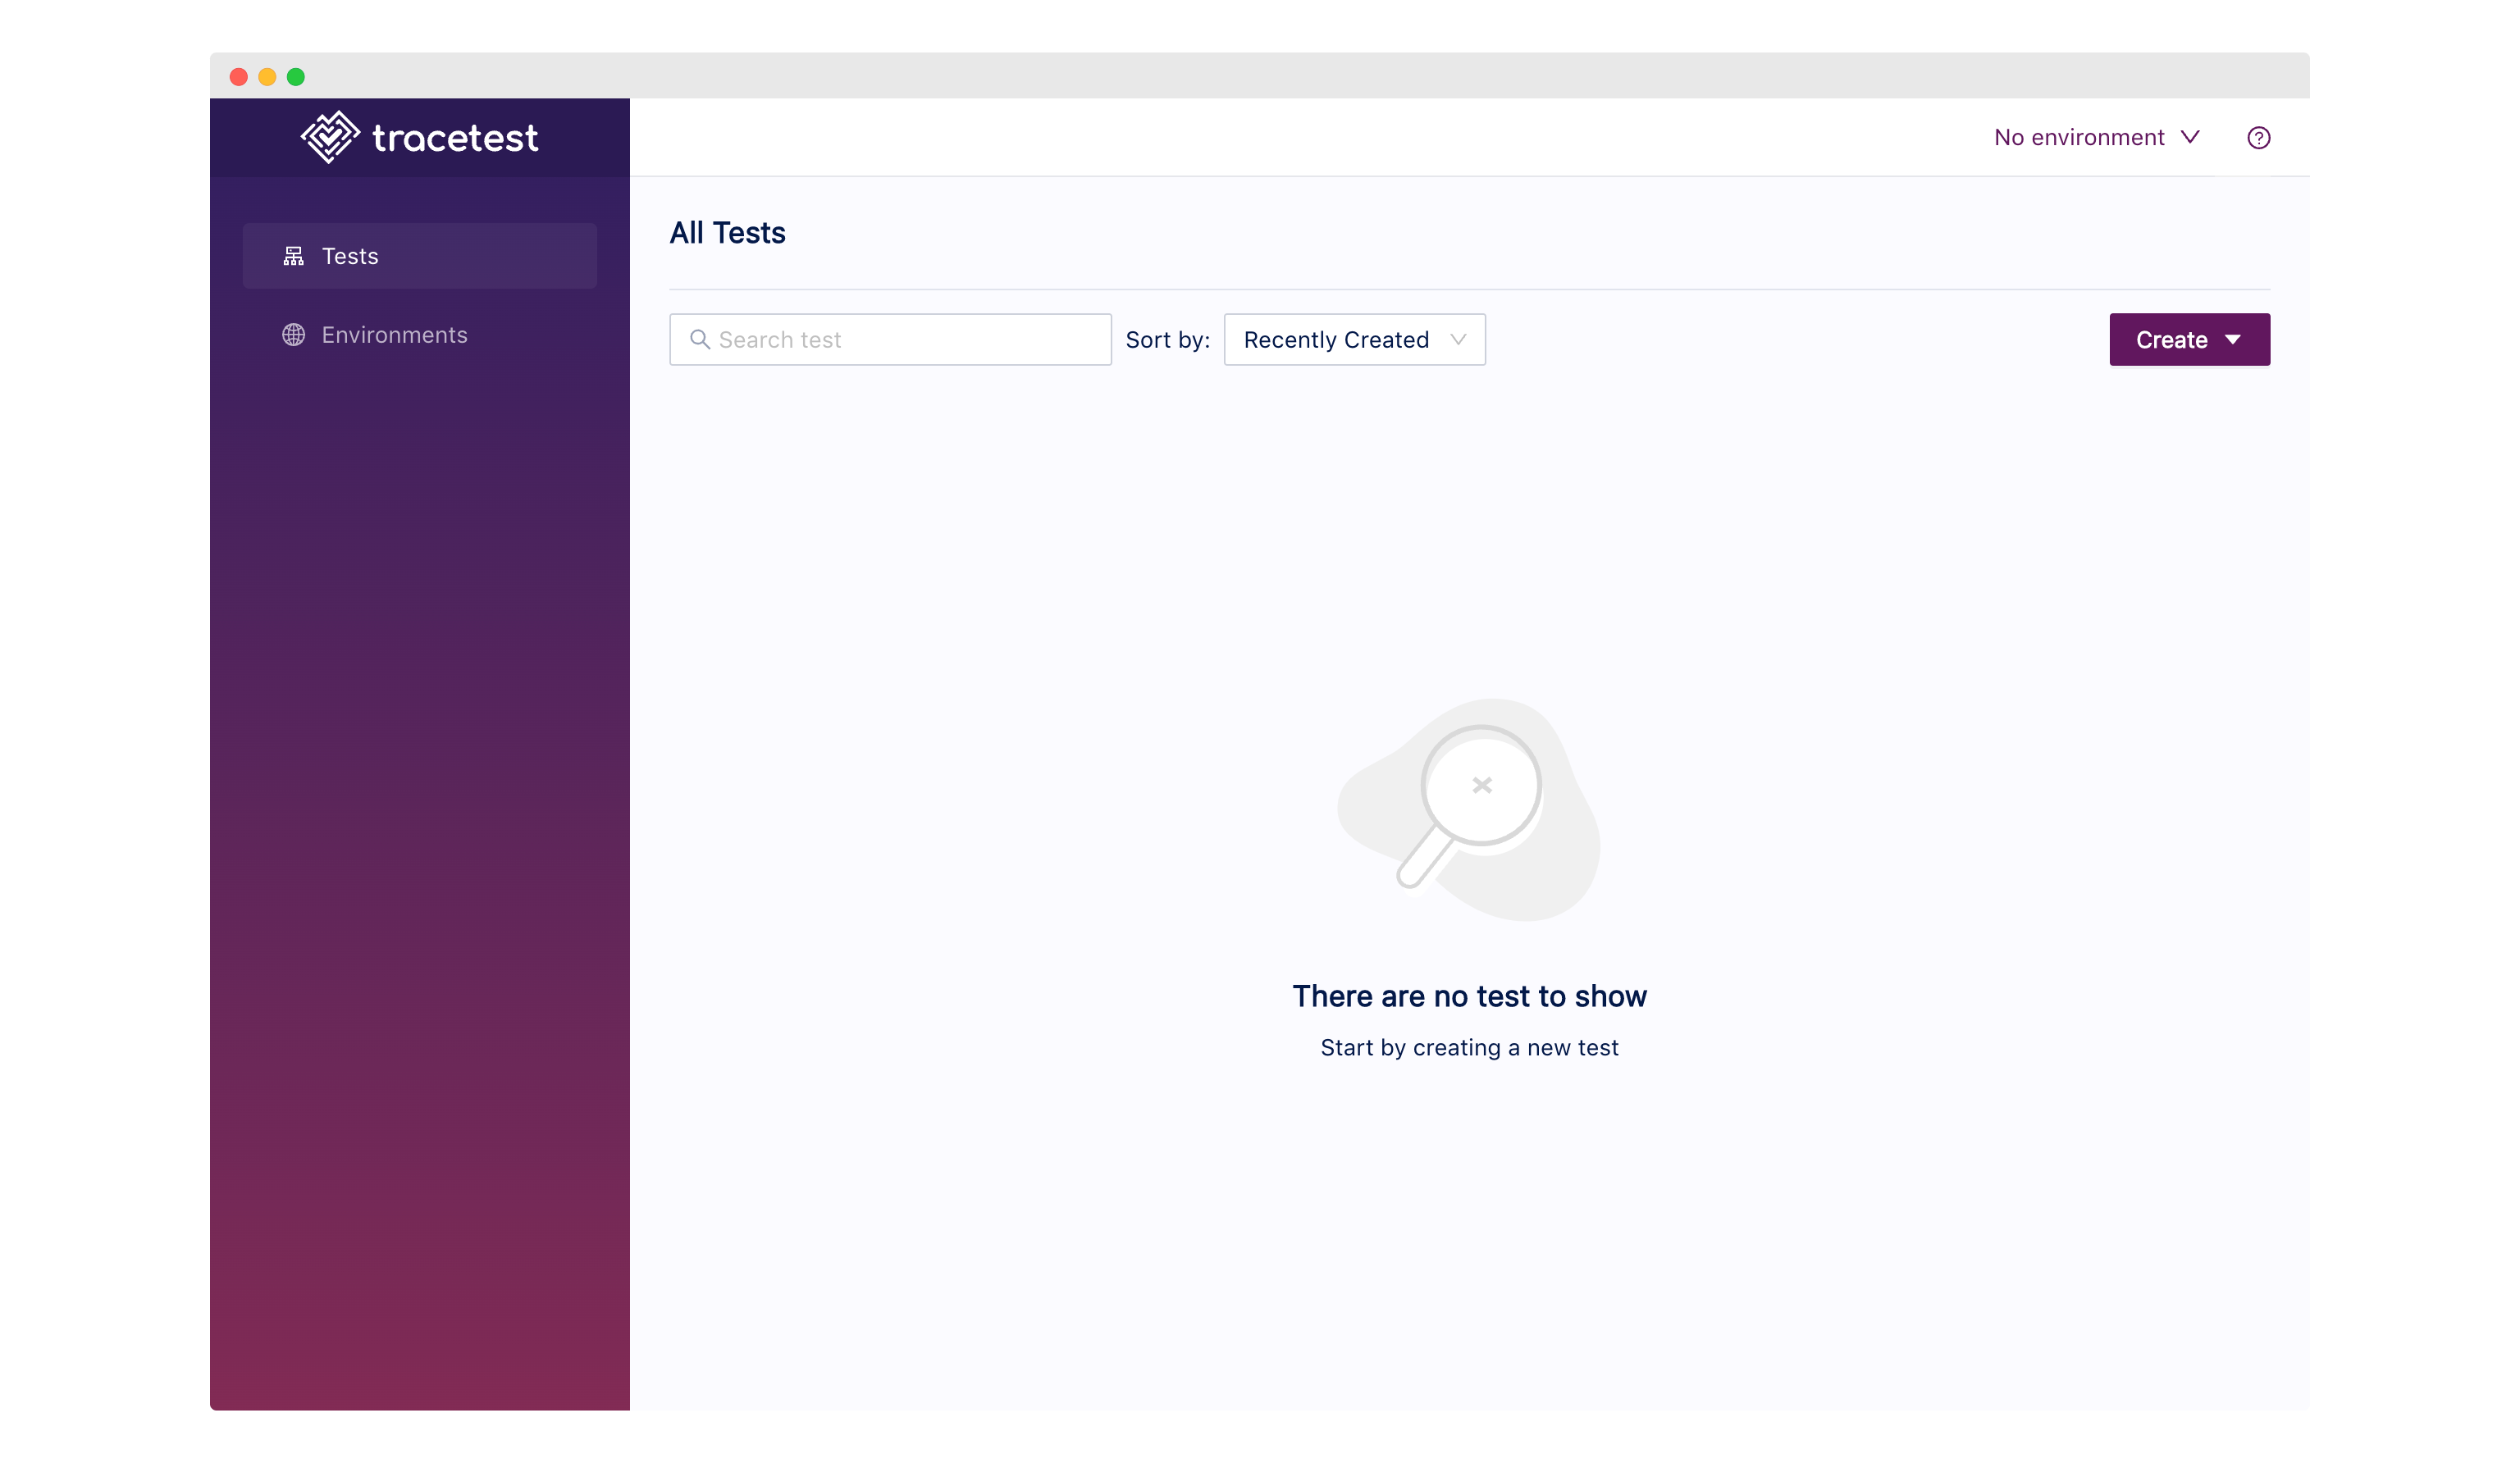
Create a new HTTP test. Give it a name and make sure to set the URL to `http://books:8001/books`.
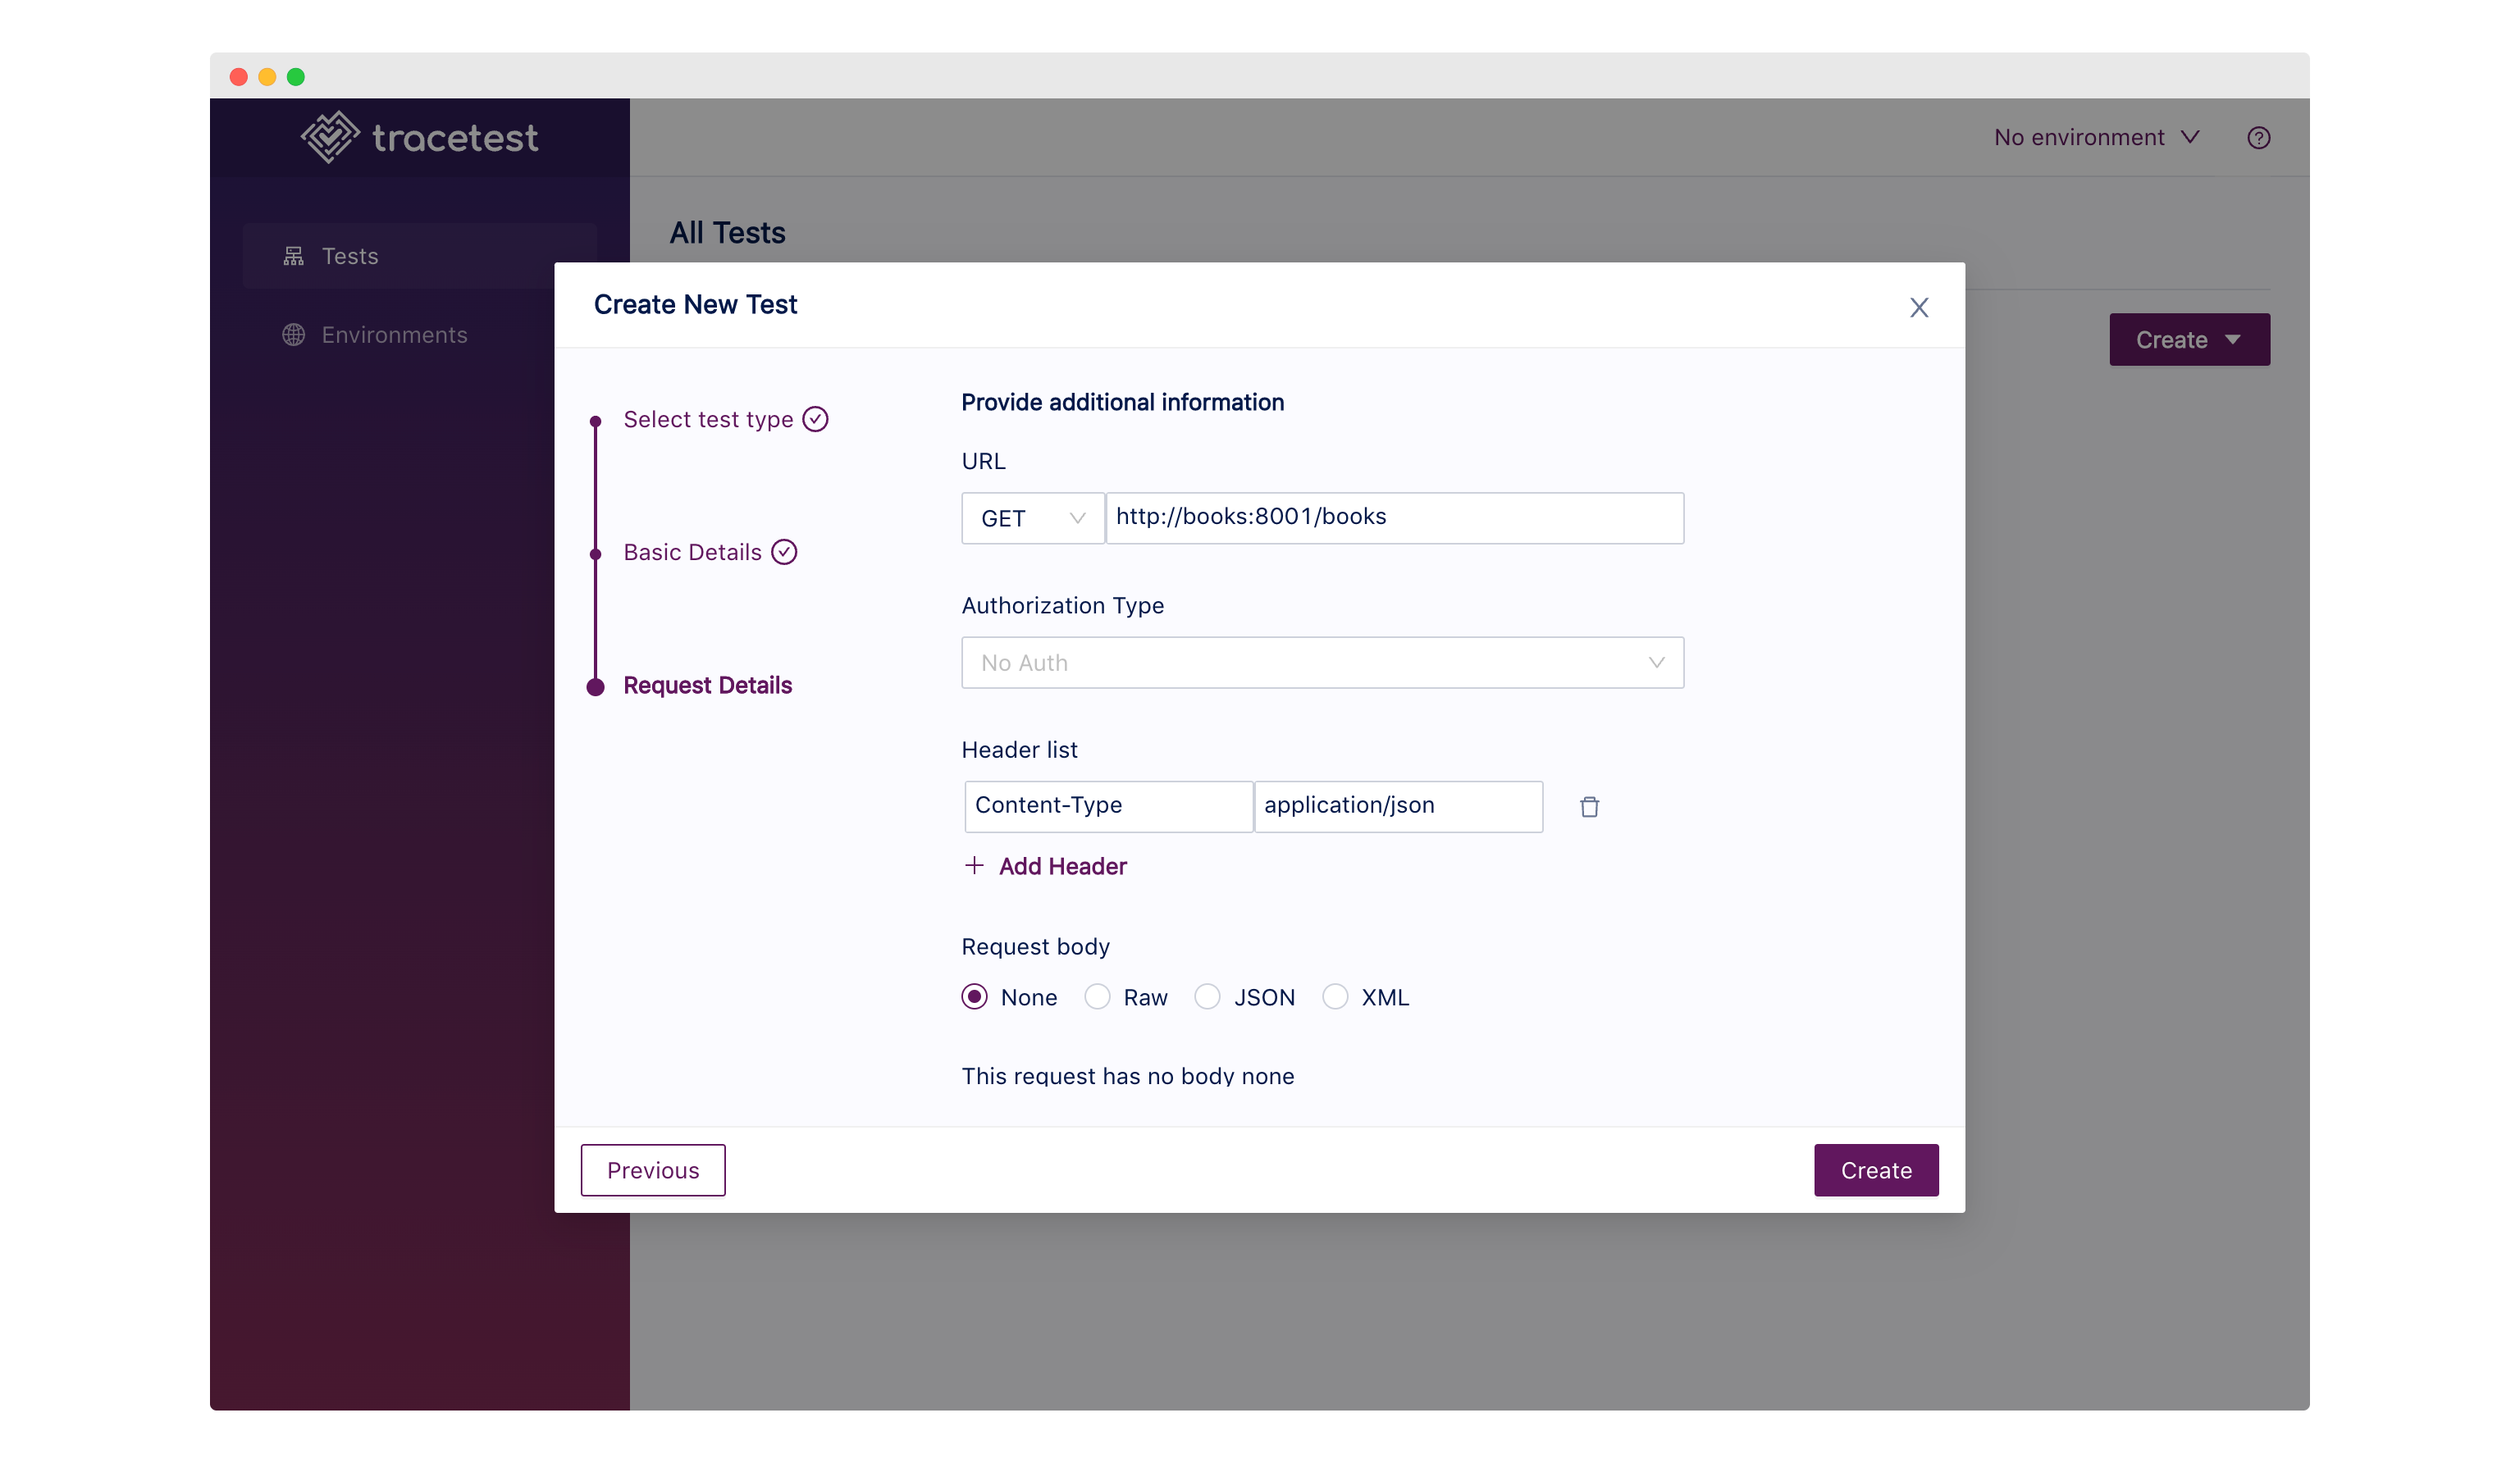
Click create. This will trigger the test to run right away.
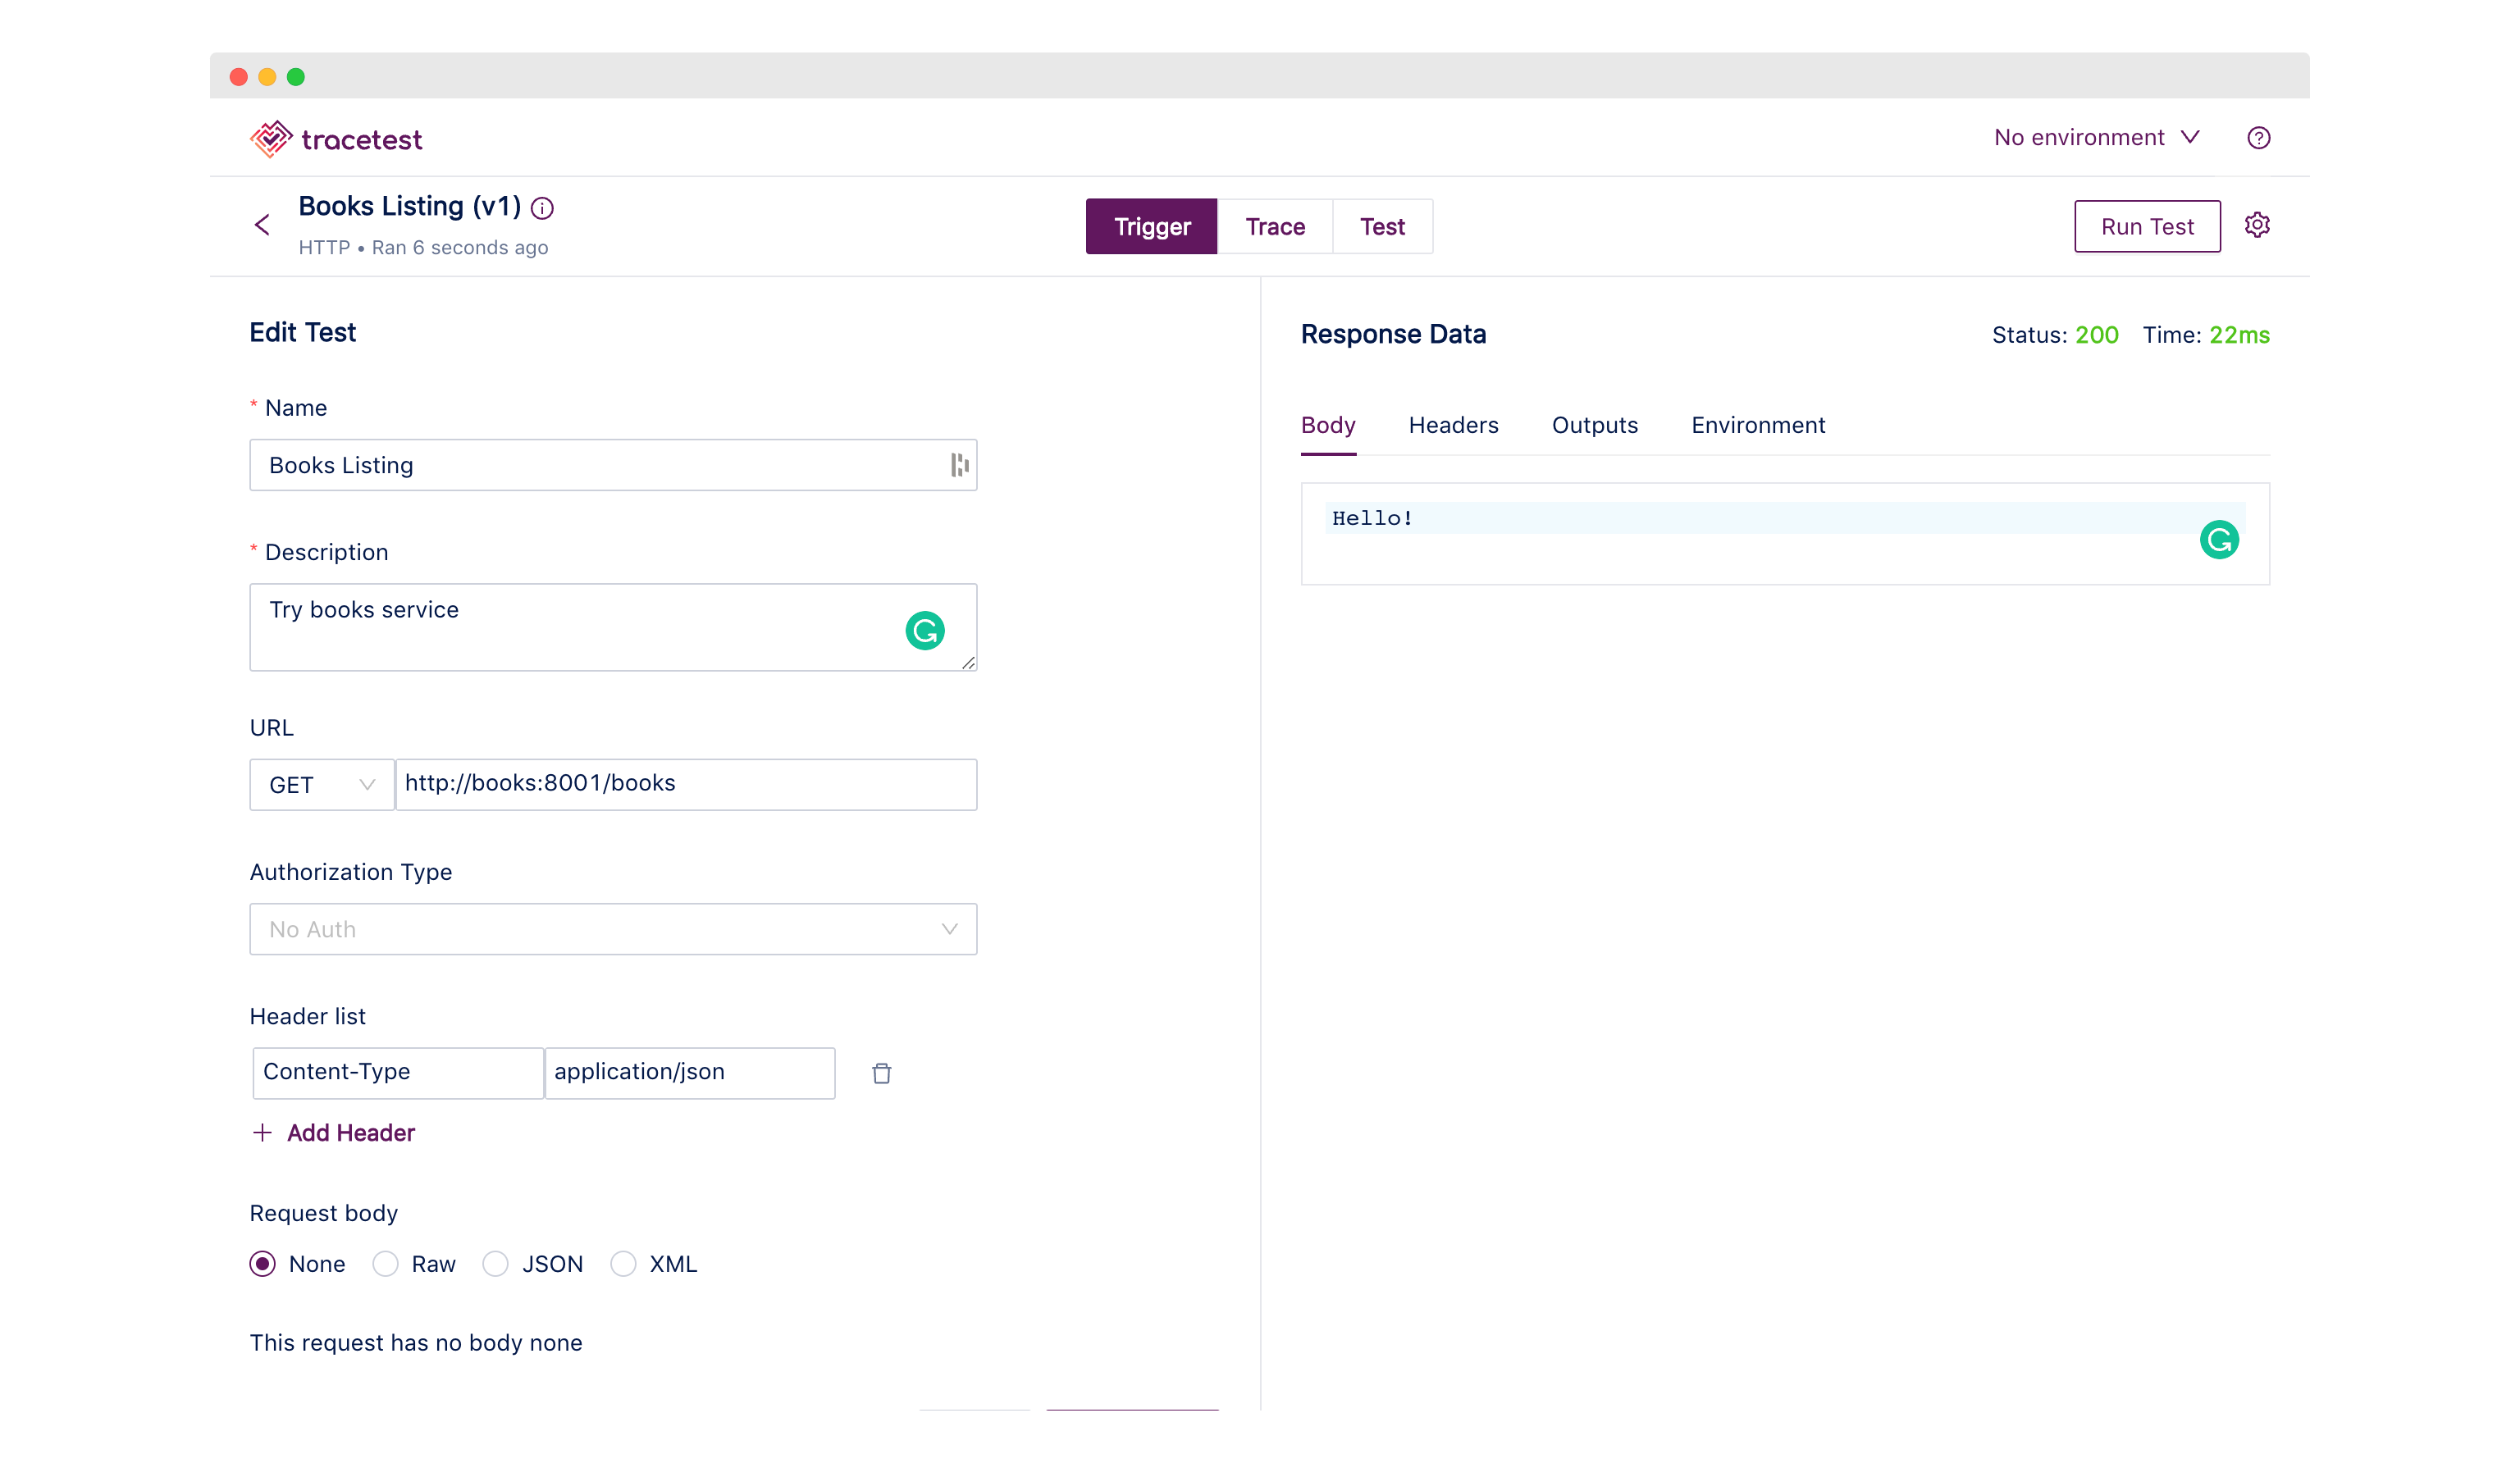
The test will return a `200` status code. Next, we need to add assertions against the trace data to make sure our OpenTelemetry tracing instrumentation works in our Go code.
Open the `Trace` tab and let’s start by adding a status code assertion. Click on the `Tracetest trigger` span. In the left navigation, select `tracetest.response.status` and click `Create test spec`. If you’re writing the assertion by hand, make sure to preface the attribute with a `attr:` to enable autocompletion when selecting what attribute to assert on.
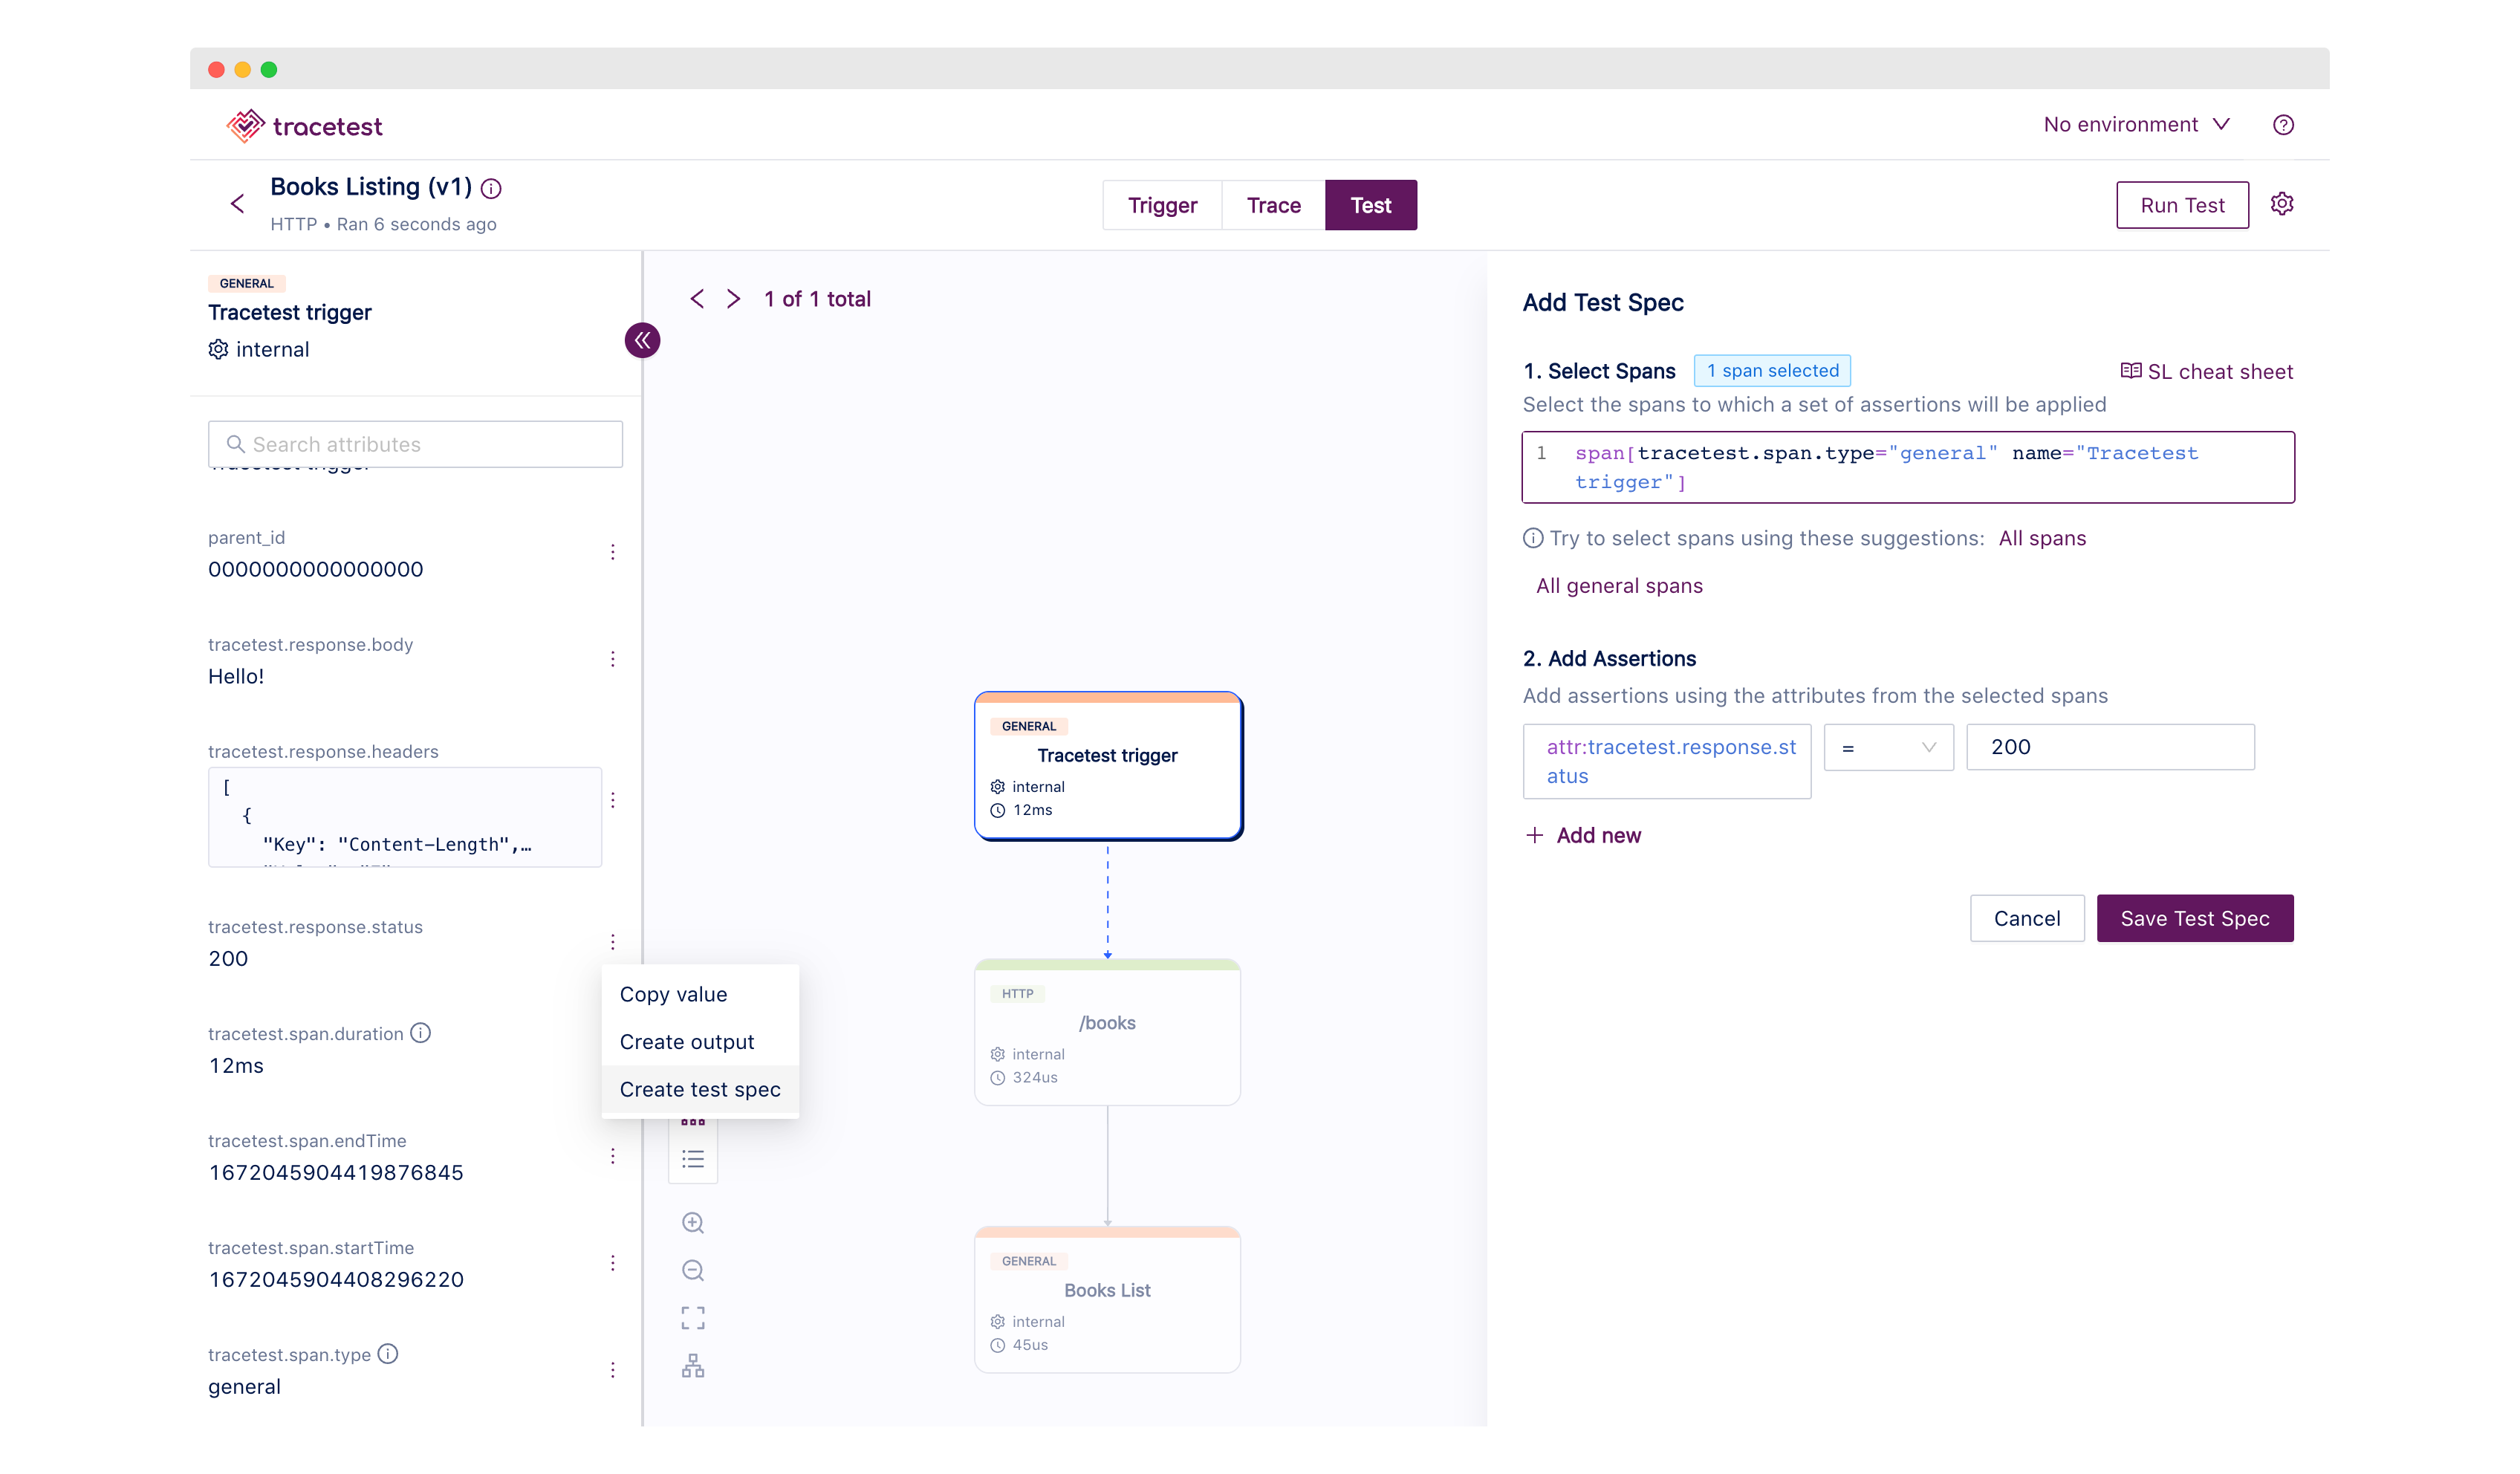
Save the test spec and add another assertion to the `Books list` span. This time add the attribute called `attr:tracetest.selected_spans.count = 1`.
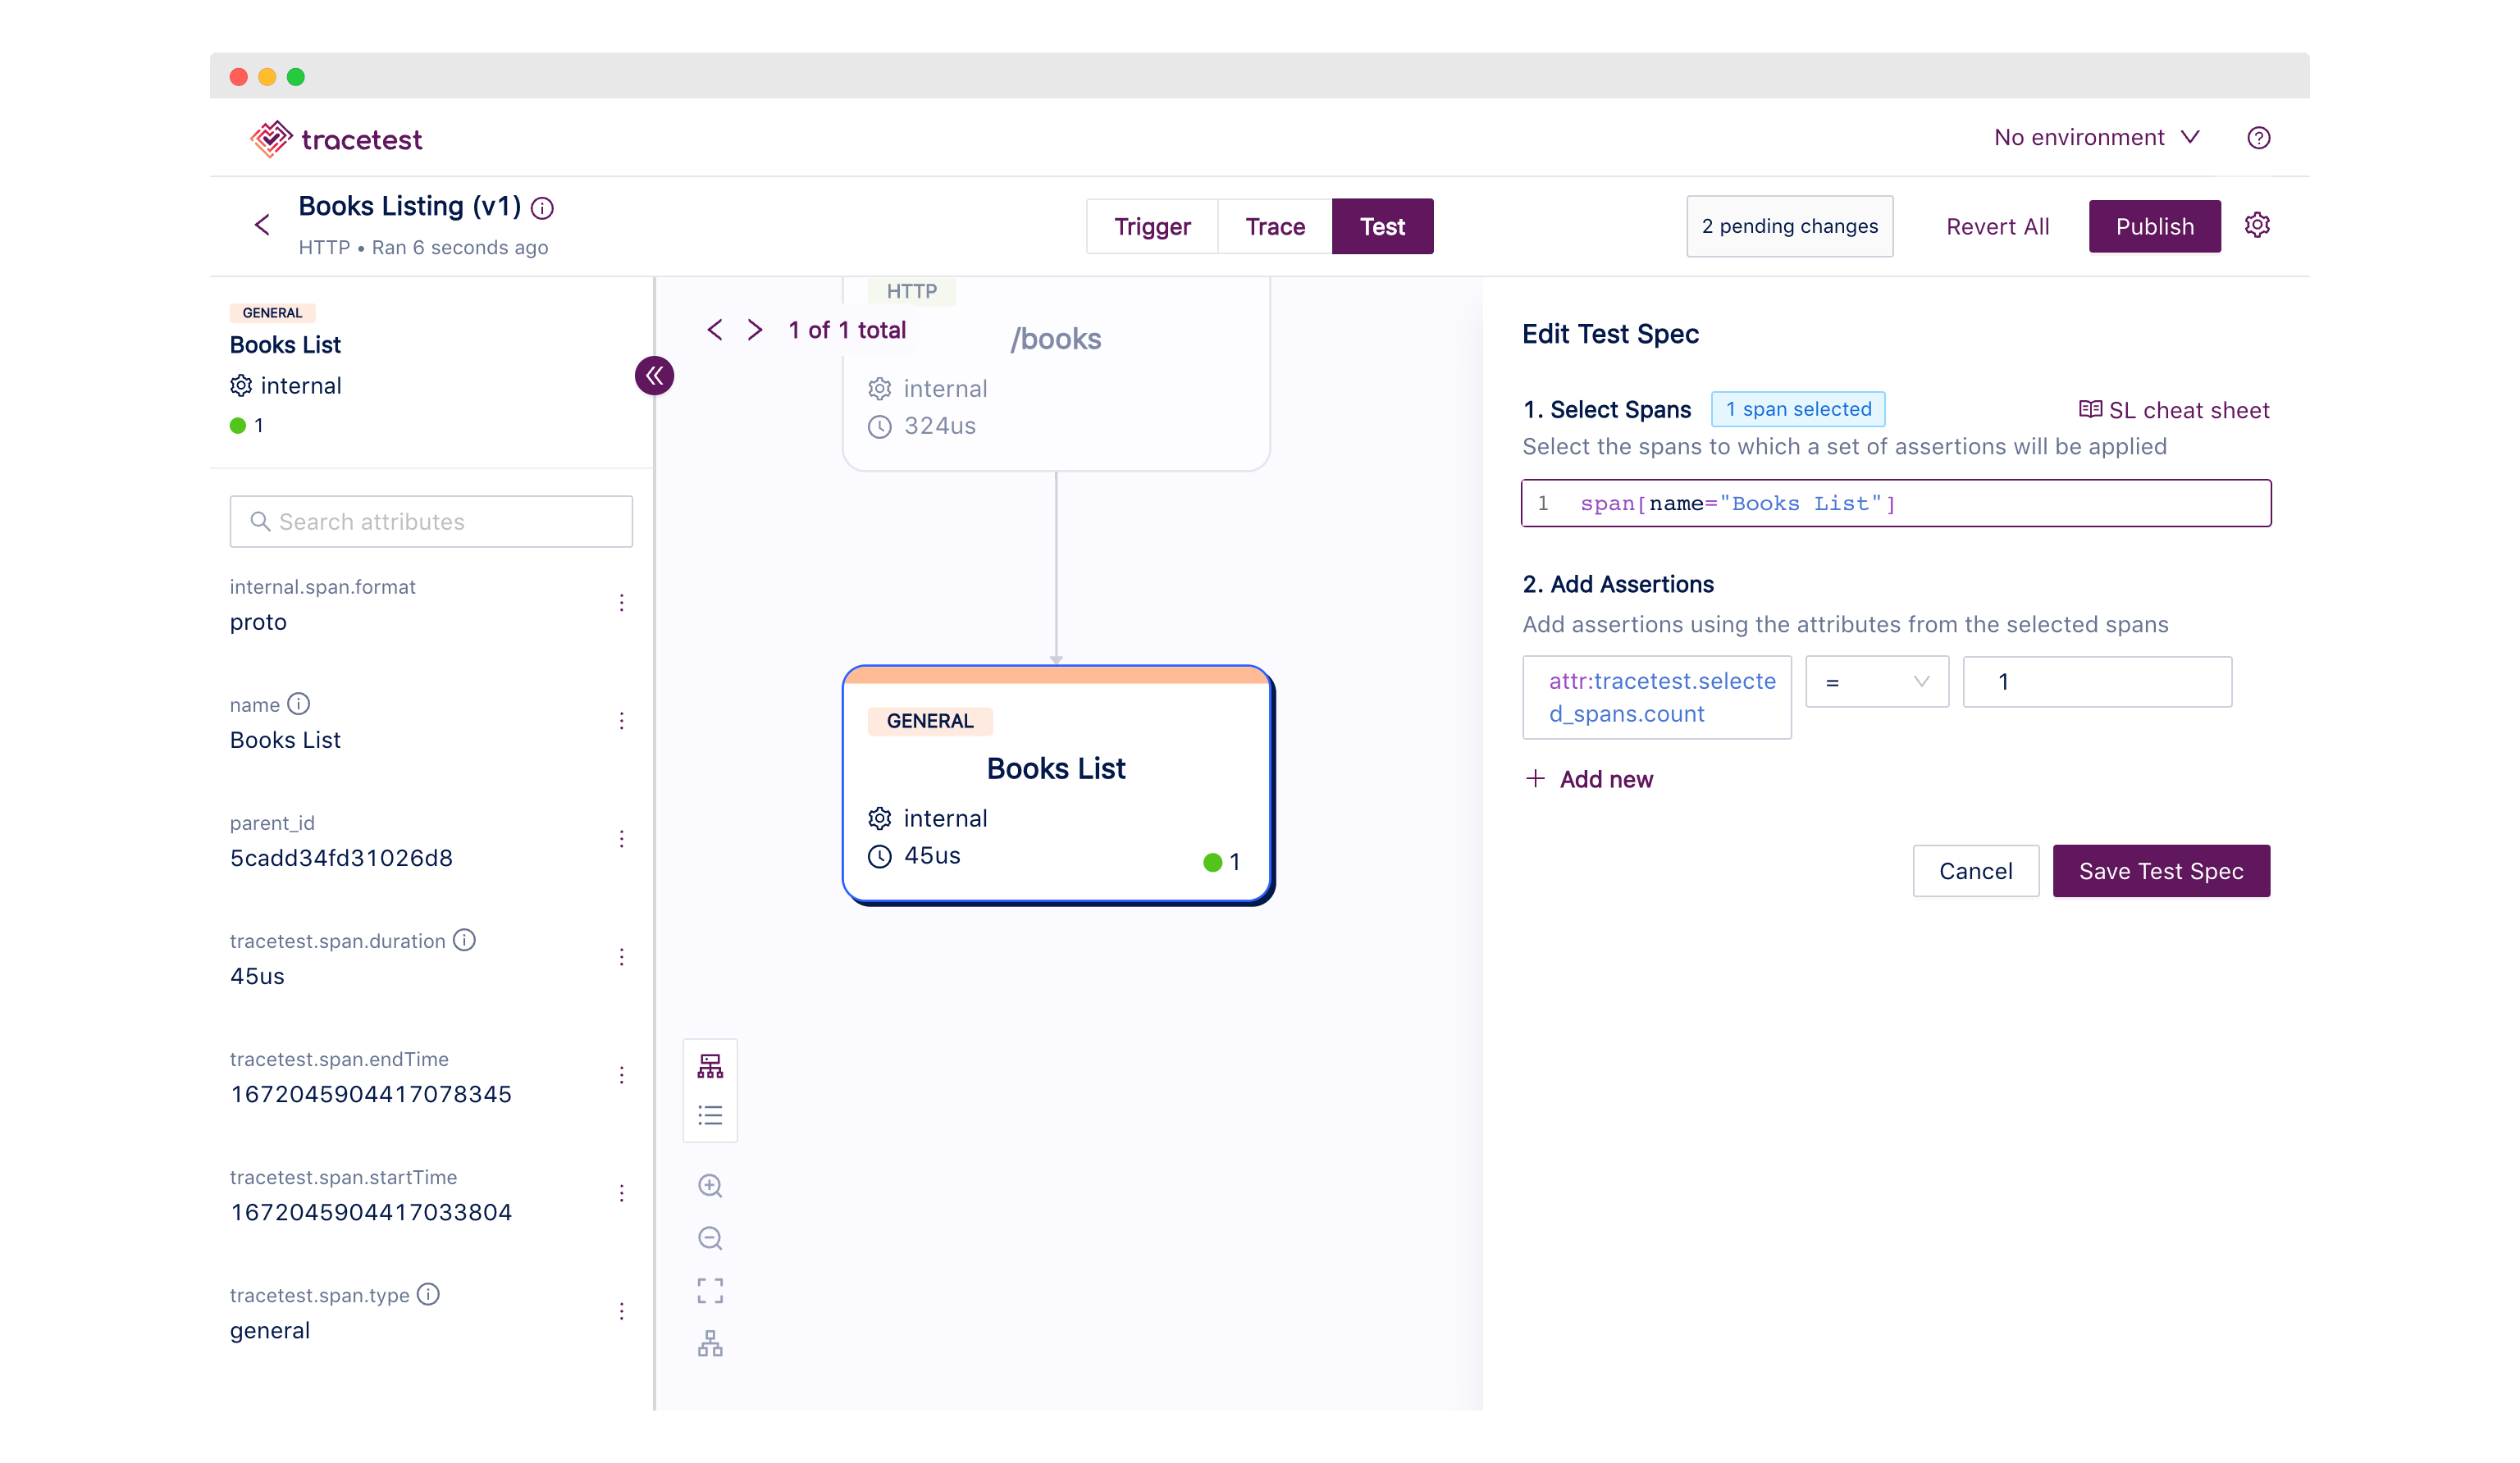
Save and publish the test specs. Re-run the test.
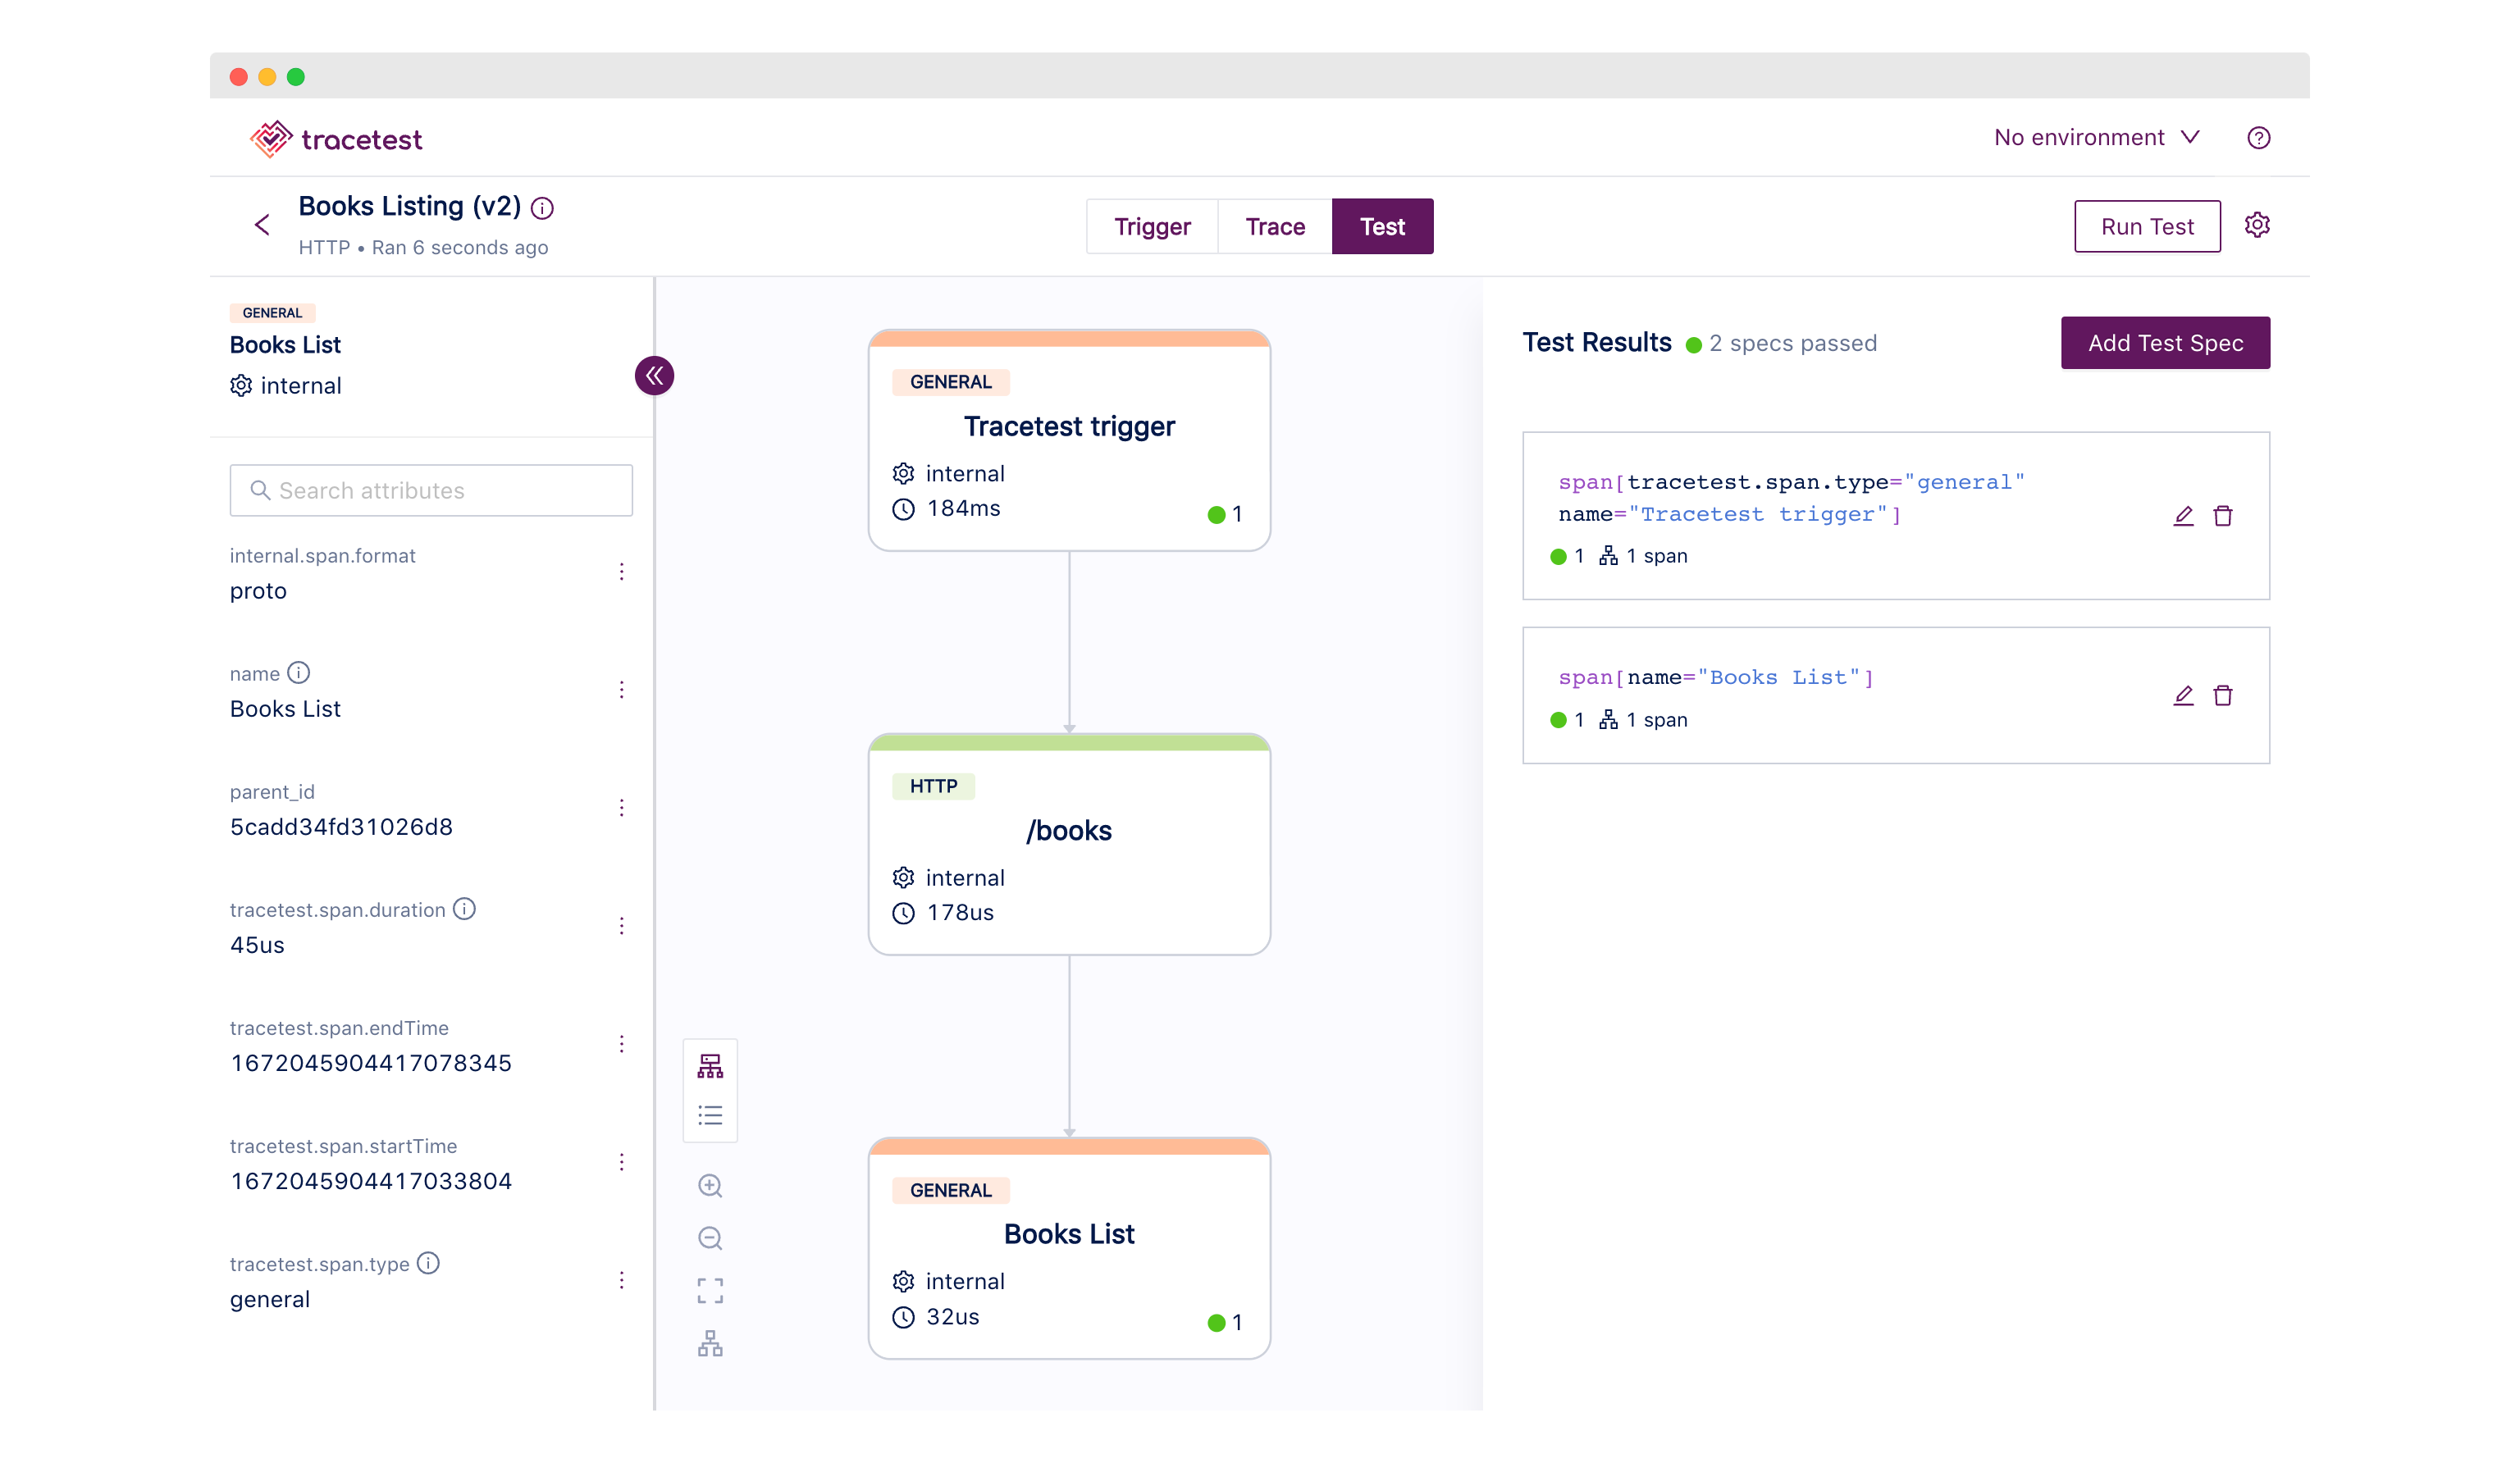
You now have passing tests that ensure the service responds with a `200` status code and verifies the OpenTelemetry manual code instrumentation works!
### Running a trace-based test with the Tracetest CLI
Let’s re-trace, no pun intended, our steps with the Tracetest CLI.
Create an `e2e` directory in the `bookstore` directory. Create a file called `books-list.yaml`. This will contain a test definition we will trigger with the CLI.
Paste this code into the `books-list.yaml`:
```yaml
# ./e2e/books-list.yaml
type: Test
spec:
id: k6hEWU54R
name: Books Listing
description: Try books service
trigger:
type: http
httpRequest:
url: http://books:8001/books
method: GET
headers:
- key: Content-Type
value: application/json
specs:
- selector: span[name="Tracetest trigger"]
assertions:
- attr:tracetest.response.status = 200
- selector: span[name="Books List"]
assertions:
- attr:tracetest.selected_spans.count = 1
```
Take a moment to read the code. You see the assertions match what we just added in the Tracetest Web UI.
To trigger the test from the command line, first configure the Tracetest CLI. Make sure to point the CLI to the URL where the Tracetest service is running. In this sample it’s `http://localhost:11633/`.
```bash
tracetest configure
[Output]
Enter your Tracetest server URL [http://localhost:11633]: http://localhost:11633
[Output]
Enable analytics? [Y/n]: Yes
```
Now, we can run the test. From the `bookstore` dir, run:
```bash
tracetest test run -d ./e2e/books-list.yaml -w
[Output]
✔ Books Listing (http://localhost:11633/test/k6hEWU54R/run/2/test)
```
Clicking the link will open the test run in the Web UI.
With the initial setup done, we’re ready to move on and tackle getting hands-on with observability-driven development!
## Hands-on observability-driven development
To follow along, you can [check out the sample code we’ve prepared for part 2.1](https://github.com/kubeshop/tracetest/tree/main/examples/observability-driven-development-go-tracetest/bookstore/part2.1). Follow the instructions below:
```bash
git clone git@github.com:kubeshop/tracetest.git
cd examples/observability-driven-development-go-tracetest/bookstore/part2.1
docker compose -f docker-compose.yaml -f tracetest/docker-compose.yaml up
###
tracetest test run -d ./e2e/books-list.yaml -w
```
To get started let’s first add more detailed assertions to the `books-list.yaml`, and make our test fail.
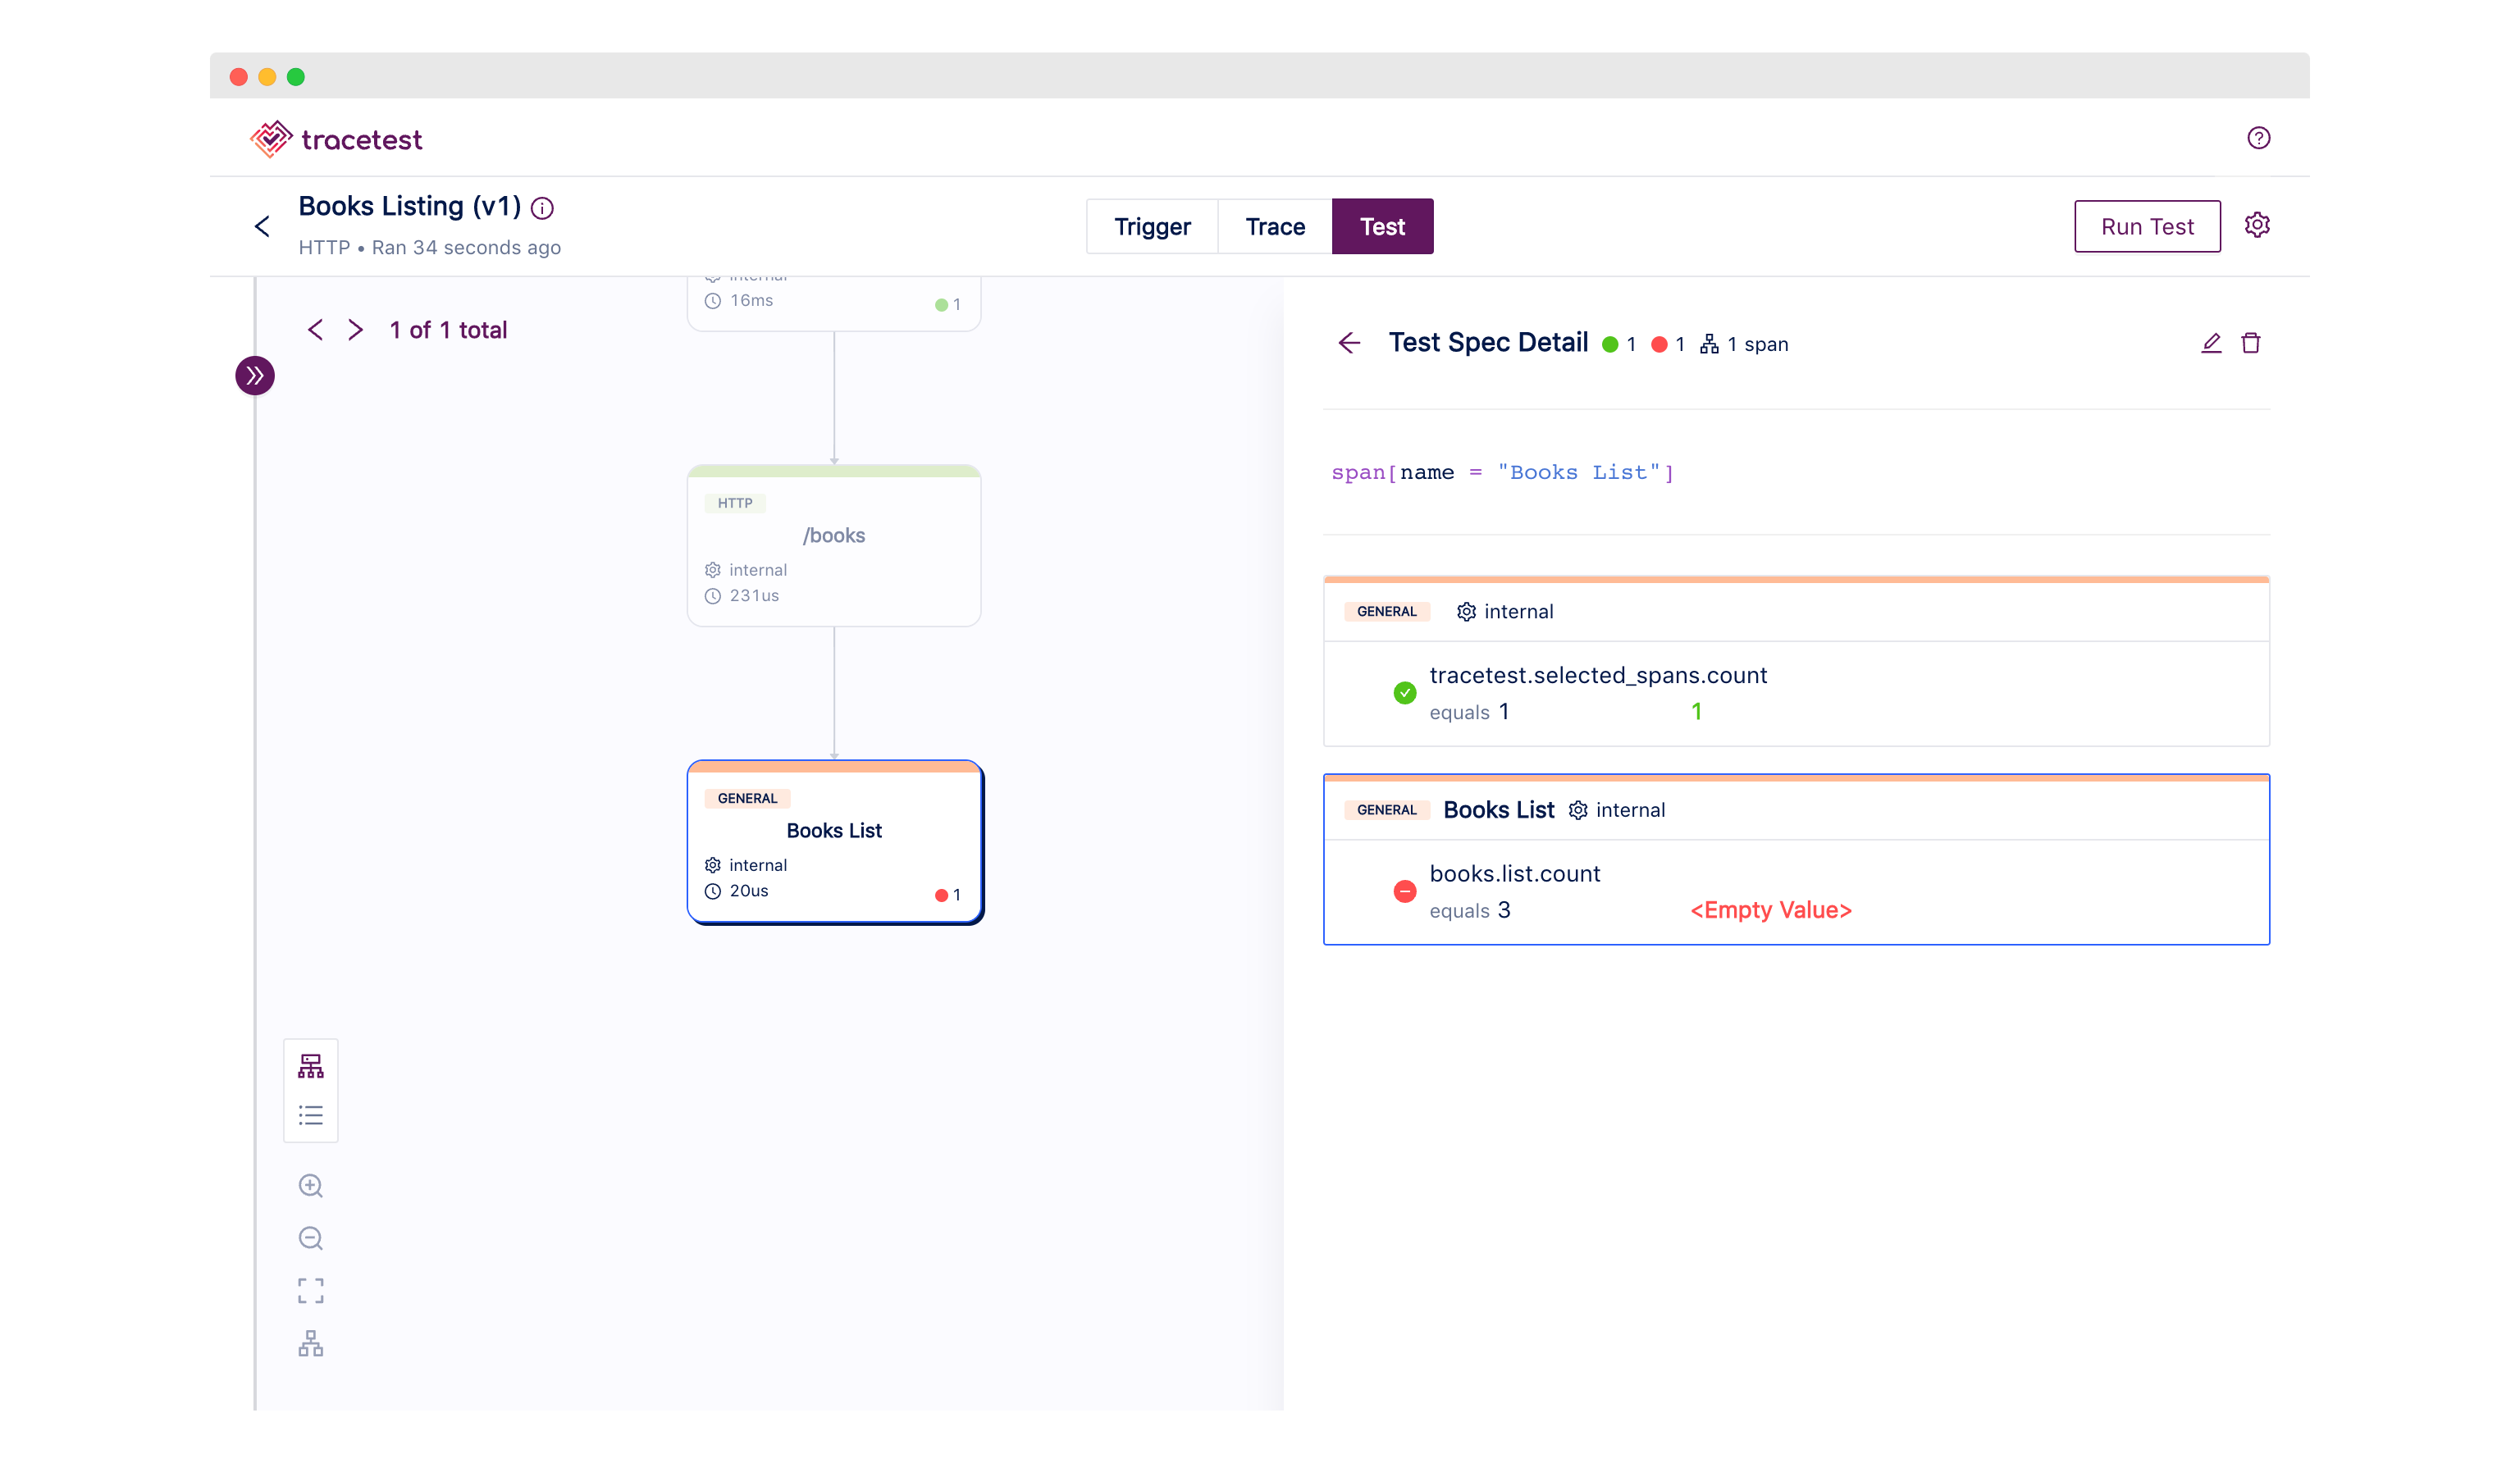
Open the `books-list.yaml` file and add a custom attribute called `attr:books.list.count`. This means we are expecting the `Books List API` test to return 3 books.
```yaml
# ./e2e/books-list.yaml
# ...
specs:
- selector: span[name="Tracetest trigger"]
assertions:
- attr:tracetest.response.status = 200
- selector: span[name="Books List"]
assertions:
- attr:tracetest.selected_spans.count = 1
- attr:books.list.count = 3
```
Jump back into the terminal, and run the test again.
```bash
tracetest test run -d ./e2e/books-list.yaml -w
[Output]
✘ Books Listing (http://localhost:11633/test/k6hEWU54R/run/1/test)
✔ span[name="Tracetest trigger"]
✔ #ebae1f382ecb81f6
✔ attr:tracetest.response.status = 200 (200)
✘ span[name="Books List"]
✘ #f6c5fa3aa5527a7a
✔ attr:tracetest.selected_spans.count = 1 (1)
✘ attr:books.list.count = 3 (http://localhost:11633/test/k6hEWU54R/run/1/test?selectedAssertion=1&selectedSpan=f6c5fa3aa5527a7a)
```
The `"Books List"` span now fails the test.
In true ODD fashion, let’s add the code to satisfy the test spec.
We need to add a `getBooks` function to retrieve the books and make sure to add OpenTelemetry instrumentation to validate that it is indeed returning the books in the form of an array.
Open up the `./books/main.go` file. We will edit the `booksListHandler` function, and add a `getBooks` function that simulates getting books from a database.
```go
// ./books/main.go
// ...
func booksListHandler(w http.ResponseWriter, r *http.Request) {
ctx, span := tracer.Start(r.Context(), "Books List")
defer span.End()
books, err := getBooks(ctx)
if err != nil {
w.WriteHeader(http.StatusInternalServerError)
io.WriteString(w, "cannot read books DB")
return
}
// This is how we instrument the code with OpenTelemetry
// This is the attribute we run the assertion against
span.SetAttributes(
attribute.Int("books.list.count", len(books)),
)
jsonBooks, err := json.Marshal(books)
if err != nil {
w.WriteHeader(http.StatusInternalServerError)
io.WriteString(w, "cannot json encode books DB")
return
}
w.Write(jsonBooks)
}
type book struct {
ID string `json:"id"`
Name string `json:"name"`
Price int `json:"price"`
}
// Mocking a database request
func getBooks(ctx context.Context) ([]book, error) {
return []book{
{"1", "Harry Potter", 0},
{"2", "Foundation", 0},
{"3", "Moby Dick", 0},
}, nil
}
```
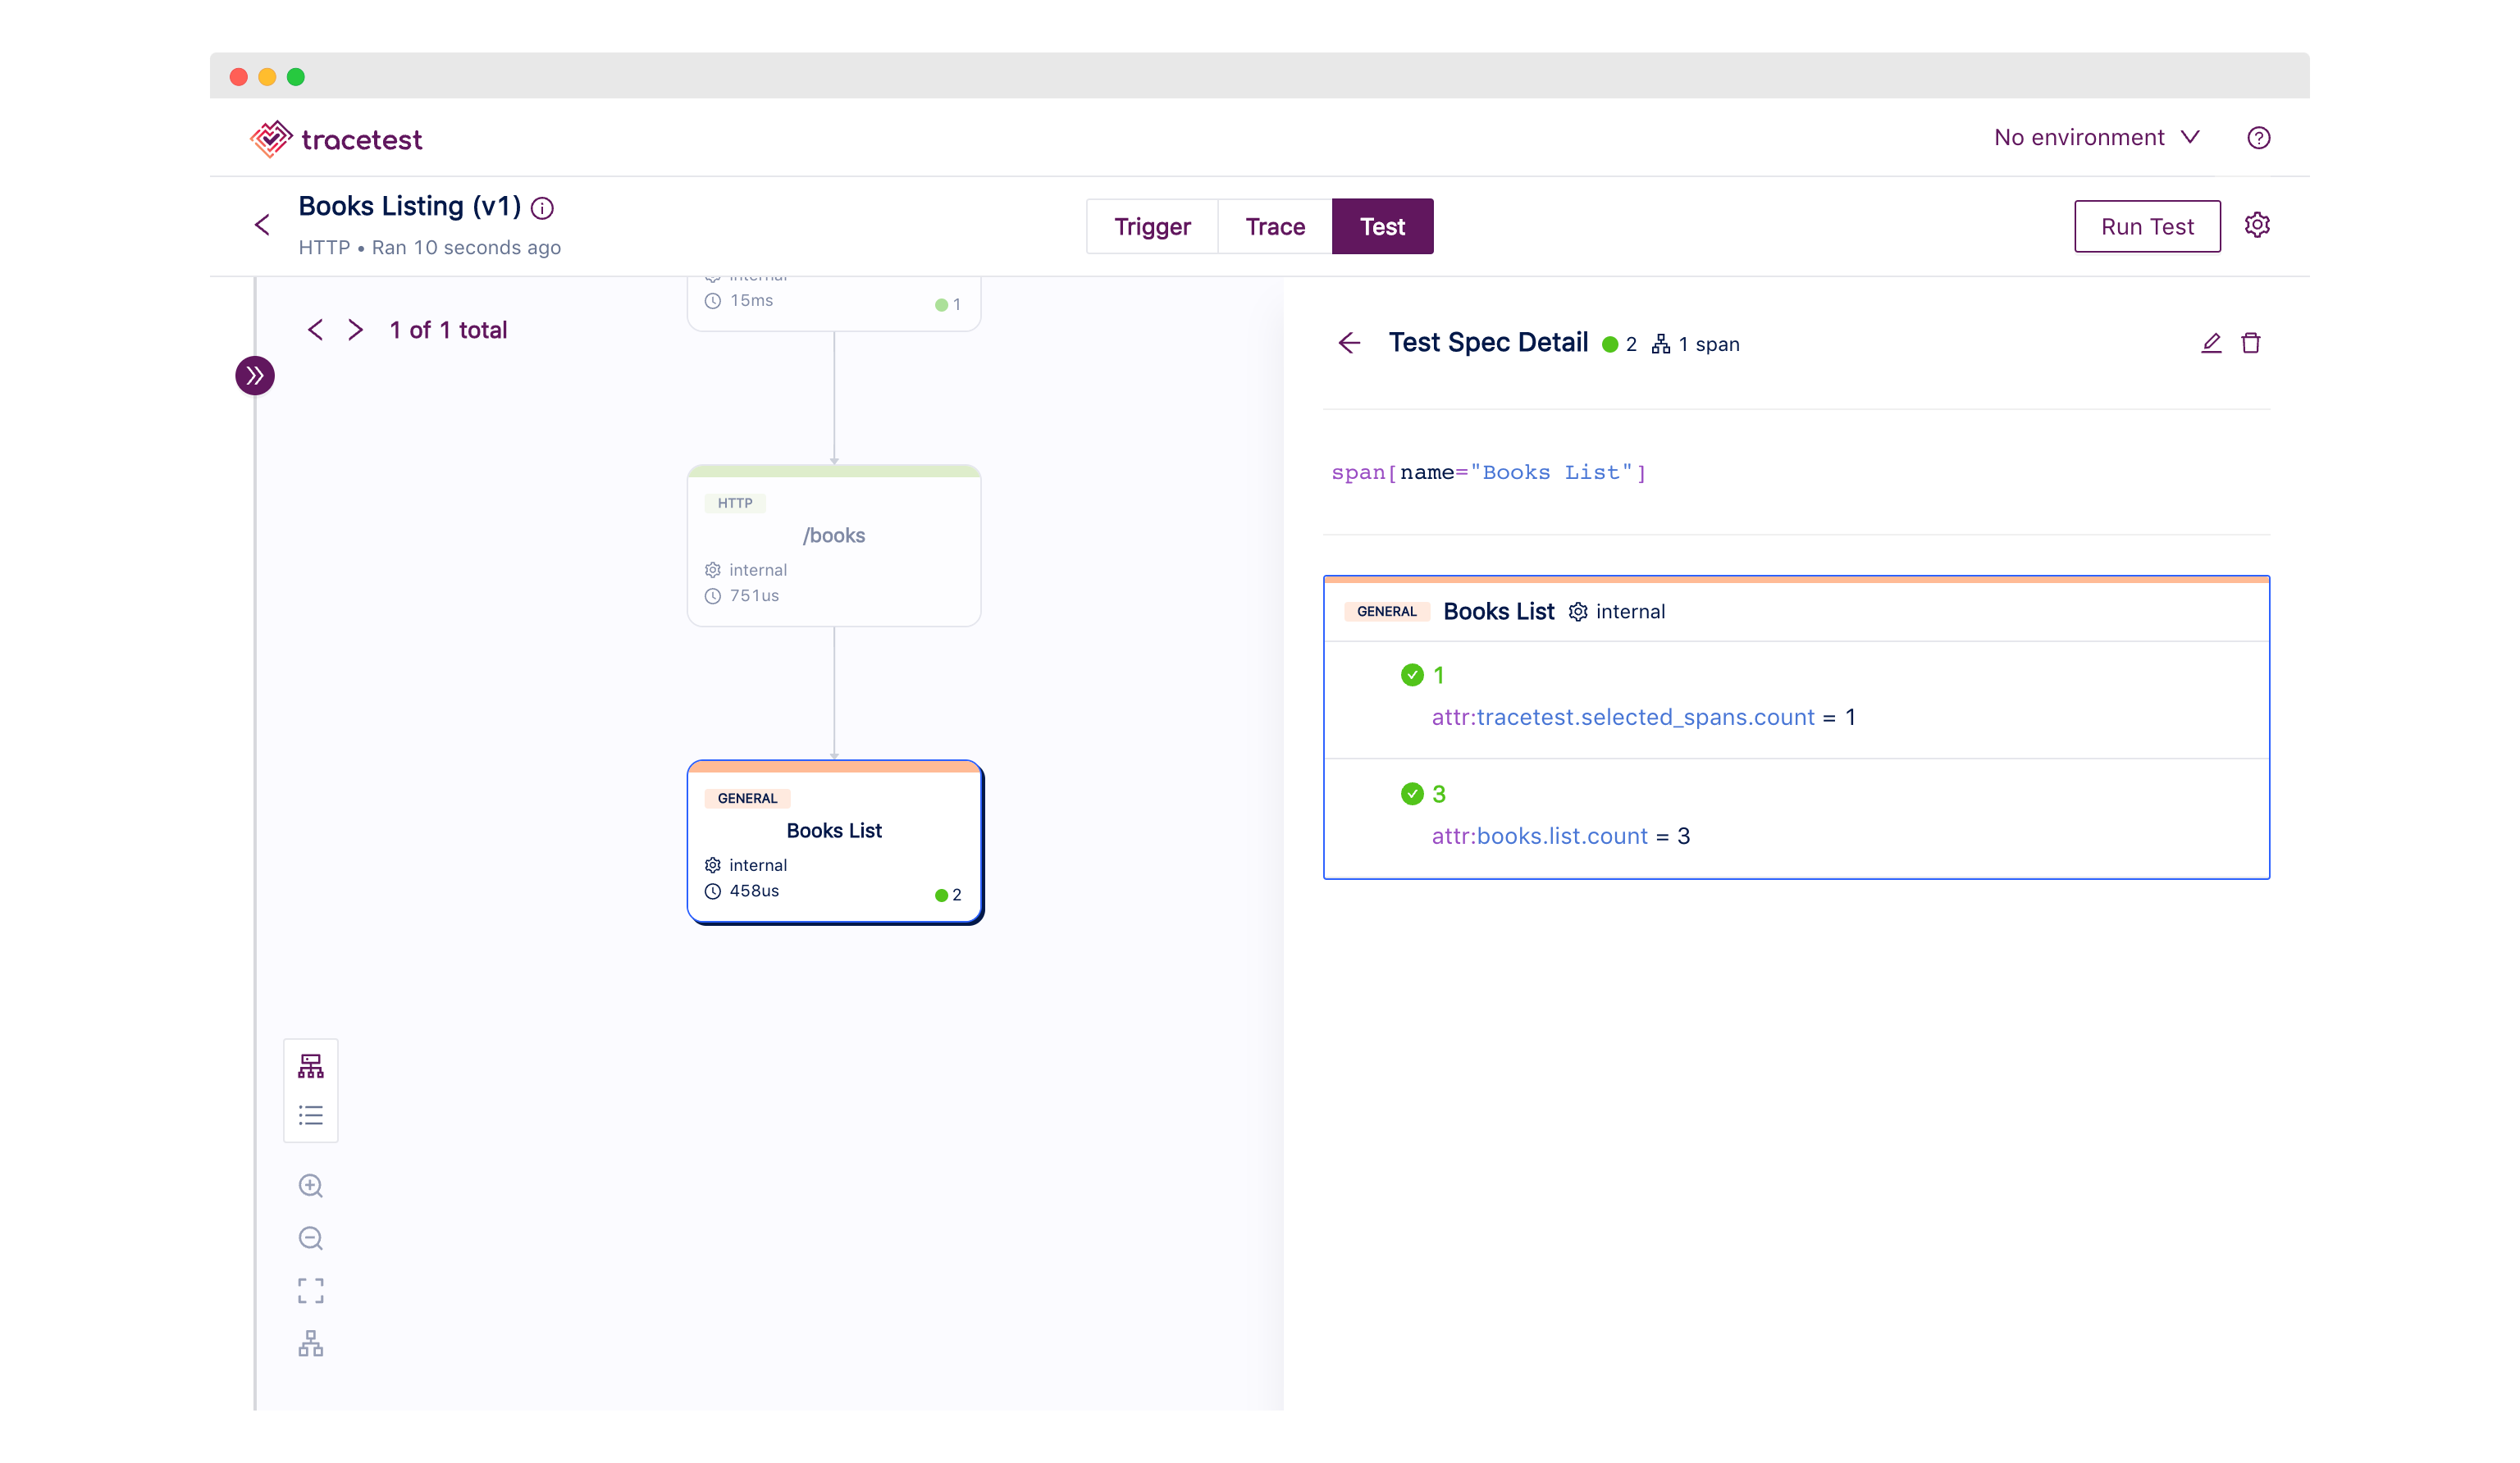
Save the changes, and restart Docker Compose. Now, run the same test.
```bash
tracetest test run -d ./e2e/books-list.yaml -w
[Output]
✔ Books Listing (http://localhost:11633/test/k6hEWU54R/run/1/test)
```
The test passes. Clicking the link in the test will open up the Tracetest Web UI.
We’re starting to look like ODD pros right now! But, we’re not done yet. We want to add an availability check to our bookstore. What if a book is not in stock? We need to be able to check that.
## Setting up observability-driven tests for multiple microservices
To follow along, you can [check out the sample code we’ve prepared for part 2.2](https://github.com/kubeshop/tracetest/tree/main/examples/observability-driven-development-go-tracetest/bookstore/part2.2). Follow the instructions below:
```bash
git clone git@github.com:kubeshop/tracetest.git
cd examples/observability-driven-development-go-tracetest/bookstore/part2.2
docker compose -f docker-compose.yaml -f tracetest/docker-compose.yaml up
###
tracetest test run -d ./e2e/books-list.yaml -w
```
First add another book entry to the `getBooks` function. We’ll add an availability check that will confirm it is out of stock.
```go
// ./books/main.go
// ...
func getBooks(ctx context.Context) ([]book, error) {
return []book{
{"1", "Harry Potter", 0},
{"2", "Foundation", 0},
{"3", "Moby Dick", 0},
{"4", "The art of war", 0}, // Add this book
}, nil
}
```
Once again, open up the `books-list.yaml`. Let’s add assertions for the availability.
```yaml
# books-list.yaml
# ...
specs:
- selector: span[name="Tracetest trigger"]
assertions:
- attr:tracetest.response.status = 200
- selector: span[name="Books List"]
assertions:
- attr:tracetest.selected_spans.count = 1
- attr:books.list.count = 3
# This selector will look for a descendant of the
# "Books List" span called "Availability Check"
- selector: span[name = "Books List"] span[name = "Availability Check"]
assertions:
- attr:tracetest.selected_spans.count = 4
```
We want to make sure that an availability check is performed for every single book from the `getBooks` function.
Re-running the test will cause it to fail because of the availability check, as expected.
```bash
tracetest test run -d ./e2e/books-list.yaml -w
[Output]
✘ Books Listing (http://localhost:11633/test/k6hEWU54R/run/2/test)
✔ span[name="Tracetest trigger"]
✔ #b81c6b68711908e1
✔ attr:tracetest.response.status = 200 (200)
✔ span[name="Books List"]
✔ #392fcfe7690310d8
✔ attr:tracetest.selected_spans.count = 1 (1)
✔ attr:books.list.count = 3 (3)
✘ span[name = "Books List"] span[name = "Availability Check"]
✘ #meta
✘ attr:tracetest.selected_spans.count = 4 (0) (http://localhost:11633/test/k6hEWU54R/run/2/test?selectedAssertion=2)
```
Next, let’s write the code to send an HTTP request to an `availability` microservice.
```go
// ./books/main.go
// ...
func httpError(span trace.Span, w http.ResponseWriter, msg string, err error) {
w.WriteHeader(http.StatusInternalServerError)
io.WriteString(w, msg)
span.RecordError(err)
span.SetStatus(codes.Error, msg)
}
func booksListHandler(w http.ResponseWriter, r *http.Request) {
ctx, span := tracer.Start(r.Context(), "Books List")
defer span.End()
books, err := getAvailableBooks(ctx)
if err != nil {
httpError(span, w, "cannot read books DB", err)
return
}
span.SetAttributes(
attribute.Int("books.list.count", len(books)),
)
jsonBooks, err := json.Marshal(books)
if err != nil {
httpError(span, w, "cannot json encode books", err)
return
}
w.Write(jsonBooks)
}
func getAvailableBooks(ctx context.Context) ([]book, error) {
books, err := getBooks(ctx)
if err != nil {
return nil, err
}
availableBook := make([]book, 0, len(books))
for _, book := range books {
available, err := isBookAvailable(ctx, book.ID)
if err != nil {
return nil, err
}
if !available {
continue
}
availableBook = append(availableBook, book)
}
return availableBook, nil
}
var httpClient = &http.Client{
Transport: otelhttp.NewTransport(http.DefaultTransport),
}
func isBookAvailable(ctx context.Context, bookID string) (bool, error) {
ctx, span := tracer.Start(ctx, "Availability Request", trace.WithAttributes(
attribute.String("bookID", bookID),
))
defer span.End()
url := "http://availability:8000/" + bookID
req, _ := http.NewRequestWithContext(ctx, http.MethodGet, url, nil)
resp, err := httpClient.Do(req)
if err != nil {
span.RecordError(err)
span.SetStatus(codes.Error, "cannot do request")
return false, err
}
if resp.StatusCode == http.StatusNotFound {
span.SetStatus(codes.Error, "not found")
return false, nil
}
stockBytes, err := io.ReadAll(resp.Body)
if err != nil {
span.RecordError(err)
span.SetStatus(codes.Error, "cannot read response body")
return false, err
}
stock, err := strconv.Atoi(string(stockBytes))
if err != nil {
span.RecordError(err)
span.SetStatus(codes.Error, "cannot parse stock value")
return false, err
}
return stock > 0, nil
}
```
Let me explain the code in detail.
- We’re adding a `isBookAvailable` function that checks if a book is available based on a provided `bookID`. It calls the `"http://availability:8000/"` endpoint and appends a `bookID` value.
- The `isBookAvailable` function is then used in the `getAvailableBooks` function that iterates through the books from the `getBooks` function.
- The `booksListHandler` function now calls the `getAvailableBooks` function instead of calling `getBooks`.
- The `httpError` is just a helper function.
*Note: Do not forget to re run `go mod tidy` if you change code that requires modules to be downloaded. Make sure to also restart Docker Compose after editing code!*
Let’s re-run the test.
```bash
tracetest test run -d ./e2e/books-list.yaml -w
[Output]
✘ Books Listing (http://localhost:11633/test/qasYcU54R/run/1/test)
✘ span[name="Tracetest trigger"]
✘ #2f9bc366597fb472
✘ attr:tracetest.response.status = 200 (500) (http://localhost:11633/test/qasYcU54R/run/1/test?selectedAssertion=0&selectedSpan=2f9bc366597fb472)
✘ span[name="Books List"]
✘ #1f0e9347869fd8c2
✔ attr:tracetest.selected_spans.count = 1 (1)
✘ attr:books.list.count = 3 (http://localhost:11633/test/qasYcU54R/run/1/test?selectedAssertion=1&selectedSpan=1f0e9347869fd8c2)
✘ span[name = "Books List"] span[name = "Availability Check"]
✘ #meta
✘ attr:tracetest.selected_spans.count = 4 (0) (http://localhost:11633/test/qasYcU54R/run/1/test?selectedAssertion=2)
```
We’re getting a different error now! The response status of the `"Tracetest trigger"` span equals `500`. Hmm, not great, right?
Wrong! We’re on the correct path! The test is failing because we added code that sends an HTTP request to an availability service that does not exist. Let’s fix that.
Next up, creating an availability service.
## Trace-based testing across multiple services
To follow along, you can [check out the sample code we’ve prepared for part 3.1](https://github.com/kubeshop/tracetest/tree/main/examples/observability-driven-development-go-tracetest/bookstore/part3.1). Follow the instructions below:
```bash
git clone git@github.com:kubeshop/tracetest.git
cd examples/observability-driven-development-go-tracetest/bookstore/part3.1
docker compose -f docker-compose.yaml -f tracetest/docker-compose.yaml up
###
tracetest test run -d ./e2e/books-list.yaml -w
```
When developing distributed apps and microservices it’s best practice to extract the OpenTelemetry instrumentation to a dedicated module.
This will let you import the OpenTelemetry configuration into all of your microservices without duplicating code.
Let’s start with pulling out the OpenTelemetry SDKs from the `./books/main.go` and putting them in a dedicated file called `instrumentation.go`.
Create a `lib` directory in the root of the `bookstore` directory.
Initialize a module with:
```bash
cd ./lib
go mod init github.com/your-username/bookstore/lib
```
*Note: File paths can be tricky in Go. Makes sure the name of the file path matches the location on GitHub when you import the module in your microservices.*
Once you create the Go module, create another directory called `instrumentation`. Add a single file called `instrumentation.go`.
Remove the OpenTelemetry instrumentation code from `./books/main.go`, and add i to the `./lib/instrumentation/instrumentation.go`.
```go
// ./lib/instrumentation/instrumentation.go
package instrumentation
import (
"context"
"fmt"
"time"
"go.opentelemetry.io/otel"
"go.opentelemetry.io/otel/exporters/otlp/otlptrace/otlptracegrpc"
"go.opentelemetry.io/otel/propagation"
"go.opentelemetry.io/otel/sdk/resource"
sdktrace "go.opentelemetry.io/otel/sdk/trace"
semconv "go.opentelemetry.io/otel/semconv/v1.12.0"
"google.golang.org/grpc"
"google.golang.org/grpc/credentials/insecure"
)
func NewExporter(ctx context.Context) (sdktrace.SpanExporter, error) {
ctx, cancel := context.WithTimeout(ctx, time.Second)
defer cancel()
conn, err := grpc.DialContext(ctx, "otel-collector:4317", grpc.WithTransportCredentials(insecure.NewCredentials()), grpc.WithBlock())
if err != nil {
return nil, fmt.Errorf("failed to create gRPC connection to collector: %w", err)
}
traceExporter, err := otlptracegrpc.New(ctx, otlptracegrpc.WithGRPCConn(conn))
if err != nil {
return nil, fmt.Errorf("failed to create trace exporter: %w", err)
}
return traceExporter, nil
}
func NewTraceProvider(svcName string, exp sdktrace.SpanExporter) *sdktrace.TracerProvider {
// Ensure default SDK resources and the required service name are set.
r, err := resource.Merge(
resource.Default(),
resource.NewWithAttributes(
semconv.SchemaURL,
semconv.ServiceNameKey.String(svcName),
),
)
if err != nil {
panic(err)
}
tp := sdktrace.NewTracerProvider(
sdktrace.WithBatcher(exp),
sdktrace.WithResource(r),
)
otel.SetTextMapPropagator(
propagation.NewCompositeTextMapPropagator(
propagation.TraceContext{},
propagation.Baggage{},
),
)
return tp
}
```
Don’t forget to run `go mod tidy` in the terminal from the `./lib` folder to make sure the dependencies are downloaded and saved. You can now safely commit and push this code to GitHub. This will let you download it and use it in both the `books` and `availability` microservices. Lets move on to updating the `books` service first.
```go
// ./books/main.go
package main
import (
"context"
"encoding/json"
"io"
"log"
"net/http"
"strconv"
"github.com/gorilla/mux"
// Add the instrumentation module from lib
// Make sure to first push the module to GitHub
// Watch out to get the directory tree and name to match
"github.com/your-username/bookstore/lib/instrumentation"
"go.opentelemetry.io/contrib/instrumentation/github.com/gorilla/mux/otelmux"
"go.opentelemetry.io/contrib/instrumentation/net/http/otelhttp"
"go.opentelemetry.io/otel"
"go.opentelemetry.io/otel/attribute"
"go.opentelemetry.io/otel/codes"
"go.opentelemetry.io/otel/trace"
)
const svcName = "books"
var tracer trace.Tracer
func main() {
ctx := context.Background()
// Calling the "instrumentation" module
exp, err := instrumentation.NewExporter(ctx)
if err != nil {
log.Fatalf("failed to initialize exporter: %v", err)
}
// Calling the "instrumentation" module
// Create a new tracer provider with a batch span processor and the given exporter.
tp := instrumentation.NewTraceProvider(svcName, exp)
// Handle shutdown properly so nothing leaks.
defer func() { _ = tp.Shutdown(ctx) }()
otel.SetTracerProvider(tp)
// Finally, set the tracer that can be used for this package.
tracer = tp.Tracer(svcName)
r := mux.NewRouter()
r.Use(otelmux.Middleware(svcName))
r.HandleFunc("/books", booksListHandler)
http.Handle("/", r)
log.Fatal(http.ListenAndServe(":8001", nil))
}
// ...
```
The `./books/main.go` looks exactly the same except for removing the OpenTelemetry instrumentation code and importing the `./lib/instrumentation` module instead. Make sure to edit the import to use the instrumentation module you pushed to GitHub.
Then, we use the `instrumentation` object to call the `NewExporter` and `NewTraceProvider` methods.
To make sure the behavior is the same after this change let’s restart Docker Compose and re-run the same test as above.
```bash
tracetest test run -d ./e2e/books-list.yaml -w
[Output]
✘ Books Listing (http://localhost:11633/test/qasYcU54R/run/1/test)
✘ span[name="Tracetest trigger"]
✘ #831e781a89050f81
✘ attr:tracetest.response.status = 200 (500) (http://localhost:11633/test/qasYcU54R/run/1/test?selectedAssertion=0&selectedSpan=831e781a89050f81)
✘ span[name="Books List"]
✘ #9f05d0fe6d4966e6
✔ attr:tracetest.selected_spans.count = 1 (1)
✘ attr:books.list.count = 3 (http://localhost:11633/test/qasYcU54R/run/1/test?selectedAssertion=1&selectedSpan=9f05d0fe6d4966e6)
✘ span[name = "Books List"] span[name = "Availability Check"]
✘ #meta
✘ attr:tracetest.selected_spans.count = 4 (0) (http://localhost:11633/test/qasYcU54R/run/1/test?selectedAssertion=2)
```
Awesome! We’re getting the same issue as before. Wild, isn’t it? I’m cheering because we’re getting the same issue as before!
With that out of the way, time to build our `availability` service.
## Hands-on observability-driven tests across multiple microservices
Check out the [sample code we’ve prepared for part 3.2](https://github.com/kubeshop/tracetest/tree/main/examples/observability-driven-development-go-tracetest/bookstore/part3.2) to follow along. Follow the instructions below:
```bash
git clone git@github.com:kubeshop/tracetest.git
cd examples/observability-driven-development-go-tracetest/bookstore/part3.2
docker compose -f docker-compose.yaml -f tracetest/docker-compose.yaml up
###
tracetest test run -d ./e2e/books-list.yaml -w
```
To begin, we need a new directory for our additional microservice. Create an `availability` directory in the `bookstore` directory. Initialize a Go module.
```bash
cd ./availability
go mod init github.com/your-username/bookstore/availability
```
Create a file called `./availability/main.go`. Paste this code into it.
```go
package main
import (
"context"
"io"
"log"
"net/http"
// Make sure this module matches the lib/instrumentation
// module from the previous section!
"github.com/your-username/bookstore/lib/instrumentation"
"github.com/gorilla/mux"
"go.opentelemetry.io/contrib/instrumentation/github.com/gorilla/mux/otelmux"
"go.opentelemetry.io/otel"
"go.opentelemetry.io/otel/attribute"
"go.opentelemetry.io/otel/codes"
"go.opentelemetry.io/otel/trace"
)
const svcName = "availability"
var tracer trace.Tracer
func main() {
ctx := context.Background()
exp, err := instrumentation.NewExporter(ctx)
if err != nil {
log.Fatalf("failed to initialize exporter: %v", err)
}
// Create a new tracer provider with a batch span processor and the given exporter.
tp := instrumentation.NewTraceProvider(svcName, exp)
// Handle shutdown properly so nothing leaks.
defer func() { _ = tp.Shutdown(ctx) }()
otel.SetTracerProvider(tp)
// Finally, set the tracer that can be used for this package.
tracer = tp.Tracer(svcName)
r := mux.NewRouter()
r.Use(otelmux.Middleware(svcName))
r.HandleFunc("/{bookID}", stockHandler)
http.Handle("/", r)
log.Fatal(http.ListenAndServe(":8000", nil))
}
var books = map[string]string{
"1": "10",
"2": "1",
"3": "5",
"4": "0",
}
func stockHandler(w http.ResponseWriter, r *http.Request) {
_, span := tracer.Start(r.Context(), "Availability Check")
defer span.End()
vars := mux.Vars(r)
bookID, ok := vars["bookID"]
if !ok {
span.SetStatus(codes.Error, "no bookID in URL")
w.WriteHeader(http.StatusBadRequest)
io.WriteString(w, "missing bookID in URL")
return
}
// The span we will run an assertion against
span.SetAttributes(
attribute.String("bookID", bookID),
)
stock, ok := books[bookID]
if !ok {
span.SetStatus(codes.Error, "book not found")
w.WriteHeader(http.StatusNotFound)
io.WriteString(w, "book not found")
return
}
w.WriteHeader(http.StatusOK)
io.WriteString(w, stock)
}
```
As always, run `go mod tidy` to generate a `go.sum` file and download modules.
Let me explain the code:
- We are using the `NewExporter` and `NewTraceProvider` in the `main` function just as we did in the `./books/main.go`.
- We are running an HTTP server on port `8000` that expects a `bookID` as a parameter.
- The HTTP route `/{bookID}` will trigger a `stockHandler` function. This function checks if the book is in stock or not.
Wonderful! With the availability service added, we need to add it to the `docker-compose.yaml` as well.
```yaml
services:
books:
image: your_username/books
build:
args:
SERVICE: books
ports:
- 8001:8001
depends_on:
- otel-collector
availability:
image: your_username/availability
build:
args:
SERVICE: availability
depends_on:
- otel-collector
```
The `availability` service will use the same `Dockerfile` as the `books` service.
That’s all! We’re done! Let’s restart Docker Compose and see if the `"Books Listing"` test passes.
For reference, here’s the full `./e2e/books-list.yaml` test file we’re running:
```yaml
# ./e2e/books-list.yaml
type: Test
spec:
id: qasYcU54R
name: Books Listing
description: Try books service
trigger:
type: http
httpRequest:
url: http://books:8001/books
method: GET
headers:
- key: Content-Type
value: application/json
specs:
- selector: span[name="Tracetest trigger"]
assertions:
- attr:tracetest.response.status = 200
- selector: span[name="Books List"]
assertions:
- attr:tracetest.selected_spans.count = 1
- attr:books.list.count = 3
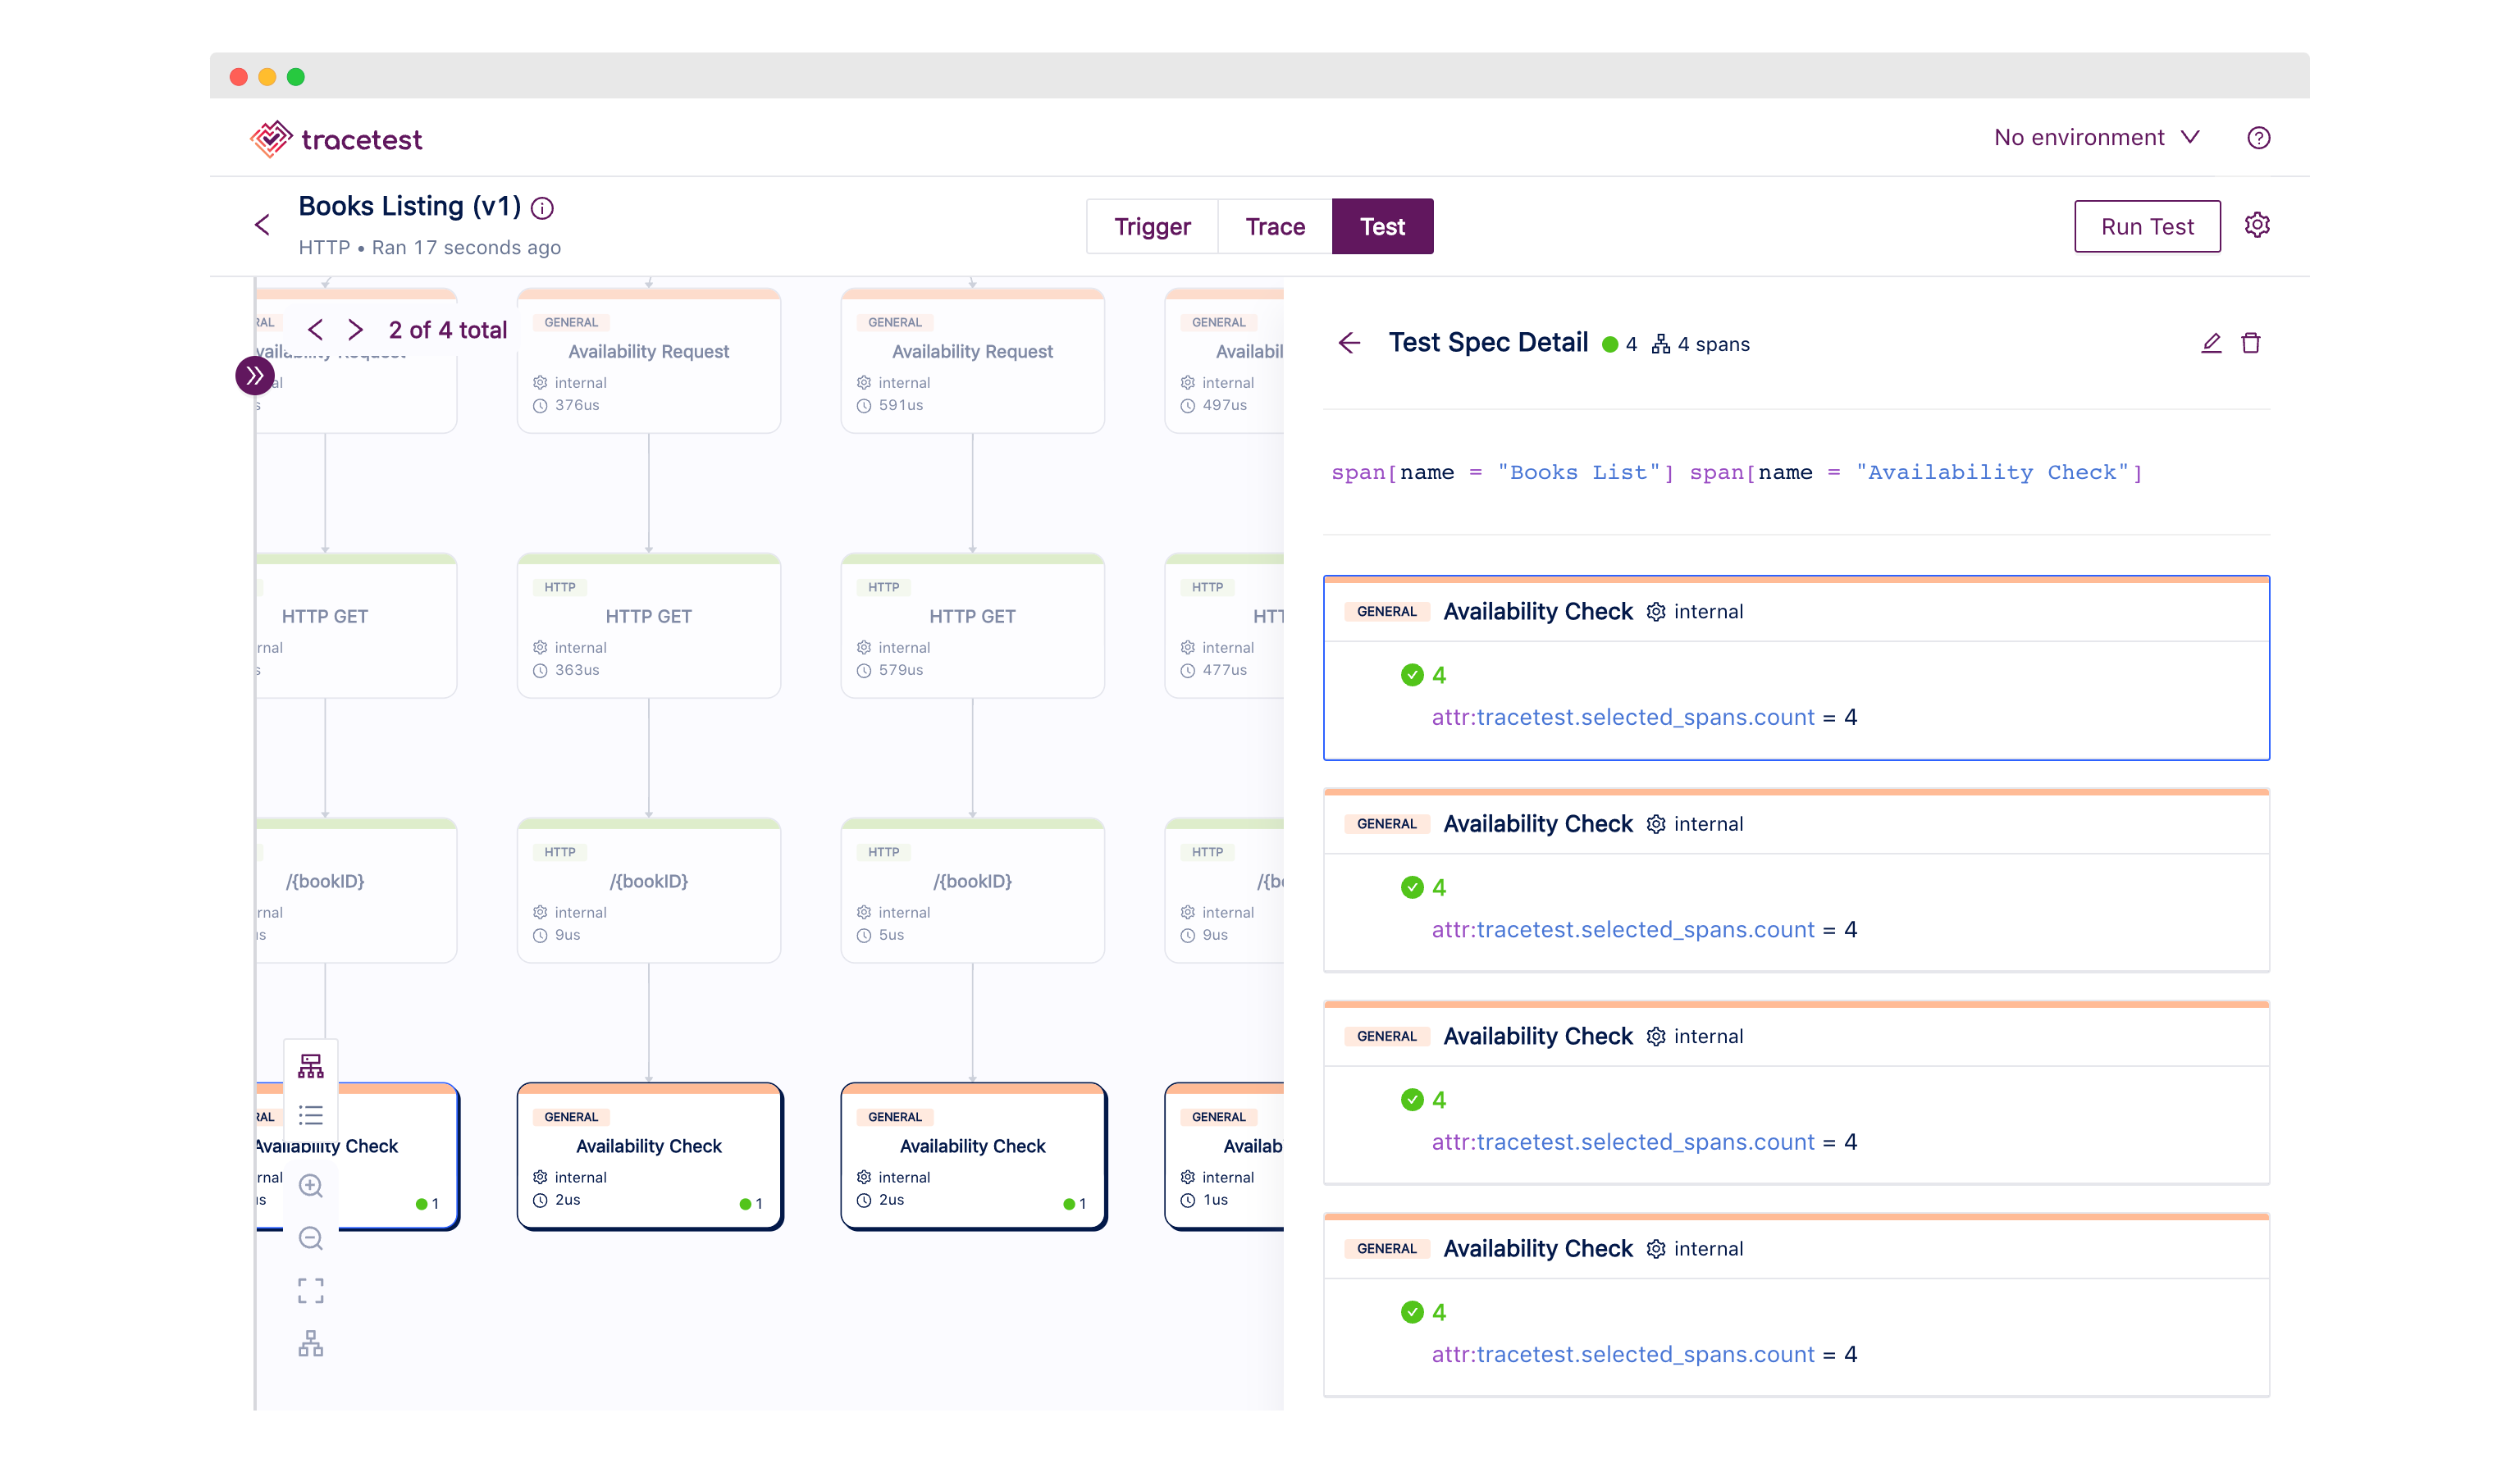
- selector: span[name = "Books List"] span[name = "Availability Check"]
assertions:
- attr:tracetest.selected_spans.count = 4
```
In your terminal, run:
```bash
tracetest test run -d ./e2e/books-list.yaml -w
[Output]
✔ Books Listing (http://localhost:11633/test/qasYcU54R/run/1/test)
``
Clicking the link will open the Tracetest Web UI and show the assertions in detail.

We can clearly see how an availability check was triggered four times. One time for every book in the list.
## Conclusion
You’ve learned how to practice observability-driven development with Go and Tracetest across multiple microservices by using a dedicated OpenTelemetry instrumentation module. Well done!
To continue learning about observability-driven development, check out our [3-part video tutorial](https://www.youtube.com/watch?v=LXVBnPqxspY&t=0s) about observability-driven development with Go and Tracetest!
Give Tracetest a try in your own applications and tracing infrastructure by following either our [quick start guide](https://docs.tracetest.io/getting-started/installation), which sets you up with the CLI tooling and the Tracetest server in a few steps, or our [detailed guide](https://docs.tracetest.io/getting-started/detailed-installation), for more details. Feel free to [give us a star on GitHub](https://github.com/kubeshop/tracetest) as well!
By practicing observability-driven development and trace-based testing best practices we want you to have a more developer friendly experience by increasing your test coverage, freeing yourself from manual testing procedures, and identifying bottlenecks you didn’t even know existed.
We’d love to hear about your ODD success stories in [Slack](https://dub.sh/tracetest-community)! We truly value your feedback, so don't be shy!
.jpg)
.avif)
.avif)