
Integrating Datadog Instrumented Apps in your OpenTelemetry Stack
.avif)

Struggling with integrating legacy APIs with OpenTelemetry? Learn to process data from Datadog-instrumented apps in your OTel stack!
Table of Contents
At Tracetest, we encountered an issue while assisting a customer to integrate legacy APIs, which were instrumented with older SDKs, with new APIs using OpenTelemetry (OTel) SDKs. We've documented our findings in this article, outlining how such a problem can arise in an observability stack and how it can be resolved using the OpenTelemetry Collector.
This guide also shows how to establish an observability pipeline that can process data from Datadog-instrumented apps. This allows you to receive and correlate data within OpenTelemetry stacks without having to send it to Datadog.
## The Legacy SDK Issue
Have you ever faced challenges with telemetry data standardization from the Datadog SDKs? Integrating Datadog SDKs with OpenTelemetry SDKs can complicate observability systems due to inconsistent telemetry data sent to Datadog. This inconsistency can make detailed data analysis, such as traces, inaccessible before it's sent to Datadog, thereby complicating the setup of an efficient observability pipeline.
## How Datadog SDKs Work
Datadog is a monitoring and analytics platform that allows developers and IT operators to observe the performance of their applications, servers, databases, and tools, all in one place, being one of the major players in the observability landscape.
To allow developers to integrate with their platform quickly, they provide a set of SDKs that enable applications to send telemetry automatically to Datadog. These SDKs are used for apps that were instrumented before OpenTelemetry started to standardize how to send telemetry with the OTLP protocol. Due to that, systems that use both Datadog SDKs and OTel SDKs can be complex in terms of observability, where their data is only available for analysis at the server level. In this scenario, developers cannot use other OTel solutions, like traces, to analyze data before sending it to Datadog.
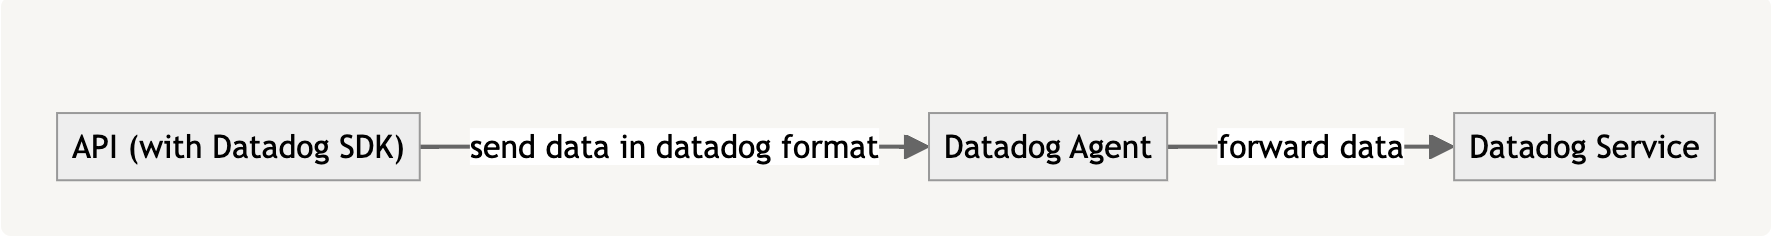
## Structure an Observability Stack with Datadog
When you instrument an API with Datadog SDKs, you must send the telemetry to an
agent, and then this agent sends your telemetry to Datadog servers.
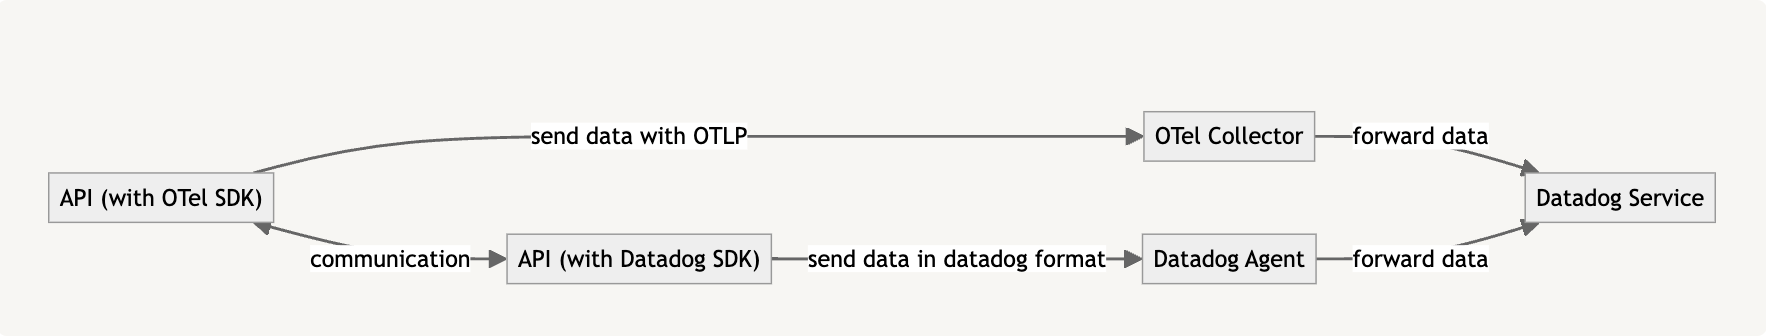
However, with the rise of OpenTelemetry as standard, new APIs usually centralize the telemetry into an OpenTelemetry Collector and then send data to Datadog, creating mixed environments where data is processed and correlated only on Datadog servers.
To simplify this structure, we can centralize all the communication in an OpenTelemetry Collector and set up a [datadog receiver](https://github.com/open-telemetry/opentelemetry-collector-contrib/tree/main/receiver/datadogreceiver) that works like an agent, receiving traces and metrics in Datadog proprietary format:
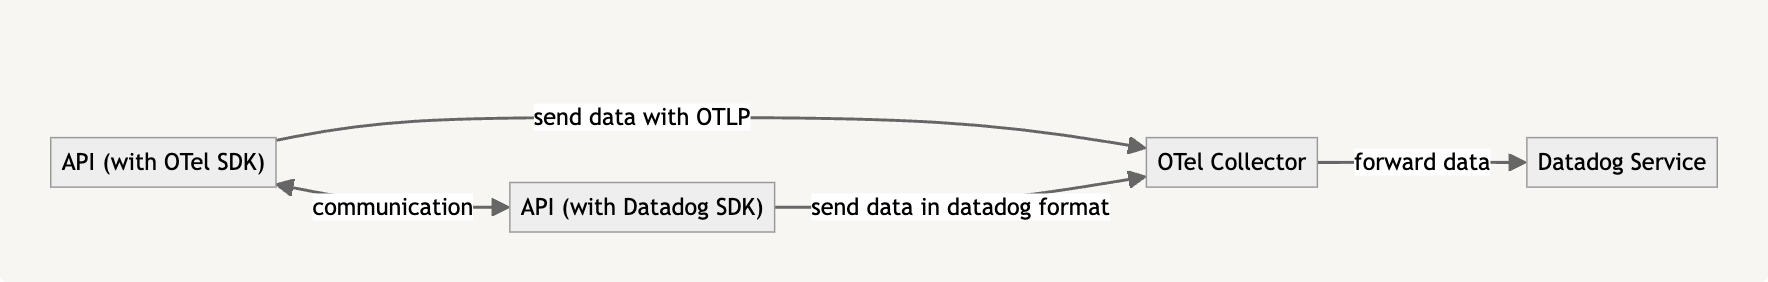
To set up your OpenTelemetry Collector with this receiver, you must use the [OTel Collector Contrib](https://github.com/open-telemetry/opentelemetry-collector-contrib) distribution and add [the `datadog` receiver](https://github.com/open-telemetry/opentelemetry-collector-contrib/blob/main/receiver/datadogreceiver/README.md) in the configuration file:
```jsx
receivers:
otlp:
protocols:
grpc:
http:
datadog:
endpoint: 0.0.0.0:8126
read_timeout: 60s
# ...
service:
pipelines:
traces:
receivers: [otlp, datadog]
# ...
```
## Sending Datadog Data to Jaeger
Using the latest proposed architecture as a head start, let’s download a demo example that shows how to adapt this architecture to send data to Jaeger, allowing you to run the API locally and make any observability changes needed before publishing to production.
First, open a terminal and download the demo with the following commands:
```bash
git clone git@github.com:kubeshop/tracetest.git
cd ./examples/datadog-propagation
docker compose -f ./docker-compose.step1.yaml up -d
```
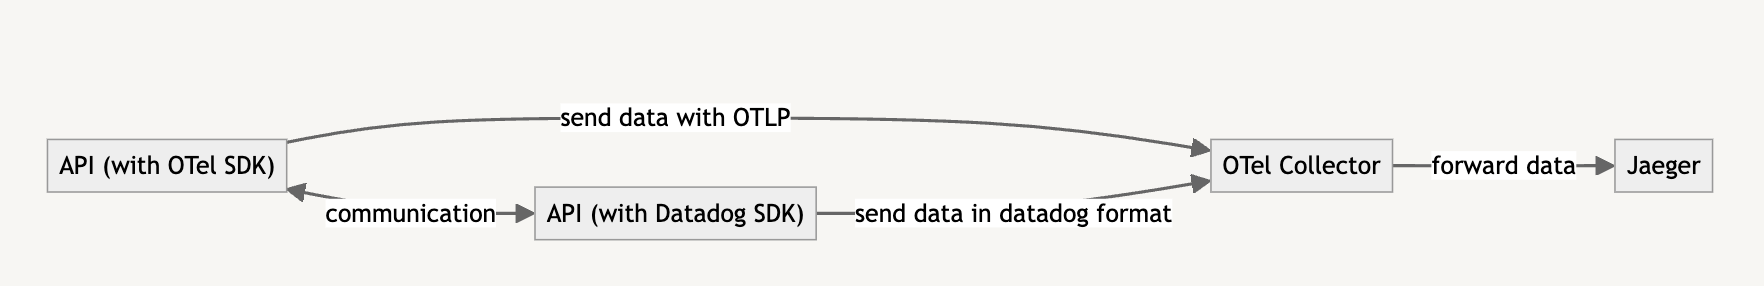
This action starts two Ruby on Rails APIs, one instrumented with [ddtrace](https://github.com/datadog/dd-trace-rb) and another with [OpenTelemetry SDK](https://github.com/open-telemetry/opentelemetry-ruby), both connecting to an OpenTelemetry Collector that sends data to Jaeger:
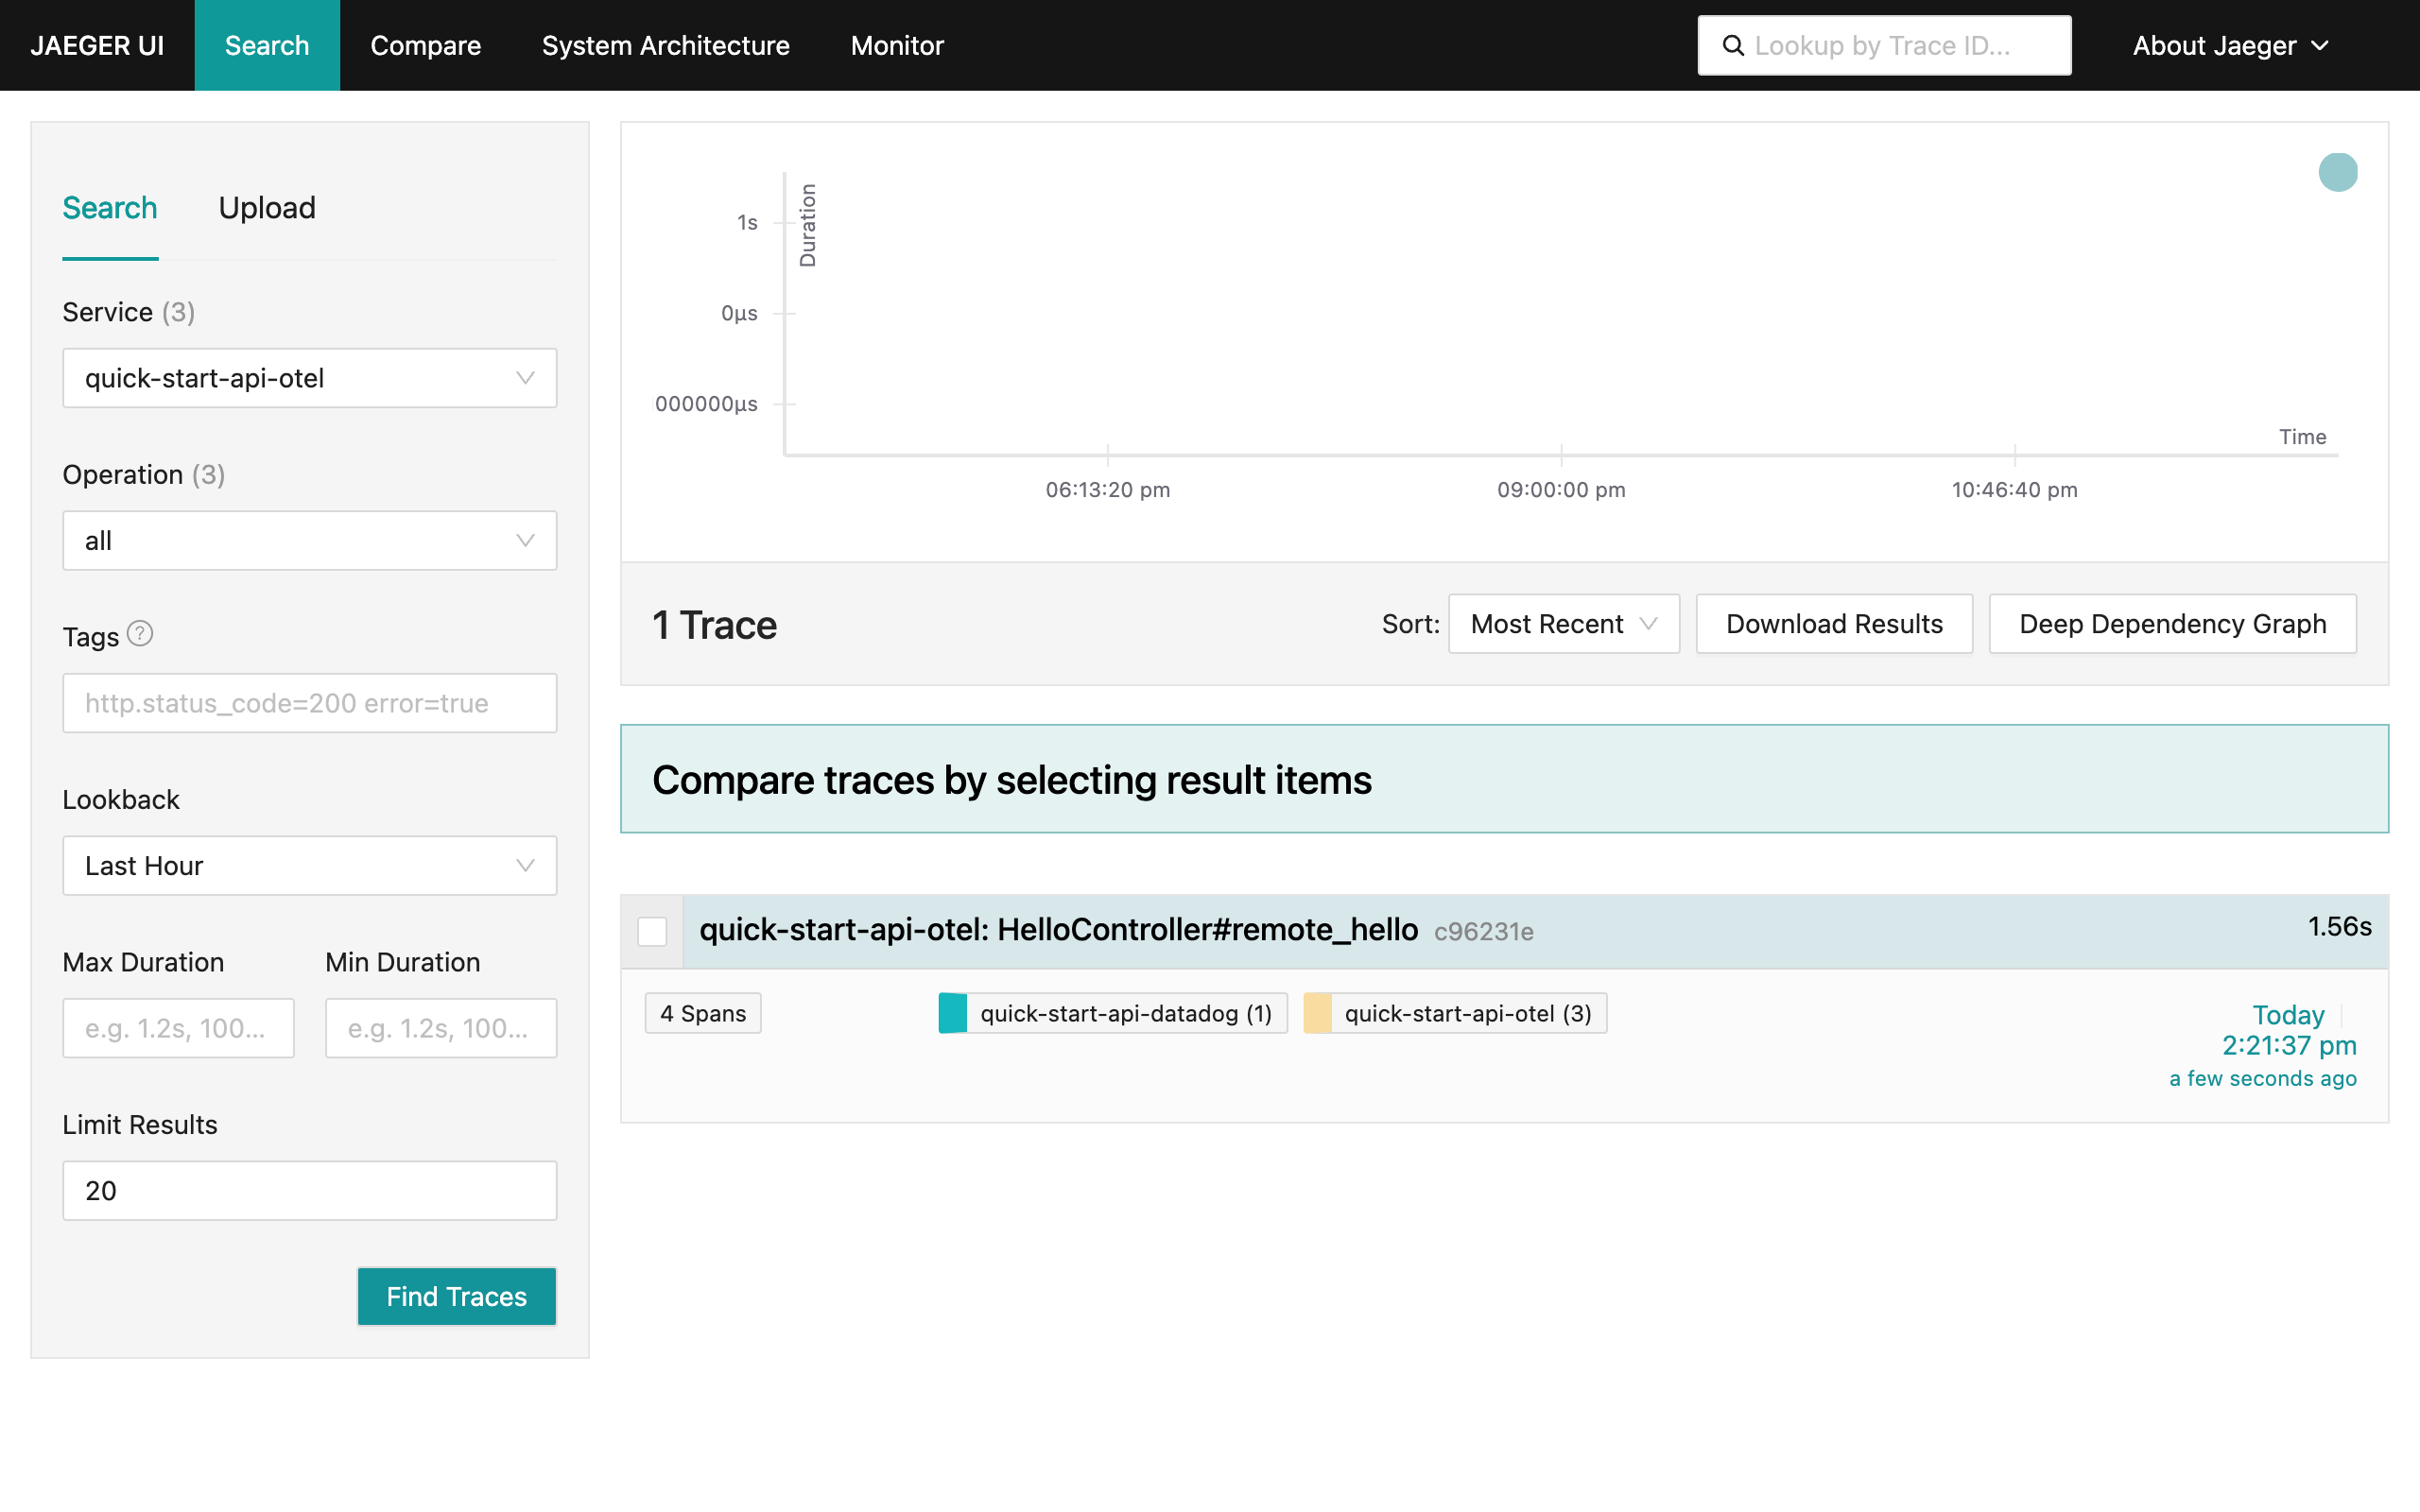
Next, you can call the OTelSDK-instrumented API, which executes an internal endpoint on the Datadog-instrumented API and returns an output. It is expected that this operation generates just one trace. Try it by executing the command:
```bash
> curl http://localhost:8080/remotehello
# it returns:
# {"hello":"world!","from":"quick-start-api-otel","to":"quick-start-api-datadog"}
```
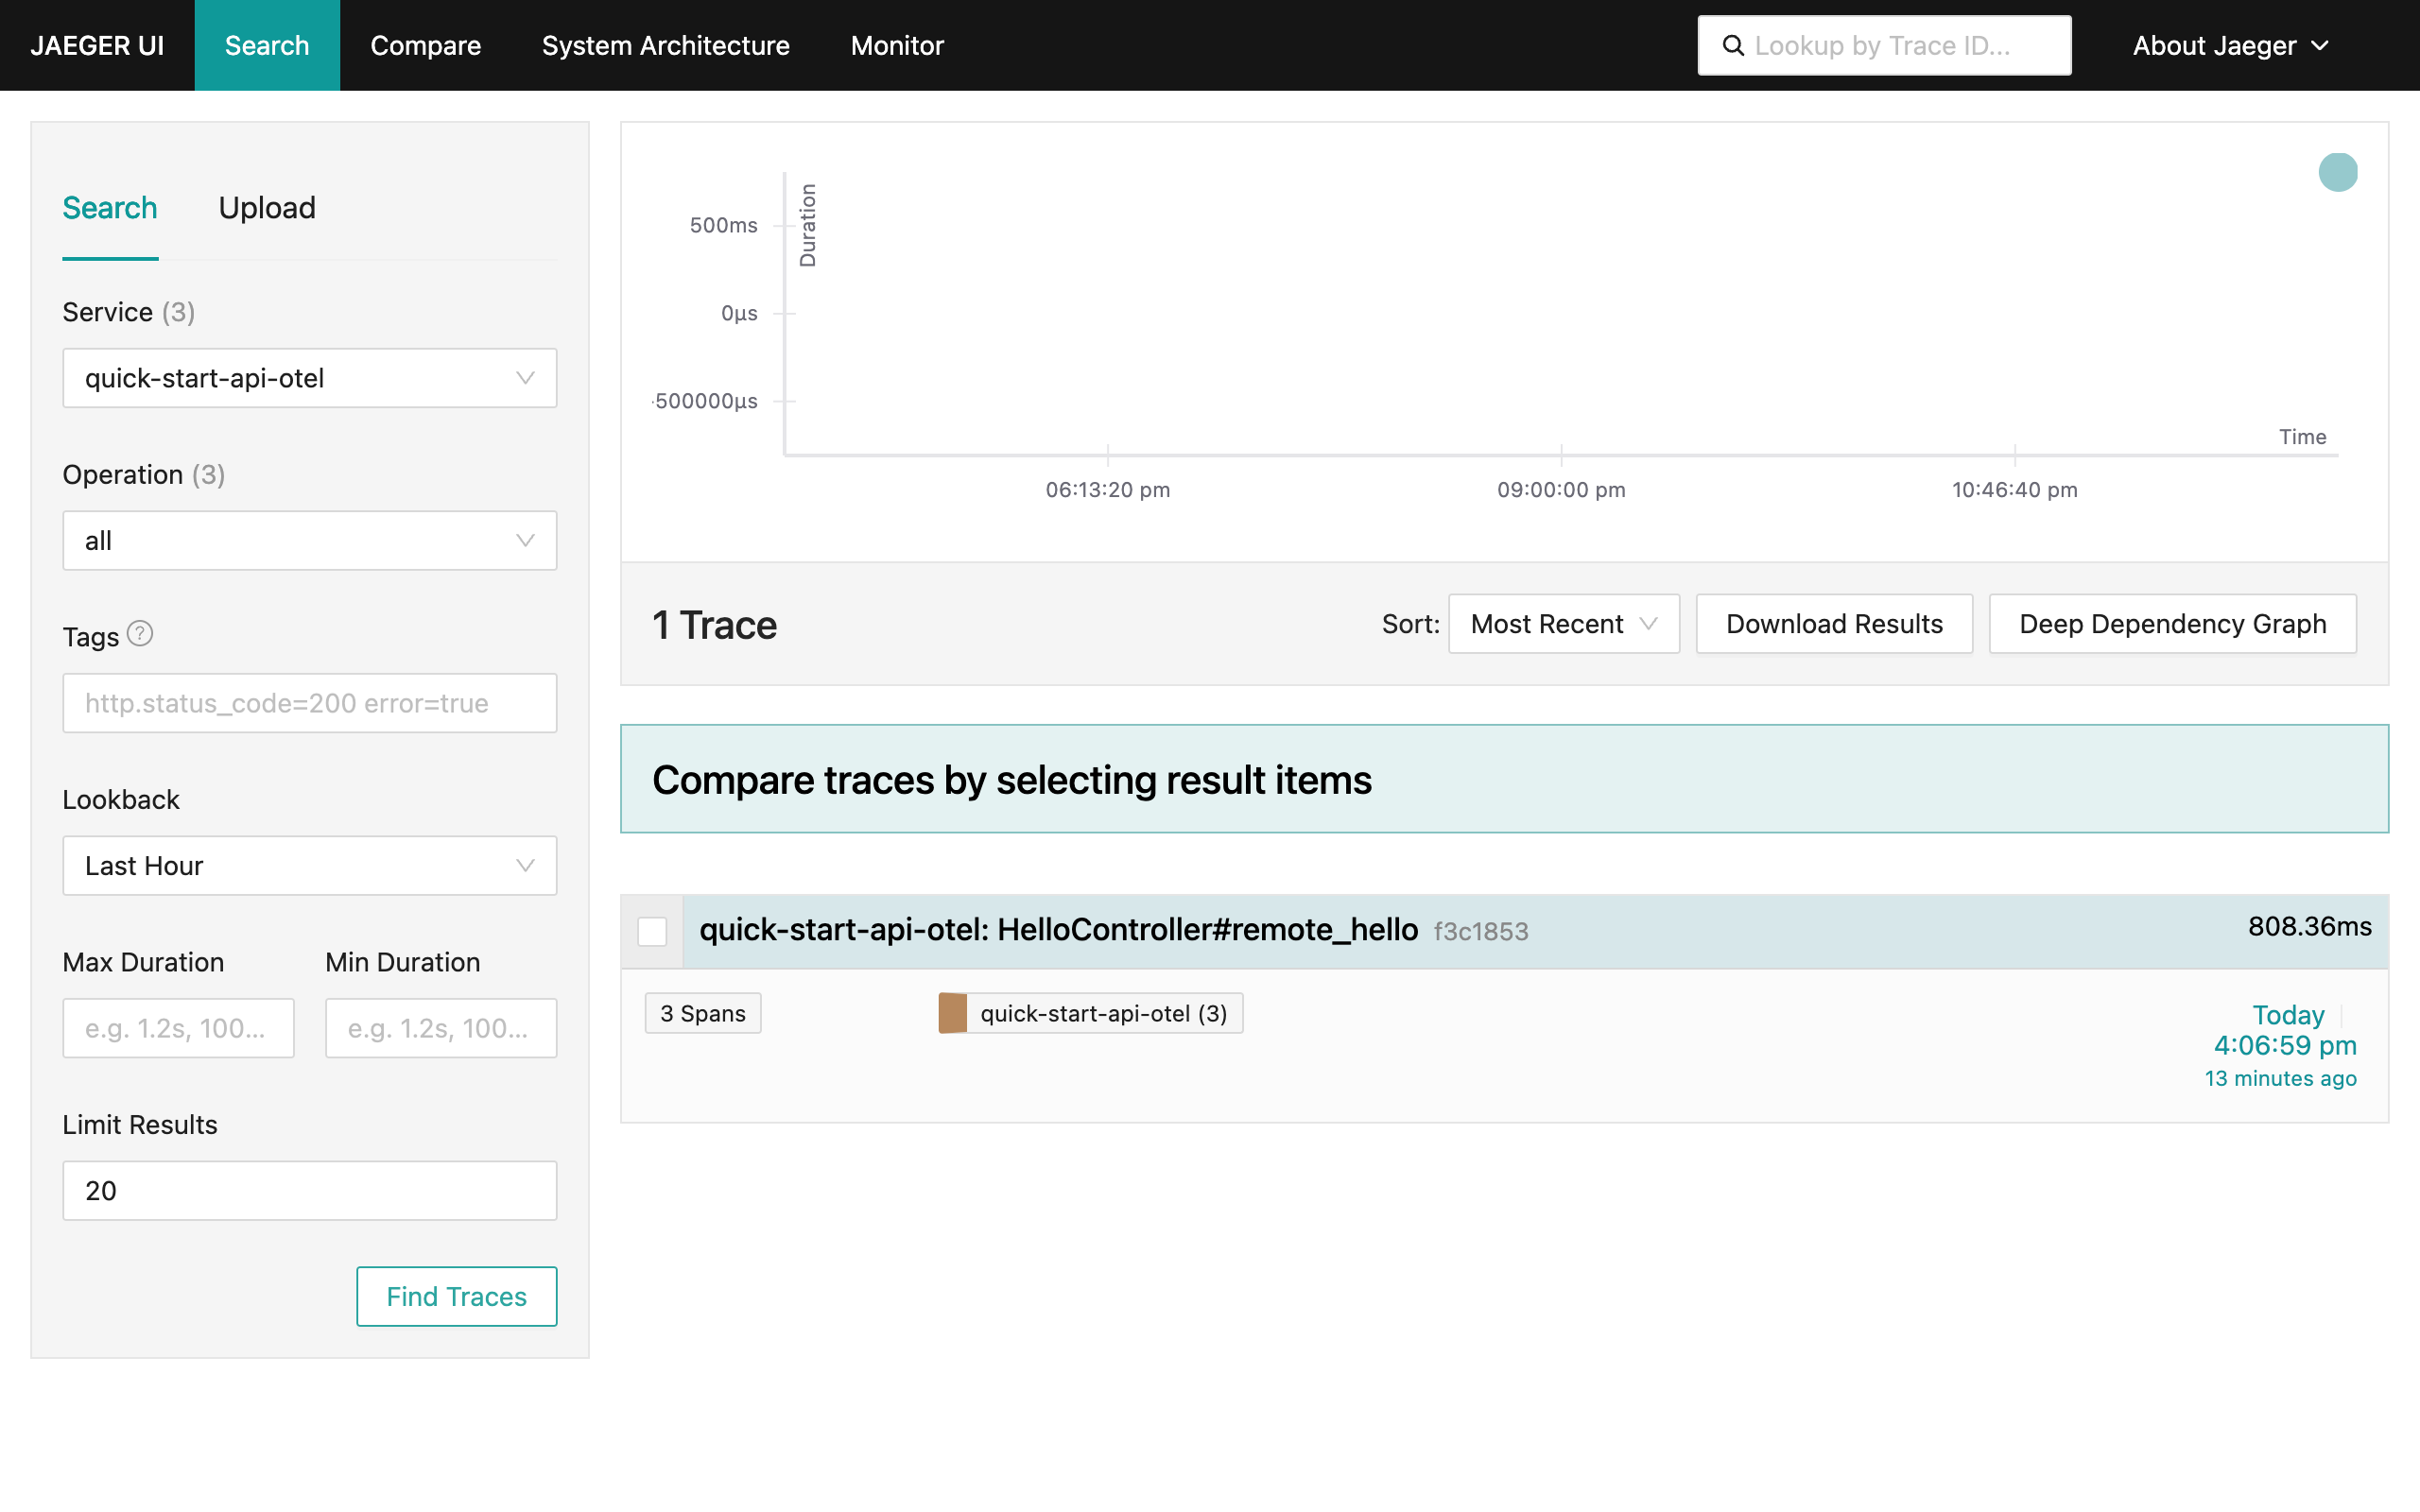
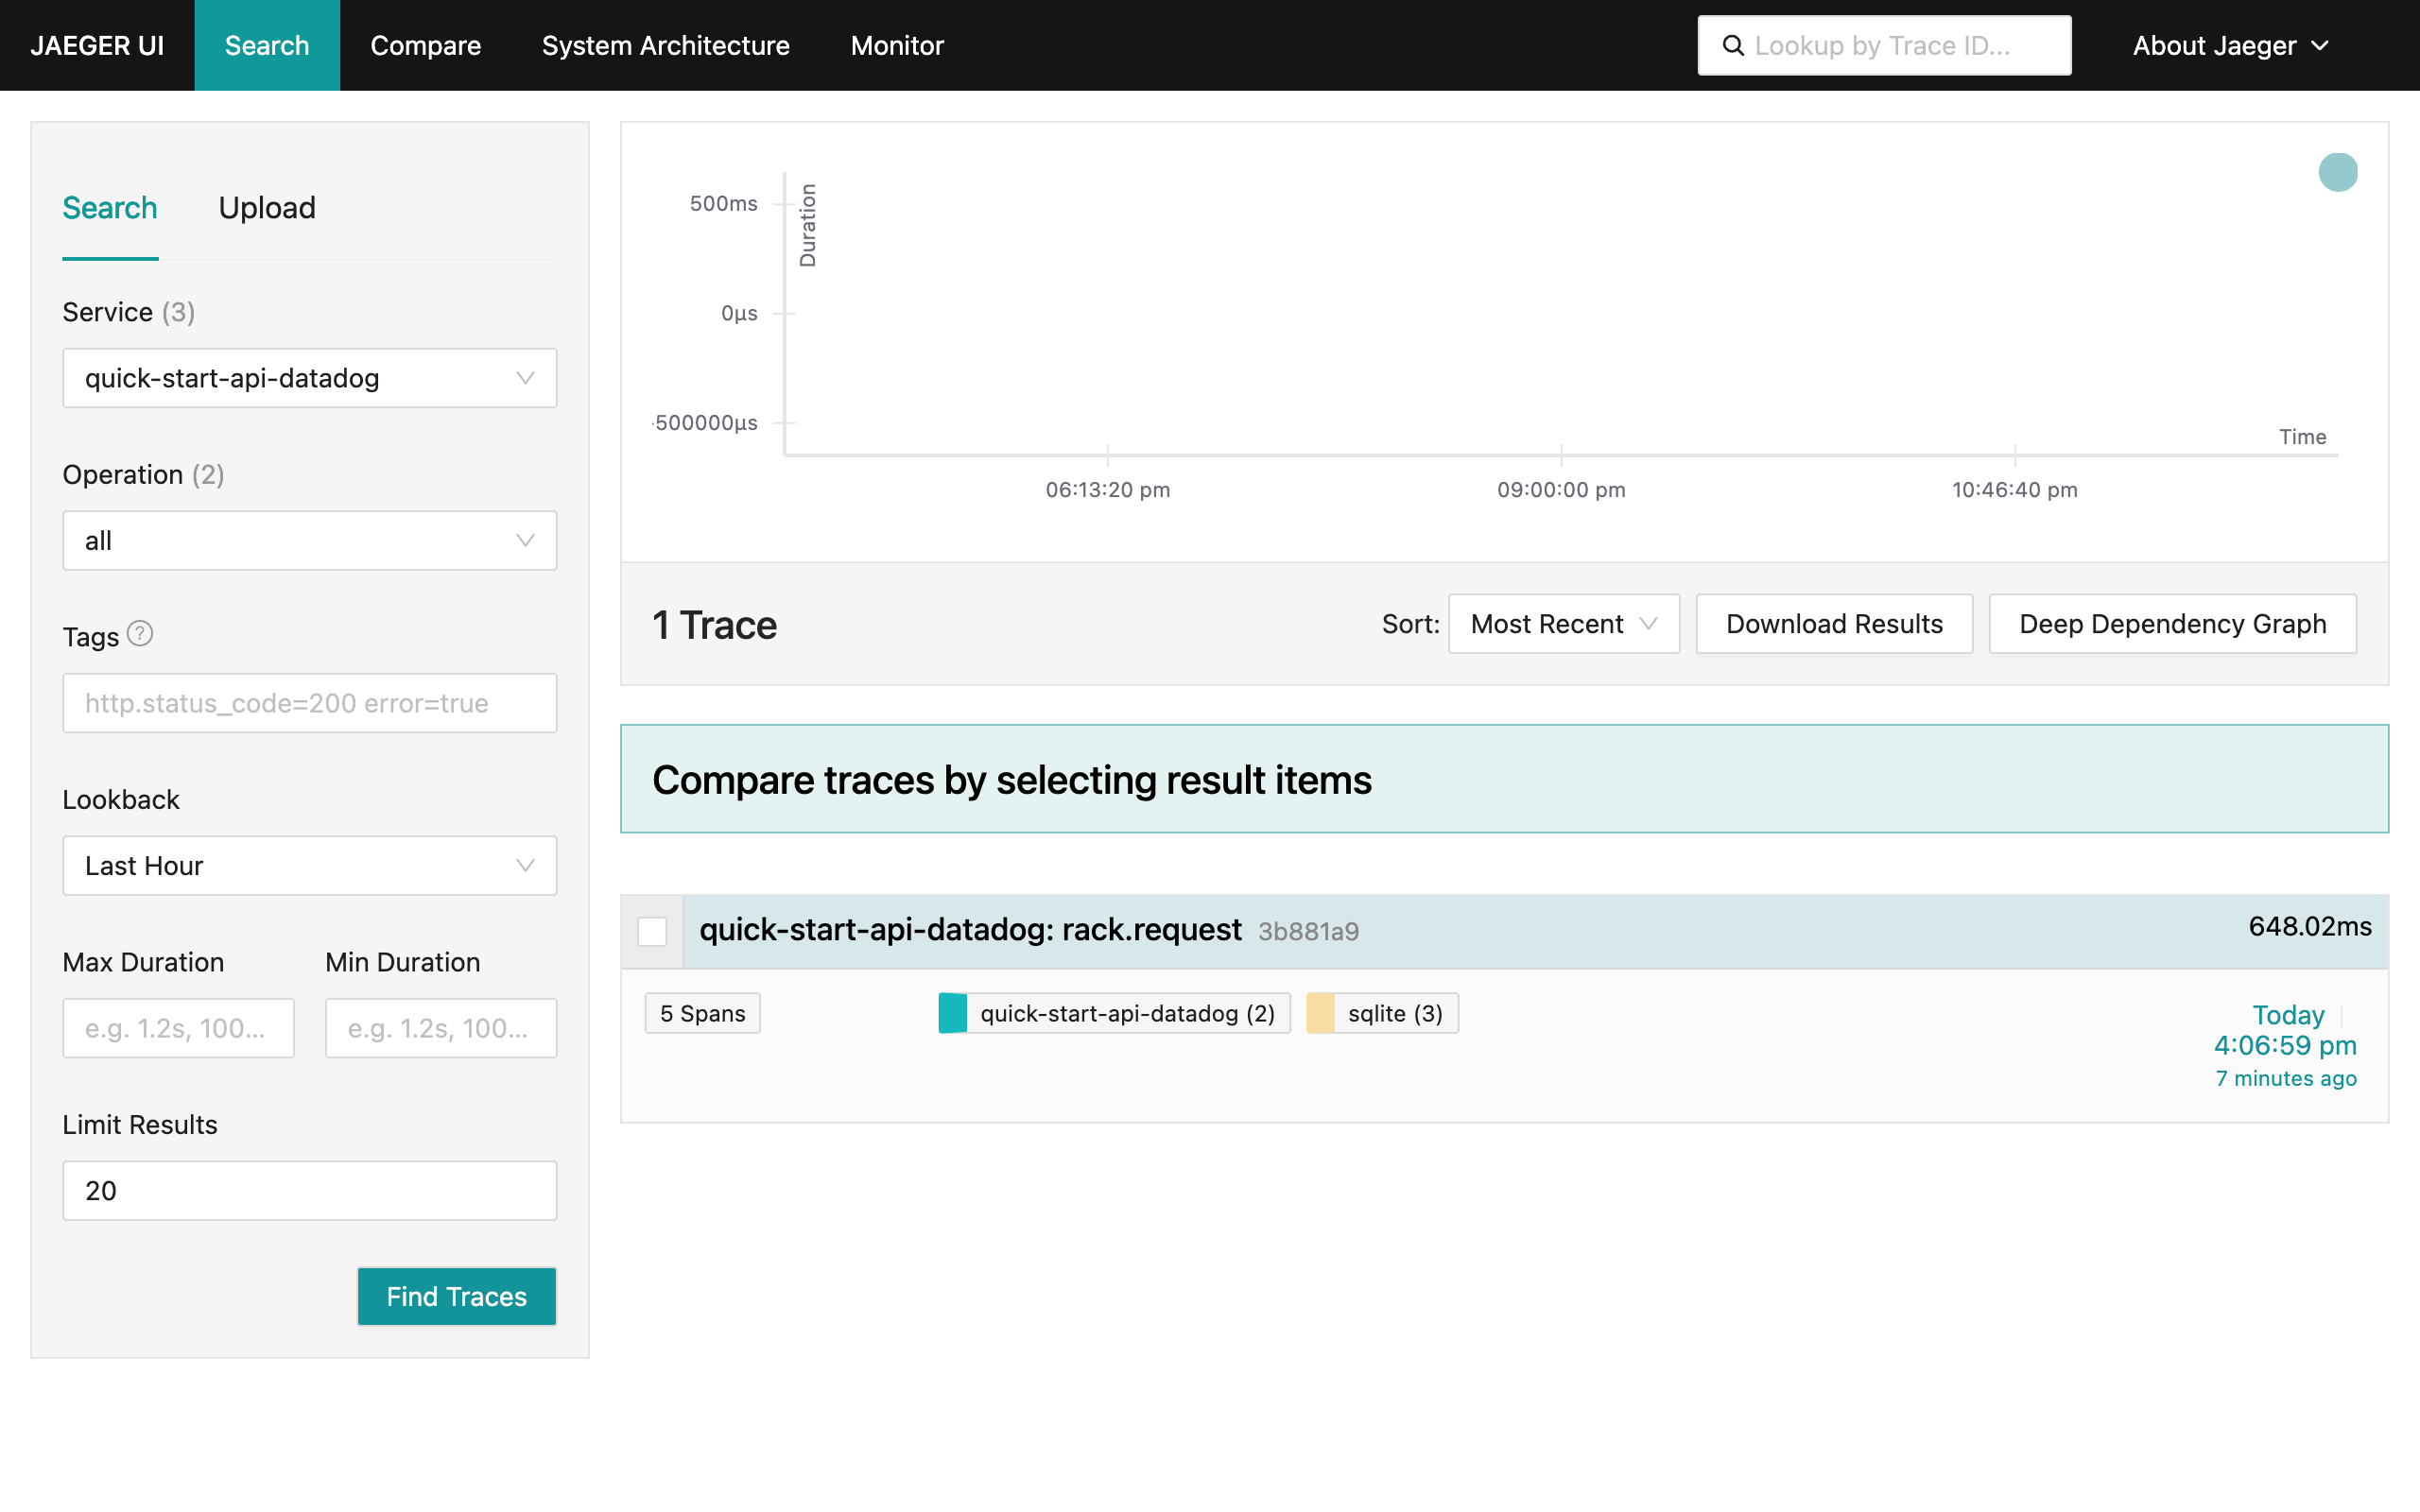
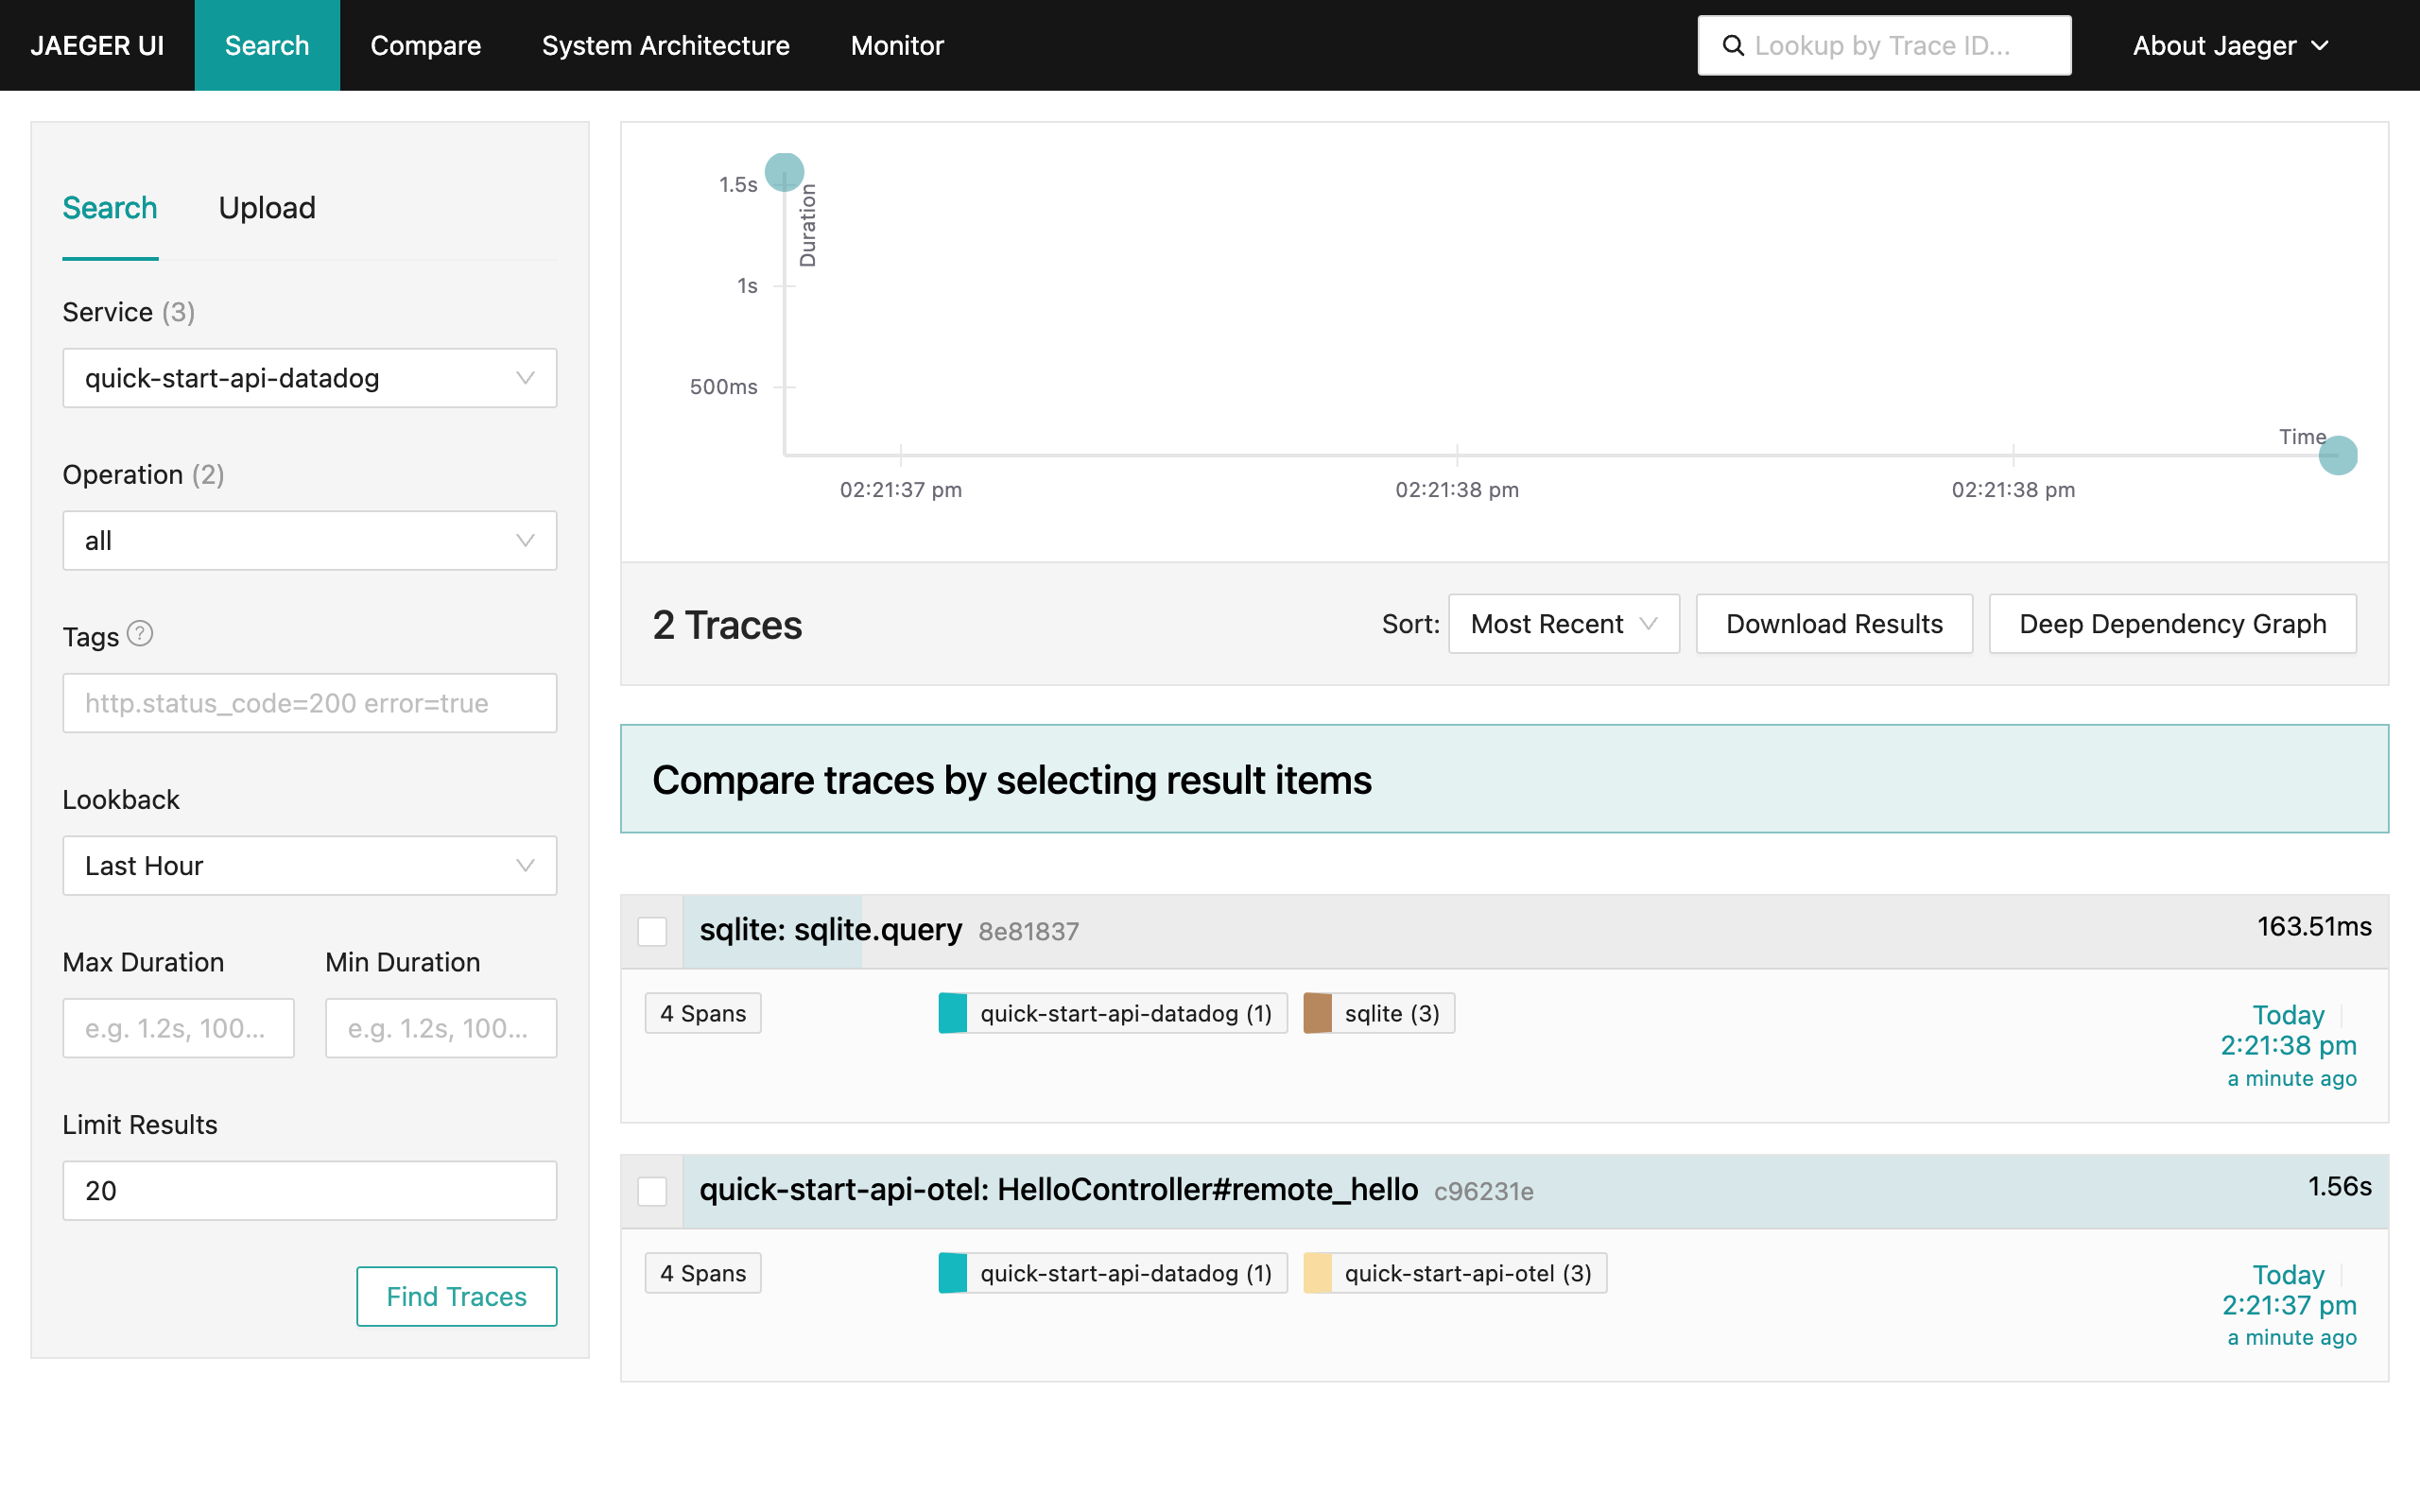
However, when accessing Jaeger locally (via the link [http://localhost:16686/](http://localhost:16686/)), you see that **two** disjointed traces were generated, one for each API:
To correct this problem, you need to change your stack a little bit. Read on to learn how to apply these changes.
### Understand `trace_id` Representations for Datadog and OpenTelemetry
This issue happens due to a difference in the representation of `trace_id`s in Datadog format and OTel SDK format. Datadog considers a `trace_id` as an unsigned Int64, while the OpenTelemetry SDK considers it as a 128-bit hexadecimal representation:
- **Datadog TraceID (int64):** `4289707906147384633`
- **Datadog TraceID (hex):** `3b881a9ce0197d39`
- **OTelSDK TraceID (hex):** `f3c18530c08e00a43b881a9ce0197d39`
Since you have two TraceID representations, you have two Traces in Jaeger.
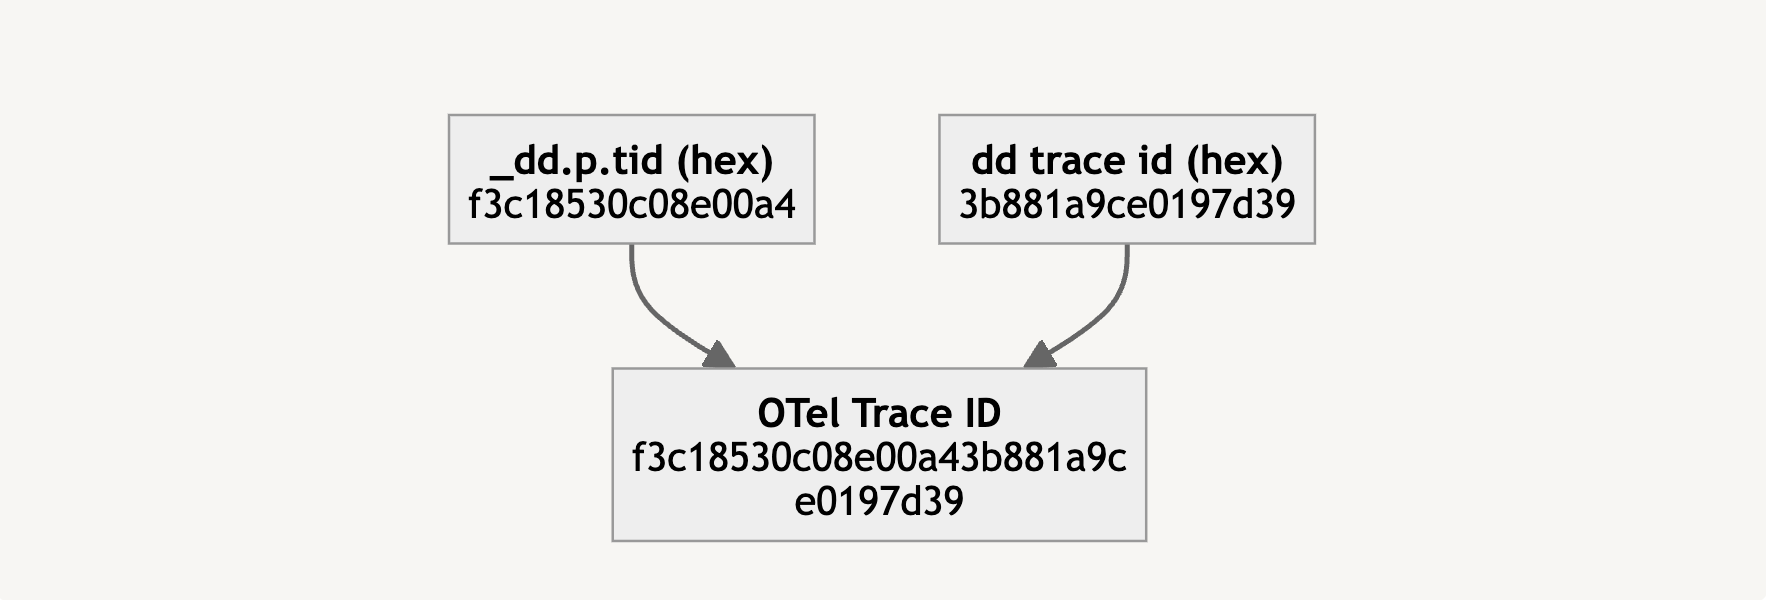
To propagate their traces through an OpenTelemetry stack, Datadog has an internal representation that can be used to reconstruct a TraceID, which they call, internally in their SDK, as `Upper TraceID`, represented by the attribute `_dd.p.tid` appended to the first span of its trace:
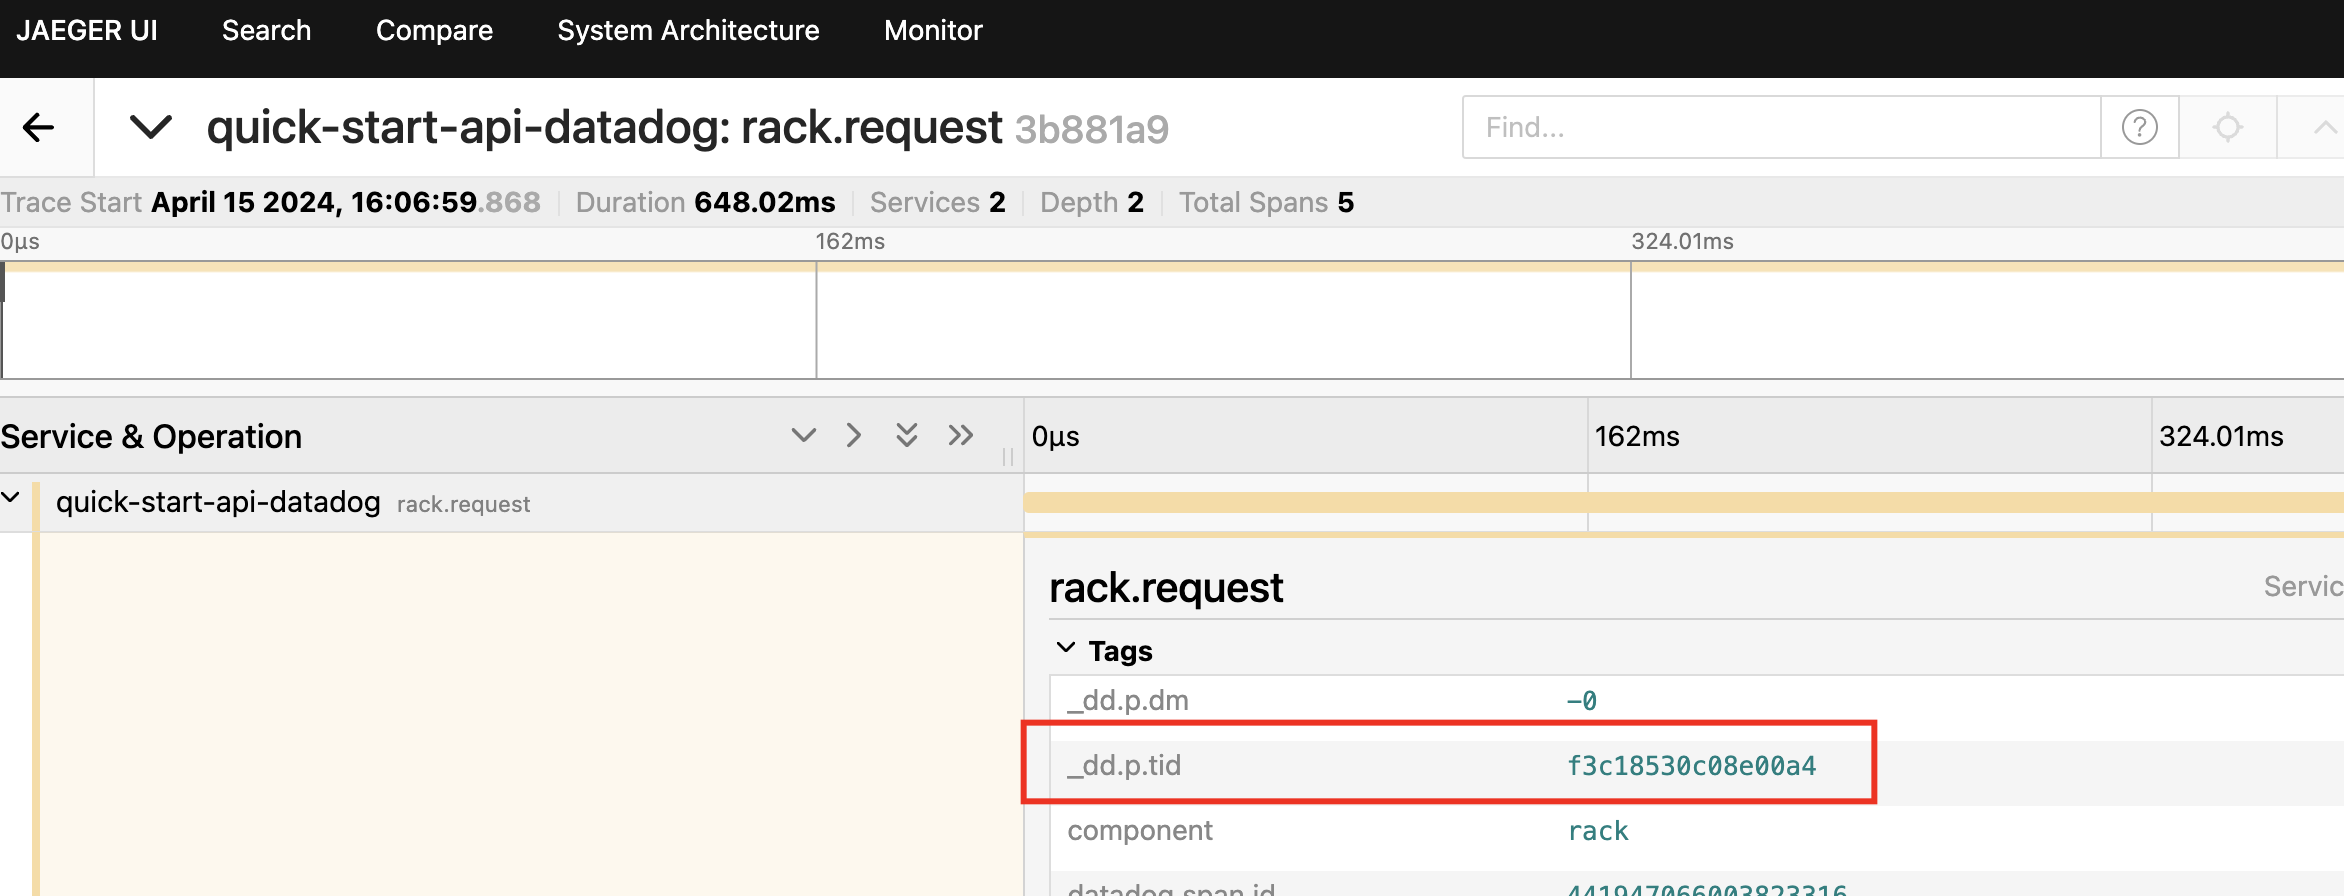
Concatenating this `Upper TraceID` with Datadog’s TraceID in hexadecimal representation (called `Lower TraceID`), you have the exact TraceID representation for an OpenTelemetry stack:
Now, to create this representation, we will reconstruct the TraceID at the OpenTelemetry Collector level, using the [transform processor](https://github.com/open-telemetry/opentelemetry-collector-contrib/tree/main/processor/transformprocessor).
### Reconstructing TraceID for Datadog Spans
The OTel Collector [transform processor](https://github.com/open-telemetry/opentelemetry-collector-contrib/tree/main/processor/transformprocessor) is a component that transforms span data as it passes through the OpenTelemetry Collector. It can modify attributes of a span such as name, kind, attributes, resources, and instrumentation library, among others.
In this context, the `transform processor` is used to reconstruct the TraceID for Datadog spans to facilitate a unified tracing environment.
In the OTel Collector config, you can configure the `transform processor` as follows:
```bash
processors:
# ...
transform:
trace_statements:
- context: span
statements:
# transformation statements
- set(cache["upper_trace_id"], attributes["_dd.p.tid"]) where attributes["_dd.p.tid"] != nil
- set(cache["lower_trace_id"], Substring(trace_id.string, 16, 16)) where cache["upper_trace_id"] != nil
- set(cache["combined_trace_id"], Concat([cache["upper_trace_id"], cache["lower_trace_id"]],"")) where cache["upper_trace_id"] != nil
- set(trace_id.string, cache["combined_trace_id"]) where cache["combined_trace_id"] != nil
```
Next, add four transformation statements:
- `set(cache["upper_trace_id"], attributes["_dd.p.tid"]) where attributes["_dd.p.tid"] != nil`, where we will capture the Upper TraceID from the `_dd.p.tid` attribute if it is defined and set it to a temporary cache;
- `set(cache["lower_trace_id"], Substring(trace_id.string, 16, 16)) where cache["upper_trace_id"] != nil`, where we will convert a Datadog TraceID into hexadecimal format (where we will have sixteen zeros plus the Lower TraceID). We will remove the "zeros” segment and grab the second half of it (this is why we have a sub string getting only the last 16 hex digits from the TraceID);
- `set(cache["combined_trace_id"], Concat([cache["upper_trace_id"], cache["lower_trace_id"]],"")) where cache["upper_trace_id"] != nil`,
where we concatenate `upper_trace_id` and `lower_trace_id` into the OpenTelemetry TraceID;
- `set(trace_id.string, cache["combined_trace_id"]) where cache["combined_trace_id"] != nil` and finally we set the `trace_id` for this span with the string concatenation.
To see it working, run your example again, with a different `docker compose` file and then execute the same API call as before:
```bash
> docker compose -f ./docker-compose.step2.yaml up -d
> curl http://localhost:8080/remotehello
# it returns:
# {"hello":"world!","from":"quick-start-api-otel","to":"quick-start-api-datadog"}
```
Looking at the Jaeger UI, you can see that the problem was partially solved. Now you have a trace propagated between the Datadog-instrumented API and the OpenTelemetry-instrumented API.
However, all child spans generated by Datadog are segregated in a different trace, defined only as the Lower TraceID. This happens because `ddtrace` only sends a `_dd.p.tid` attribute for the first span generated internally, which makes your transform statements skip the child spans.
### Patch Datadog Trace to Send the Upper TraceID to Every Child Span
Since the OpenTelemetry Collector was [designed to process spans considering distributed systems](https://www.notion.so/docs/collector/scaling/), there’s no way to maintain an internal state to replicate the `_dd.p.tid` attribute for the child spans received by the `datadog` receiver.
You can solve this problem directly in the Datadog-instrumented API by applying a minor patch to `ddtrace` to replicate `_dd.p.tid` to all child spans.
In the [`ddtrace` Ruby version](https://github.com/kubeshop/tracetest/blob/main/examples/datadog-propagation/quick_start_api_datadog/config/initializers/datadog.rb#L20), the trace serialization is modified to send this data below:
```ruby
module Datadog
module Tracing
module Transport
class SerializableTrace
def to_msgpack(packer = nil)
if ENV.has_key?('INJECT_UPPER_TRACE_ID')
return trace.spans.map { |s| SerializableSpan.new(s) }.to_msgpack(packer)
end
upper_trace_id = trace.spans.find { |span| span.meta.has_key?('_dd.p.tid') }.meta['_dd.p.tid']
trace.spans.each do |span|
span.meta["propagation.upper_trace_id"] = upper_trace_id
end
trace.spans.map { |s| SerializableSpan.new(s) }.to_msgpack(packer)
end
end
end
end
end
```
Since it is a customization on the traces, you can opt to grab the `_dd.p.tid` attribute and inject it in each span as the `propagation.upper_trace_id` attribute. Then you can [change](https://github.com/kubeshop/tracetest/blob/main/examples/datadog-propagation/collector/collector.config.step3.yaml#L18) the `transform` processor in the OpenTelemetry Collector to consider this:
```ruby
transform:
trace_statements:
- context: span
statements:
- set(cache["upper_trace_id"], attributes["propagation.upper_trace_id"]) where attributes["propagation.upper_trace_id"] != nil
- set(cache["lower_trace_id"], Substring(trace_id.string, 16, 16)) where cache["upper_trace_id"] != nil
- set(cache["combined_trace_id"], Concat([cache["upper_trace_id"], cache["lower_trace_id"]],"")) where cache["upper_trace_id"] != nil
- set(trace_id.string, cache["combined_trace_id"]) where cache["combined_trace_id"] != nil
```
With these changes done, let’s run a new setup with our example:
```bash
> docker compose -f ./docker-compose.step3.yaml up -d
> curl http://localhost:8080/remotehello
# it returns:
# {"hello":"world!","from":"quick-start-api-otel","to":"quick-start-api-datadog"}
```
Opening the Jaeger UI again, you see that the problem is solved! Now you have a
single trace between both APIs and can evaluate a process as a whole on a
developer machine.

### Testing the Observability Stack
Until now, we have been testing the telemetry manually, which can be time-consuming if both APIs are constantly changing. To evaluate both APIs automatically and guarantee that everything working properly, we can create [trace-based tests](https://docs.tracetest.io/concepts/what-is-trace-based-testing), trigger HTTP calls against the APIs, and validate if our traces are logged as intended.
To do that, we will use Tracetest, which triggers service calls (in our case, HTTP calls like our `curl` calls) and validate the emitted traces to ensure that our observability stack is working as intended.
First, we will create a new account on [Tracetest.io](https://tracetest.io/), by accessing [https://app.tracetest.io](https://app.tracetest.io), and then create a [new environment](https://docs.tracetest.io/concepts/environments). Once we have an [API Key for our agent](https://docs.tracetest.io/configuration/agent), we will start our local stack with a new container with a Tracetest Agent:
```bash
> TRACETEST_API_KEY=your-api-key docker compose -f ./docker-compose.step4.yaml up -d
```
Then, we will [install Tracetest CLI](https://docs.tracetest.io/getting-started/installation) and configure it to access our environment with the following command that will guide you to connect to your `personal-org` and environment:
```bash
> tracetest configure
# This command will print some instructions interactively to help to connect to your env:
# What tracetest server do you want to use? (default: https://app.tracetest.io/)
# What Organization do you want to use?:
# > personal-org (ttorg_000000000000000)
# What Environment do you want to use?:
# > OTel (ttenv_000000000000000)
# SUCCESS Successfully configured Tracetest CLI
```
Now we will configure our agent to connect to our local Jaeger, using the following command:
```bash
> tracetest apply datastore -f ./tracebased-tests/tracing-backend.yaml
# It will send the following output, which means that our environment was correctly configured:
# type: DataStore
# spec:
# id: current
# name: Jaeger Tracing Backend
# type: jaeger
# default: true
# createdAt: 2023-10-31T00:30:47.137194Z
# jaeger:
# endpoint: jaeger:16685
# tls:
# insecure: true
```
Next, write a test that checks the trace generated by a calling the `[http://localhost:8080/remotehello](http://localhost:8080/remotehello)` URL and validate whether it has at least one span for both APIs. To do that, we will create a test file called `./tracebased-tests/test_integration.yaml` with the following contents:
```yaml
type: Test
spec:
id: CdhJp_xIR
name: Test observability integration between OTelSDK-instrumented API to Datadog-instrumented API
trigger:
type: http
httpRequest:
method: GET
url: http://api-otel:8080/remotehello
headers:
- key: Content-Type
value: application/json
specs:
- selector: "span[tracetest.span.type=\"http\" name=\"HelloController#remote_hello\" http.target=\"/remotehello\" http.method=\"GET\"]"
name: OpenTelemetryAPI-instrumented API has been called
assertions:
- attr:http.status_code = 200
- selector: span[tracetest.span.type="http" name="rack.request" http.method="GET"]
name: Datadog-instrumented API has been called
assertions:
- attr:http.status_code = 200
```
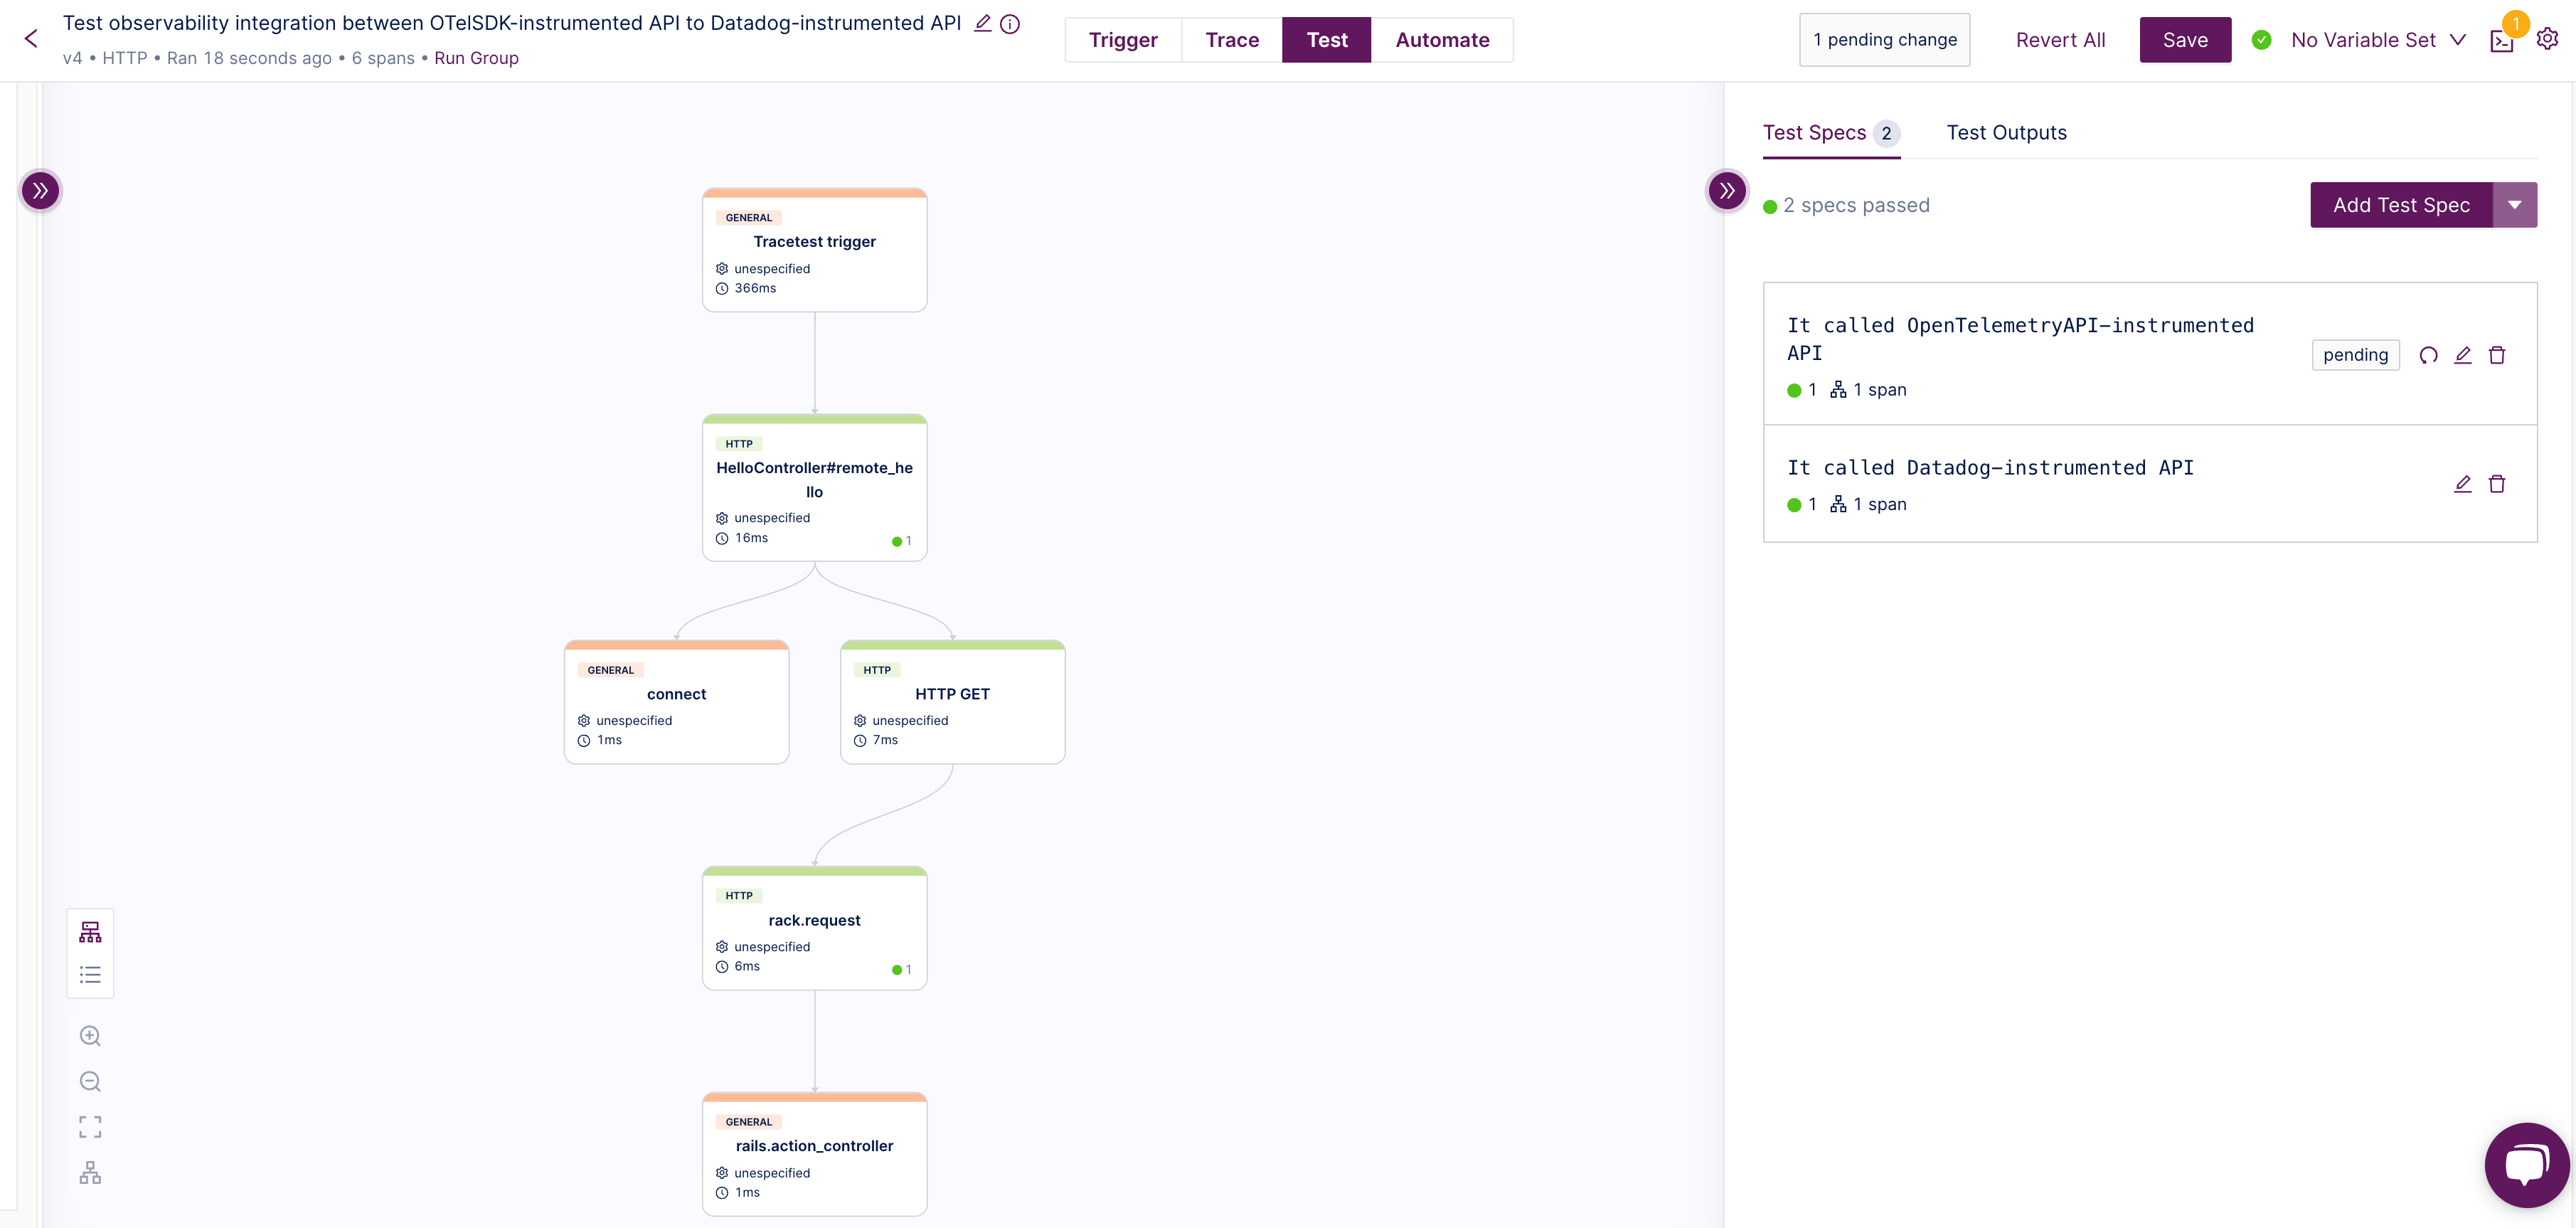
This test will call our API internally from our Docker Compose network at the endpoint `http://api-otel:8080/remotehello` , as specified in `trigger` section, and will validate if there are two spans on the resulting trace for this operation with two `specs`:
- One that checks if there is an `http` span called `HelloController#remote_hello` with status code `200` , defined on the first `selector` item, validating if the `OpenTelemetryAPI-instrumented API has been called` .
- Another that checks if there is an `http` span called `rack.request` with status code `200` , defined on the first `selector` item, validating if the `Datadog-instrumented API has been called` .
We can run the test with the command `tracetest run test -f ./tracebased-tests/test_integration.yaml` and see everything working:
```bash
> tracetest run test -f ./tracebased-tests/test_integration.yaml
# It returns the following output
# ✔ RunGroup: #mDjJ2ZPIR (https://app.tracetest.io/organizations/ttorg_000000000/environments/ttenv_000000000/run/mDjJ2ZPIR)
# Summary: 1 passed, 0 failed, 0 pending
# ✔ Test observability integration between OTelSDK-instrumented API to Datadog-instrumented API (https://app.tracetest.io/organizations/ttorg_1cbdabae7b8fd1c6/environments/ttenv_cfbdc98ade85ac15/test/CdhJp_xIR/run/4/test) - trace id: 64af63b48c2895fc1f91b811ef1d0ca3
# ✔ OpenAPI-instrumented API has been called
# ✔ Datadog-instrumented API has been called
```
We can see this result in Tracetest UI to see the entire trace:
## Final Remarks
We have discussed integrating Datadog-instrumented apps in an OpenTelemetry stack. We saw the problem of different TraceID representations for Datadog and OpenTelemetry, which can lead to disjointed traces. To solve that, we used an OpenTelemetry Collector with a `transform` processor to reconstruct the TraceID for Datadog spans, facilitating a unified tracing environment.
Additionally, we can use trace-based tests with Tracetest to automate the validation of these changes on the observability stack and ensure that the application works as intended.
As a team focused on building an open source tool in the observability space, the opportunity to help the overall OpenTelemetry community is important to us. That’s why we are researching and finding new ways of collecting traces from different tools and frameworks and making them work with the OpenTelemetry ecosystem.
The [example sources](https://github.com/kubeshop/tracetest/tree/main/examples/datadog-propagation) used in this article and [setup instructions](https://github.com/kubeshop/tracetest/blob/main/examples/datadog-propagation/README.md) are available in the Tracetest GitHub repository.
Would you like to learn more about Tracetest and what it brings to the table? Visit the Tracetest [docs](https://docs.tracetest.io/getting-started/installation) and try it out by [signing up today](https://app.tracetest.io)!
Also, please feel free to join our [Slack Community](https://dub.sh/tracetest-community), give [Tracetest a star on GitHub](https://github.com/kubeshop/tracetest), or schedule a [time to chat 1:1](https://calendly.com/ken-kubeshop/45min).
.jpg)
.avif)
.avif)