
Honeycomb + Tracetest: Observability-driven Development
.avif)

Taking observability-driven development to new heights by leveraging Honeycomb's powerful pattern detection + Tracetest's trace-based testing techniques.
Table of Contents
Tracetest now works with Honeycomb! With Honeycomb, you can find patterns and outliers of how users experience your code in complex and unpredictable environments. Integrating Tracetest will accelerate your [observability-driven development](https://www.infoq.com/articles/observability-driven-development/) even more by allowing you to build tests in minutes based on your observability data that fully test your distributed system before pushing new code into production.
> *Check out [this hands-on example](https://github.com/kubeshop/tracetest/tree/main/examples/tracetest-honeycomb) of how Tracetest works with Honeycomb, or check out [the recipe in the docs](https://docs.tracetest.io/examples-tutorials/recipes/running-tracetest-with-honeycomb)!*
## What is Honeycomb?
[Honeycomb](https://www.honeycomb.io/) is an observability platform for distributed services. It helps you find your most perplexing application issues.
Honeycomb is designed for high-performance engineering. It enables you to quickly interpret the billions of rows of data required to fully represent the user experience in your complex, unpredictable systems. Utilizing Honeycomb leads to better uptime, higher-quality and faster user experiences, more time for innovation, and ultimately better business outcomes - all hallmarks of high-performance engineering teams.
Honeycomb began with and is a proponent of distributed traces as the most important observability signal.
## What is Tracetest?
[Tracetest](https://tracetest.io/) is an [open-source project, part of the CNCF landscape](https://github.com/kubeshop/tracetest). It allows you to quickly build integration and end-to-end tests, powered by your distributed traces.
Tracetest uses your existing distributed traces to power trace-based testing with assertions against your trace data at every point of the request transaction. You only need to point Tracetest to your existing trace data source or send traces to Tracetest directly!
Tracetest makes it possible to:
- Define tests and assertions against every single microservice that a trace goes through.
- Work with your existing distributed tracing solution, allowing you to build tests based on your already instrumented system.
- Define multiple transaction triggers, such as a GET against an API endpoint, a GRPC request, etc.
- Define assertions against both the response and trace data, ensuring both your response and the underlying processes worked correctly, quickly, and without errors.
- Save and run the tests manually or via CI build jobs with the Tracetest CLI.
## Tracetest + Honeycomb Integration
Tracetest now integrates with Honeycomb, providing powerful observability capabilities. You can also leverage your distributed traces to run trace-based tests with Tracetest.
If you already have OpenTelemetry instrumentation configured in your code and are using OpenTelemetry Collector with Honeycomb as a trace data store for observability, adding Tracetest to your infrastructure can enable you to write detailed trace-based tests using your existing tracing infrastructure.
### Why is the Tracetest integration with Honeycomb important?
When running integration tests, you have no way of knowing precisely at which point an HTTP transaction goes wrong in a network of microservices! With tracing enabled, Tracetest can run tests with assertions against existing trace data throughout every service in the entire transaction. You can utilize these tests as part of your CI/CD process to ensure system functionality and to catch regressions.

You can enhance your testing process by using Tracetest to create tests and Honeycomb to analyze test results over time. With Honeycomb, you can track test runs and correlate corresponding services over time, giving you insights into system performance and highlighting the impact of changes on performance.
Issues identified when exploring trace data via Honeycomb can be used as good candidates for new tests or assertions within Tracetest. This creates a cycle of continuous improvement.
## Try Tracetest with Honeycomb
First, you need to have a Honeycomb account. Create [your free account here](https://ui.honeycomb.io/signup). Next, you need to have your distributed application instrumented with OpenTelemetry and configured to [send trace data to Honeycomb](https://docs.honeycomb.io/quickstart/#step-3-instrument-your-application-to-send-telemetry-data-to-honeycomb). Check out the official docs for more on getting started with Honeycomb and OpenTelemetry. Once you have your system sending trace data to Honeycomb, you are ready to set up Tracetest!
### Install Tracetest
Tracetest is open-source and easy to install. Start by installing the Tracetest CLI:
```bash
brew install kubeshop/tracetest/tracetest
```
> *Note: Check out the download page for more info.*
From here, follow the [official documentation](https://docs.tracetest.io/getting-started/installation) to install the Tracetest server. Once the server is installed, open Tracetest Web UI in the browser and follow the instructions for connecting the [OpenTelemetry Collector](https://opentelemetry.io/docs/collector/) for Tracetest and Honeycomb.
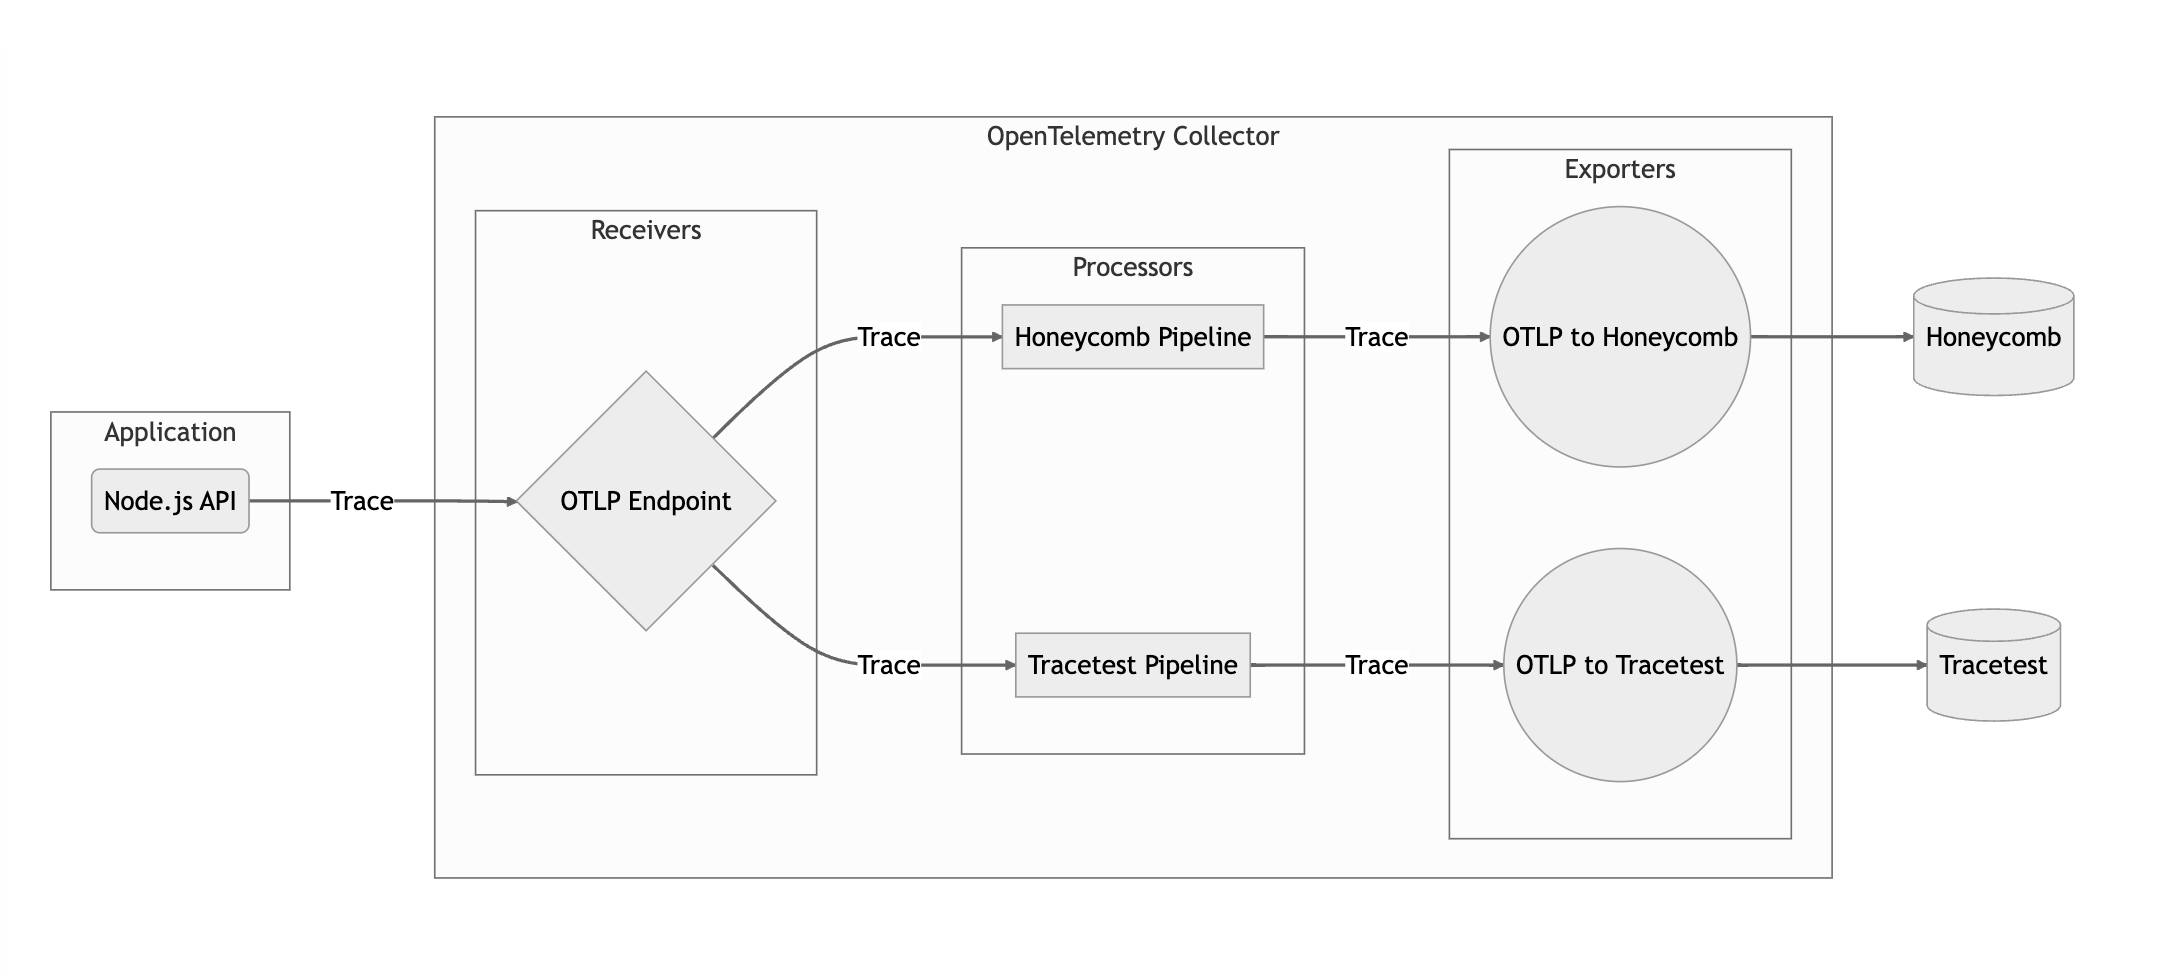
The [Collector](https://opentelemetry.io/docs/collector/) is the recommended way to send OpenTelemetry data to an observability back-end, including Honeycomb. It is a highly-configurable binary that allows you to ingest, process, and export OpenTelemetry data.
Enabling the Tracetest/Honeycomb integration is as simple as selecting Honeycomb as your trace data store and add dedicated pipelines that send traces to both Tracetest and Honeycomb in your OpenTelemetry Collector configuration.
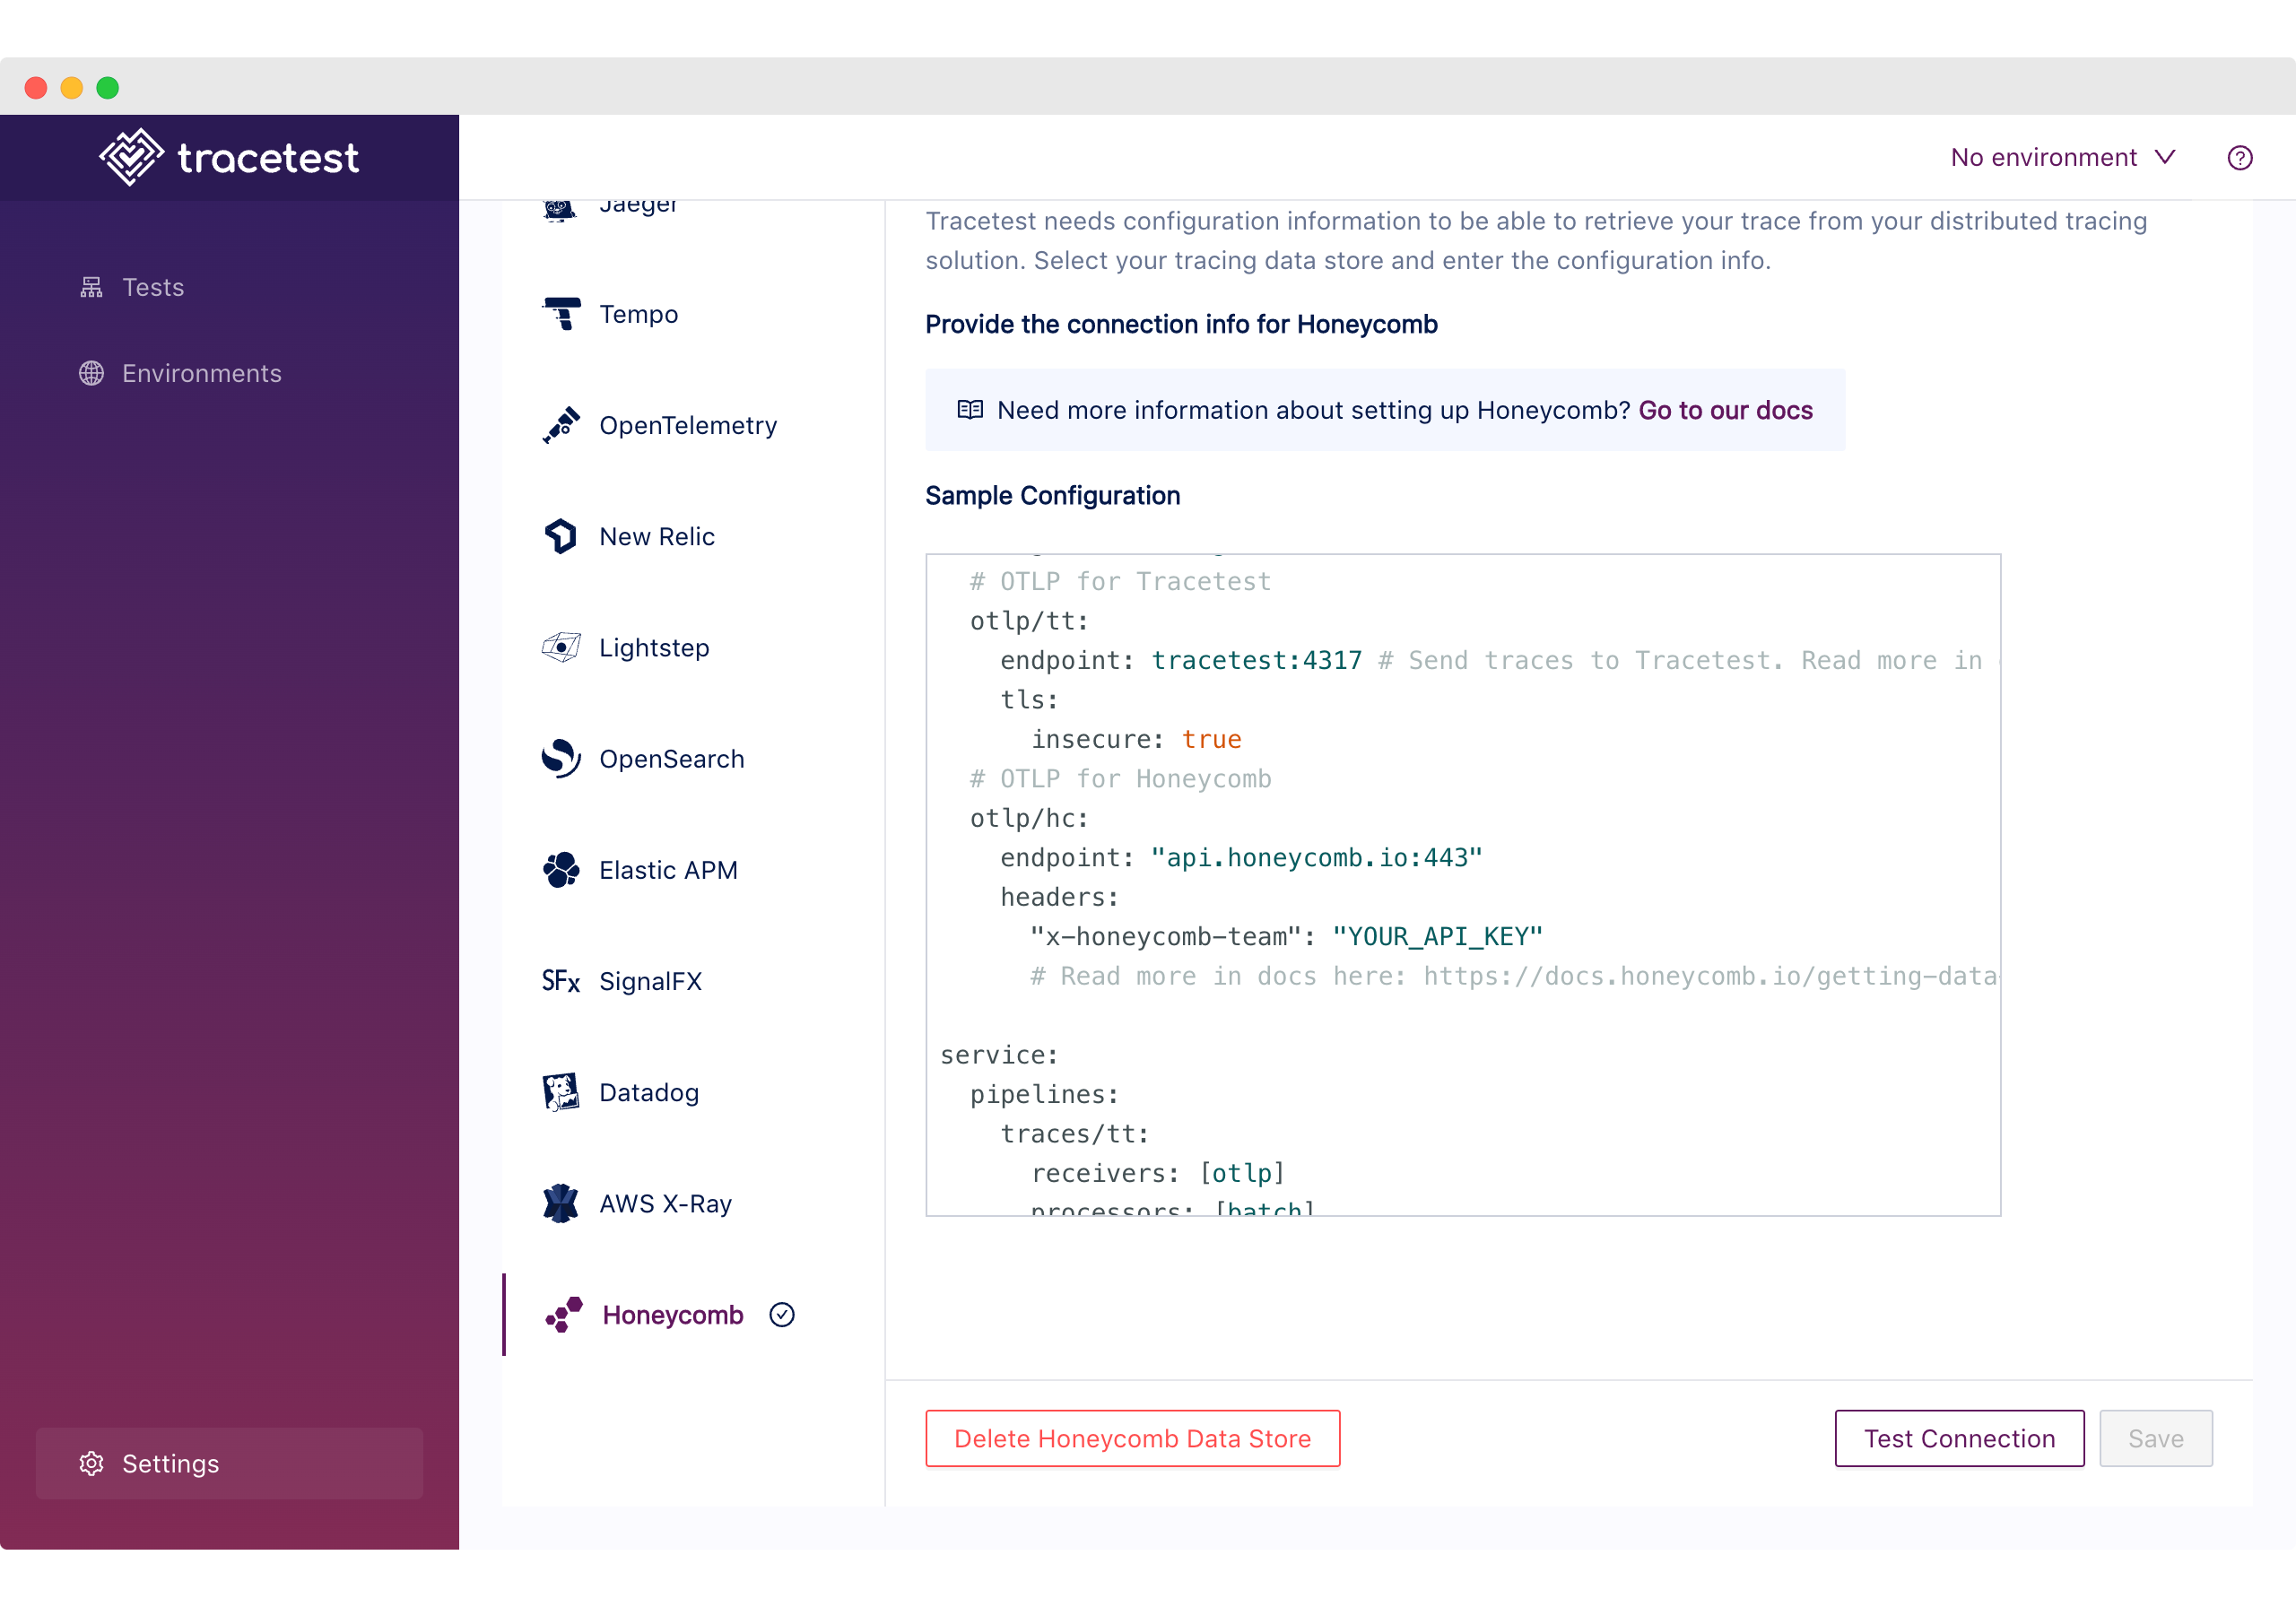
Copy this OpenTelemetry Collector configuration and paste it into your configuration file.
```yaml
receivers:
otlp:
protocols:
grpc:
http:
processors:
batch:
timeout: 100ms
exporters:
logging:
logLevel: debug
# OTLP for Tracetest
otlp/tracetest:
endpoint: tracetest:4317 # Send traces to Tracetest.
tls:
insecure: true
# OTLP for Honeycomb
otlp/honeycomb:
endpoint: "api.honeycomb.io:443"
headers:
"x-honeycomb-team": "YOUR_API_KEY"
service:
pipelines:
traces/tracetest:
receivers: [otlp]
processors: [batch]
exporters: [otlp/tracetest]
traces/honeycomb:
receivers: [otlp]
processors: [batch]
exporters: [logging, otlp/honeycomb]
```
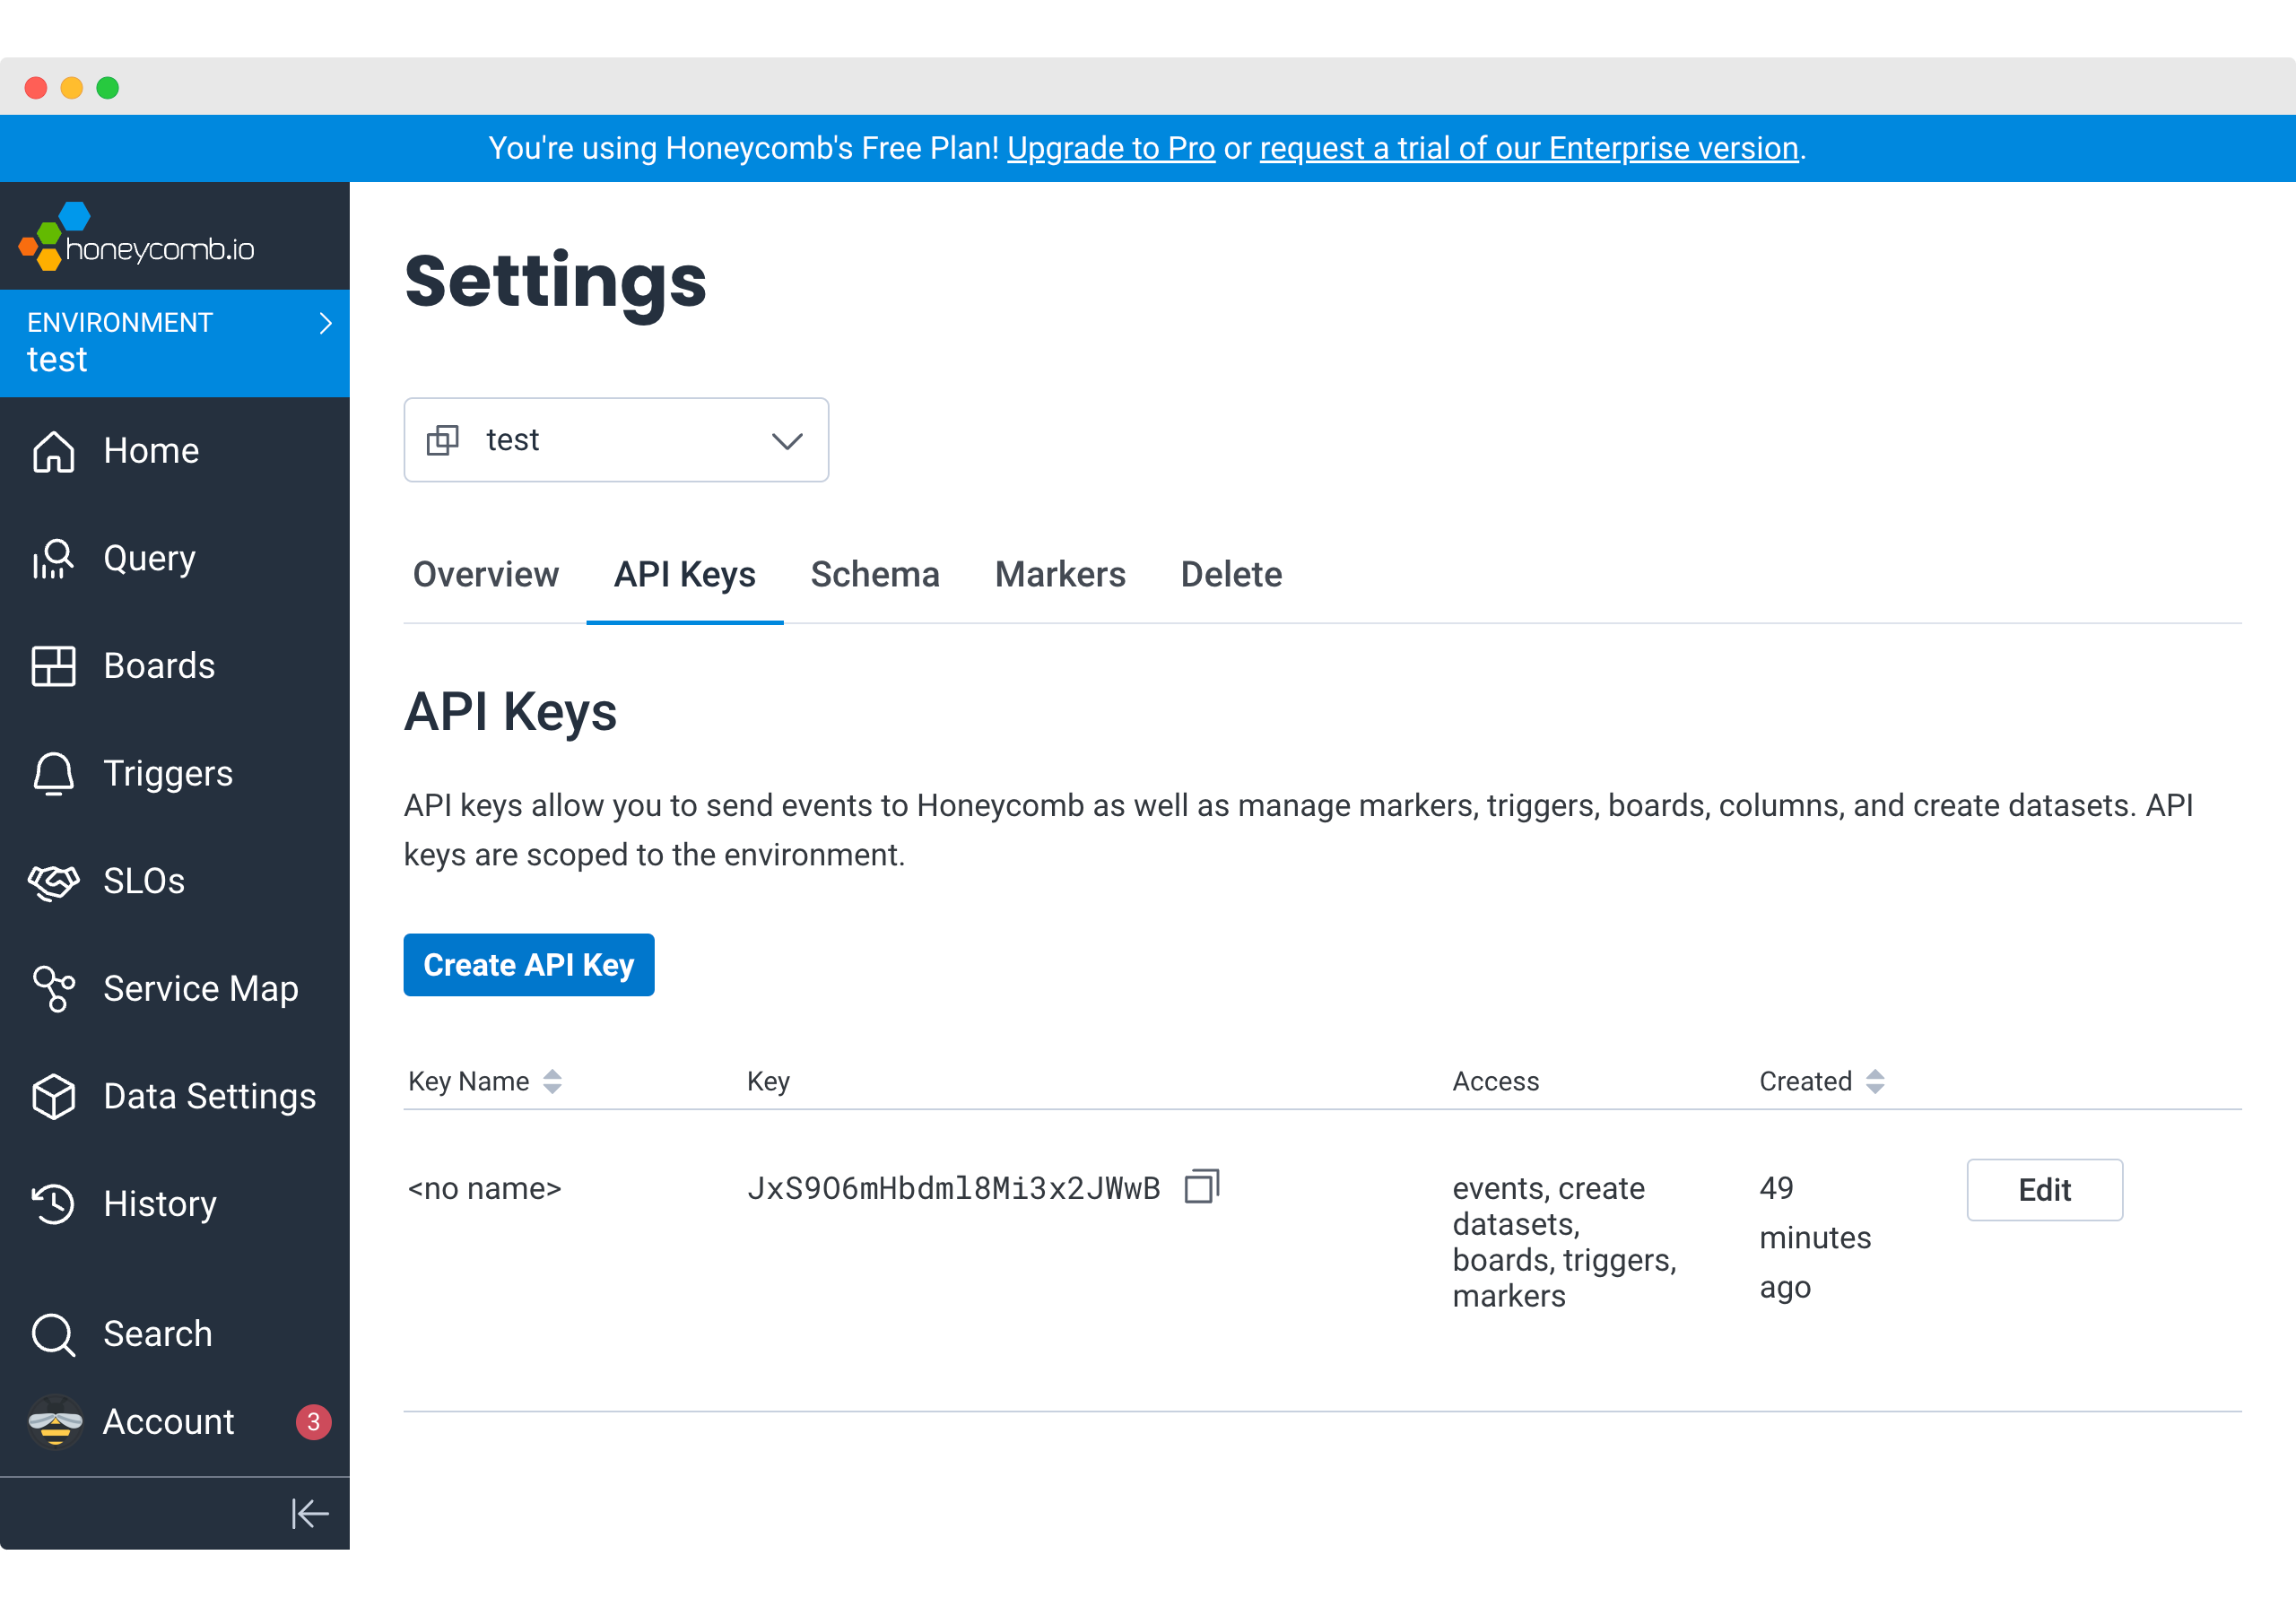
Next, edit the config to include your [Honeycomb API key](https://docs.honeycomb.io/working-with-your-data/settings/api-keys/#manage-api-keys).
Please see the [official Honeycomb docs](https://docs.honeycomb.io/getting-data-in/otel-collector/) for more info on configuring Honeycomb to ingest data from the OpenTelemetry Collector.
### Create a Trace-based Test in Tracetest
For this example, I’ll use the [official example app for Tracetest and Honeycomb](https://github.com/kubeshop/tracetest/tree/main/examples/tracetest-honeycomb).
To quickly access the example, you can run the following:
```bash
git clone https://github.com/kubeshop/tracetest.git
cd tracetest/examples/tracetest-honeycomb/
docker compose up --build
```
Make sure to add your API key as shown in the section above.
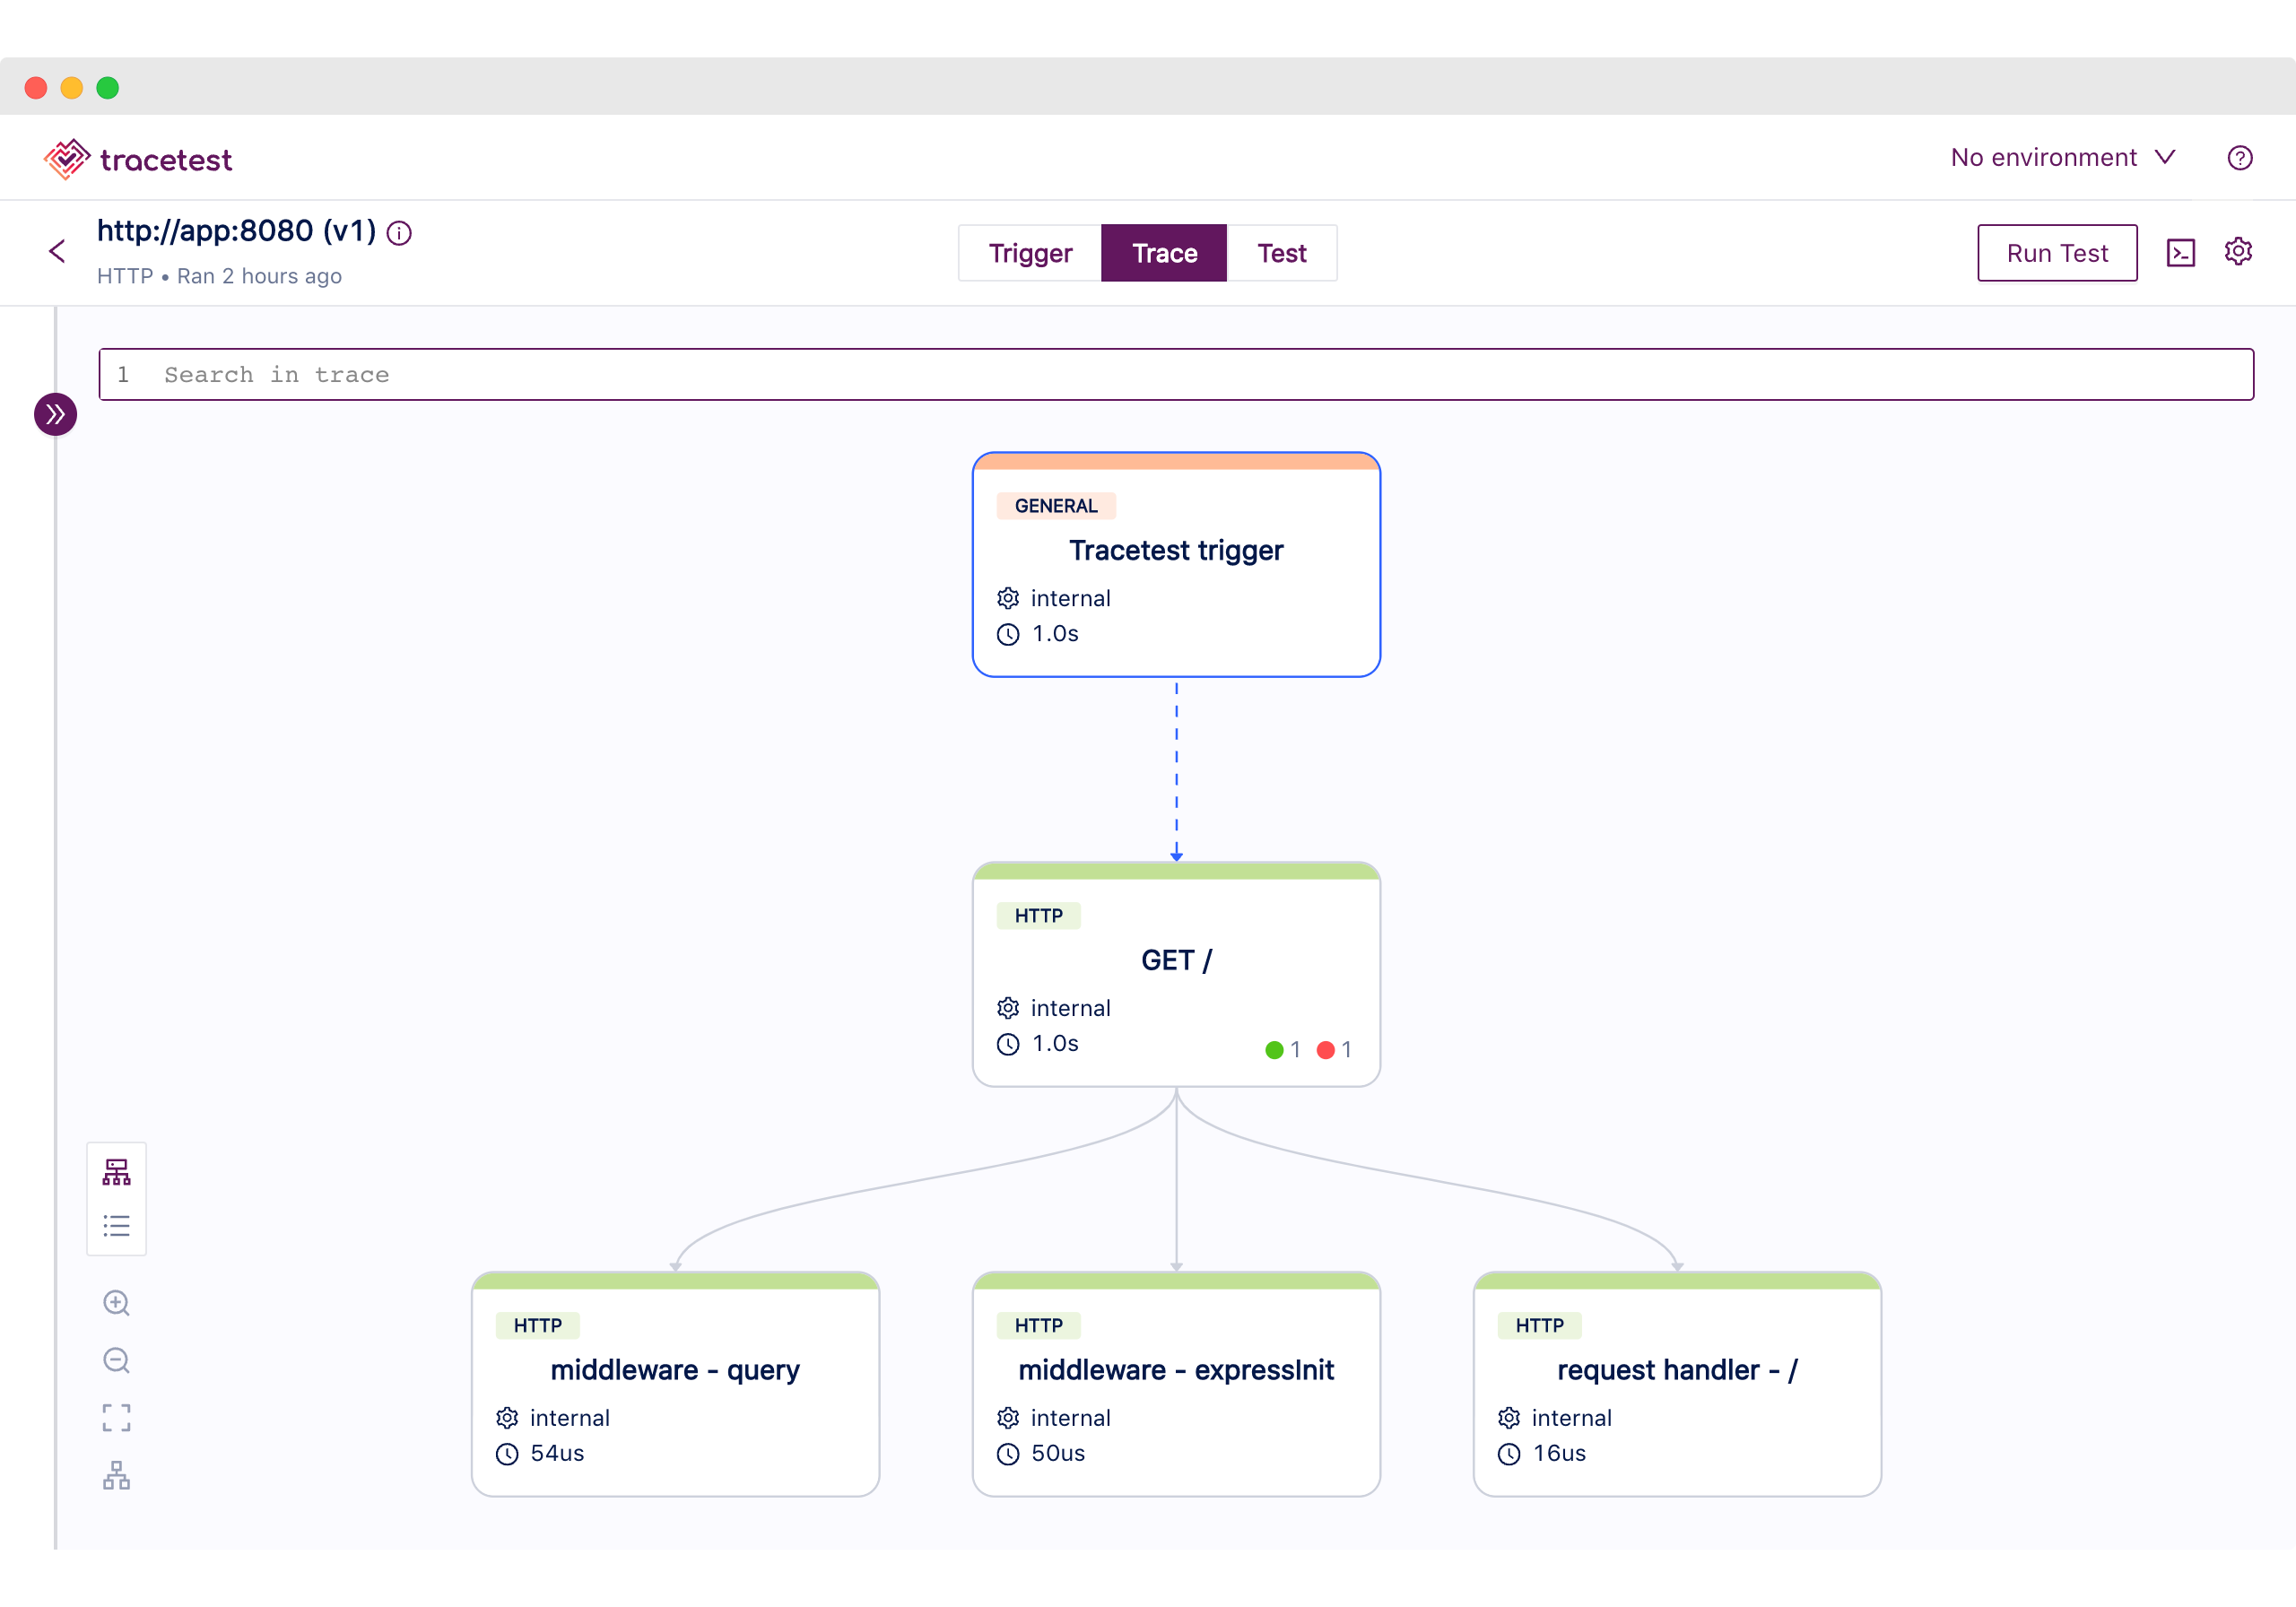
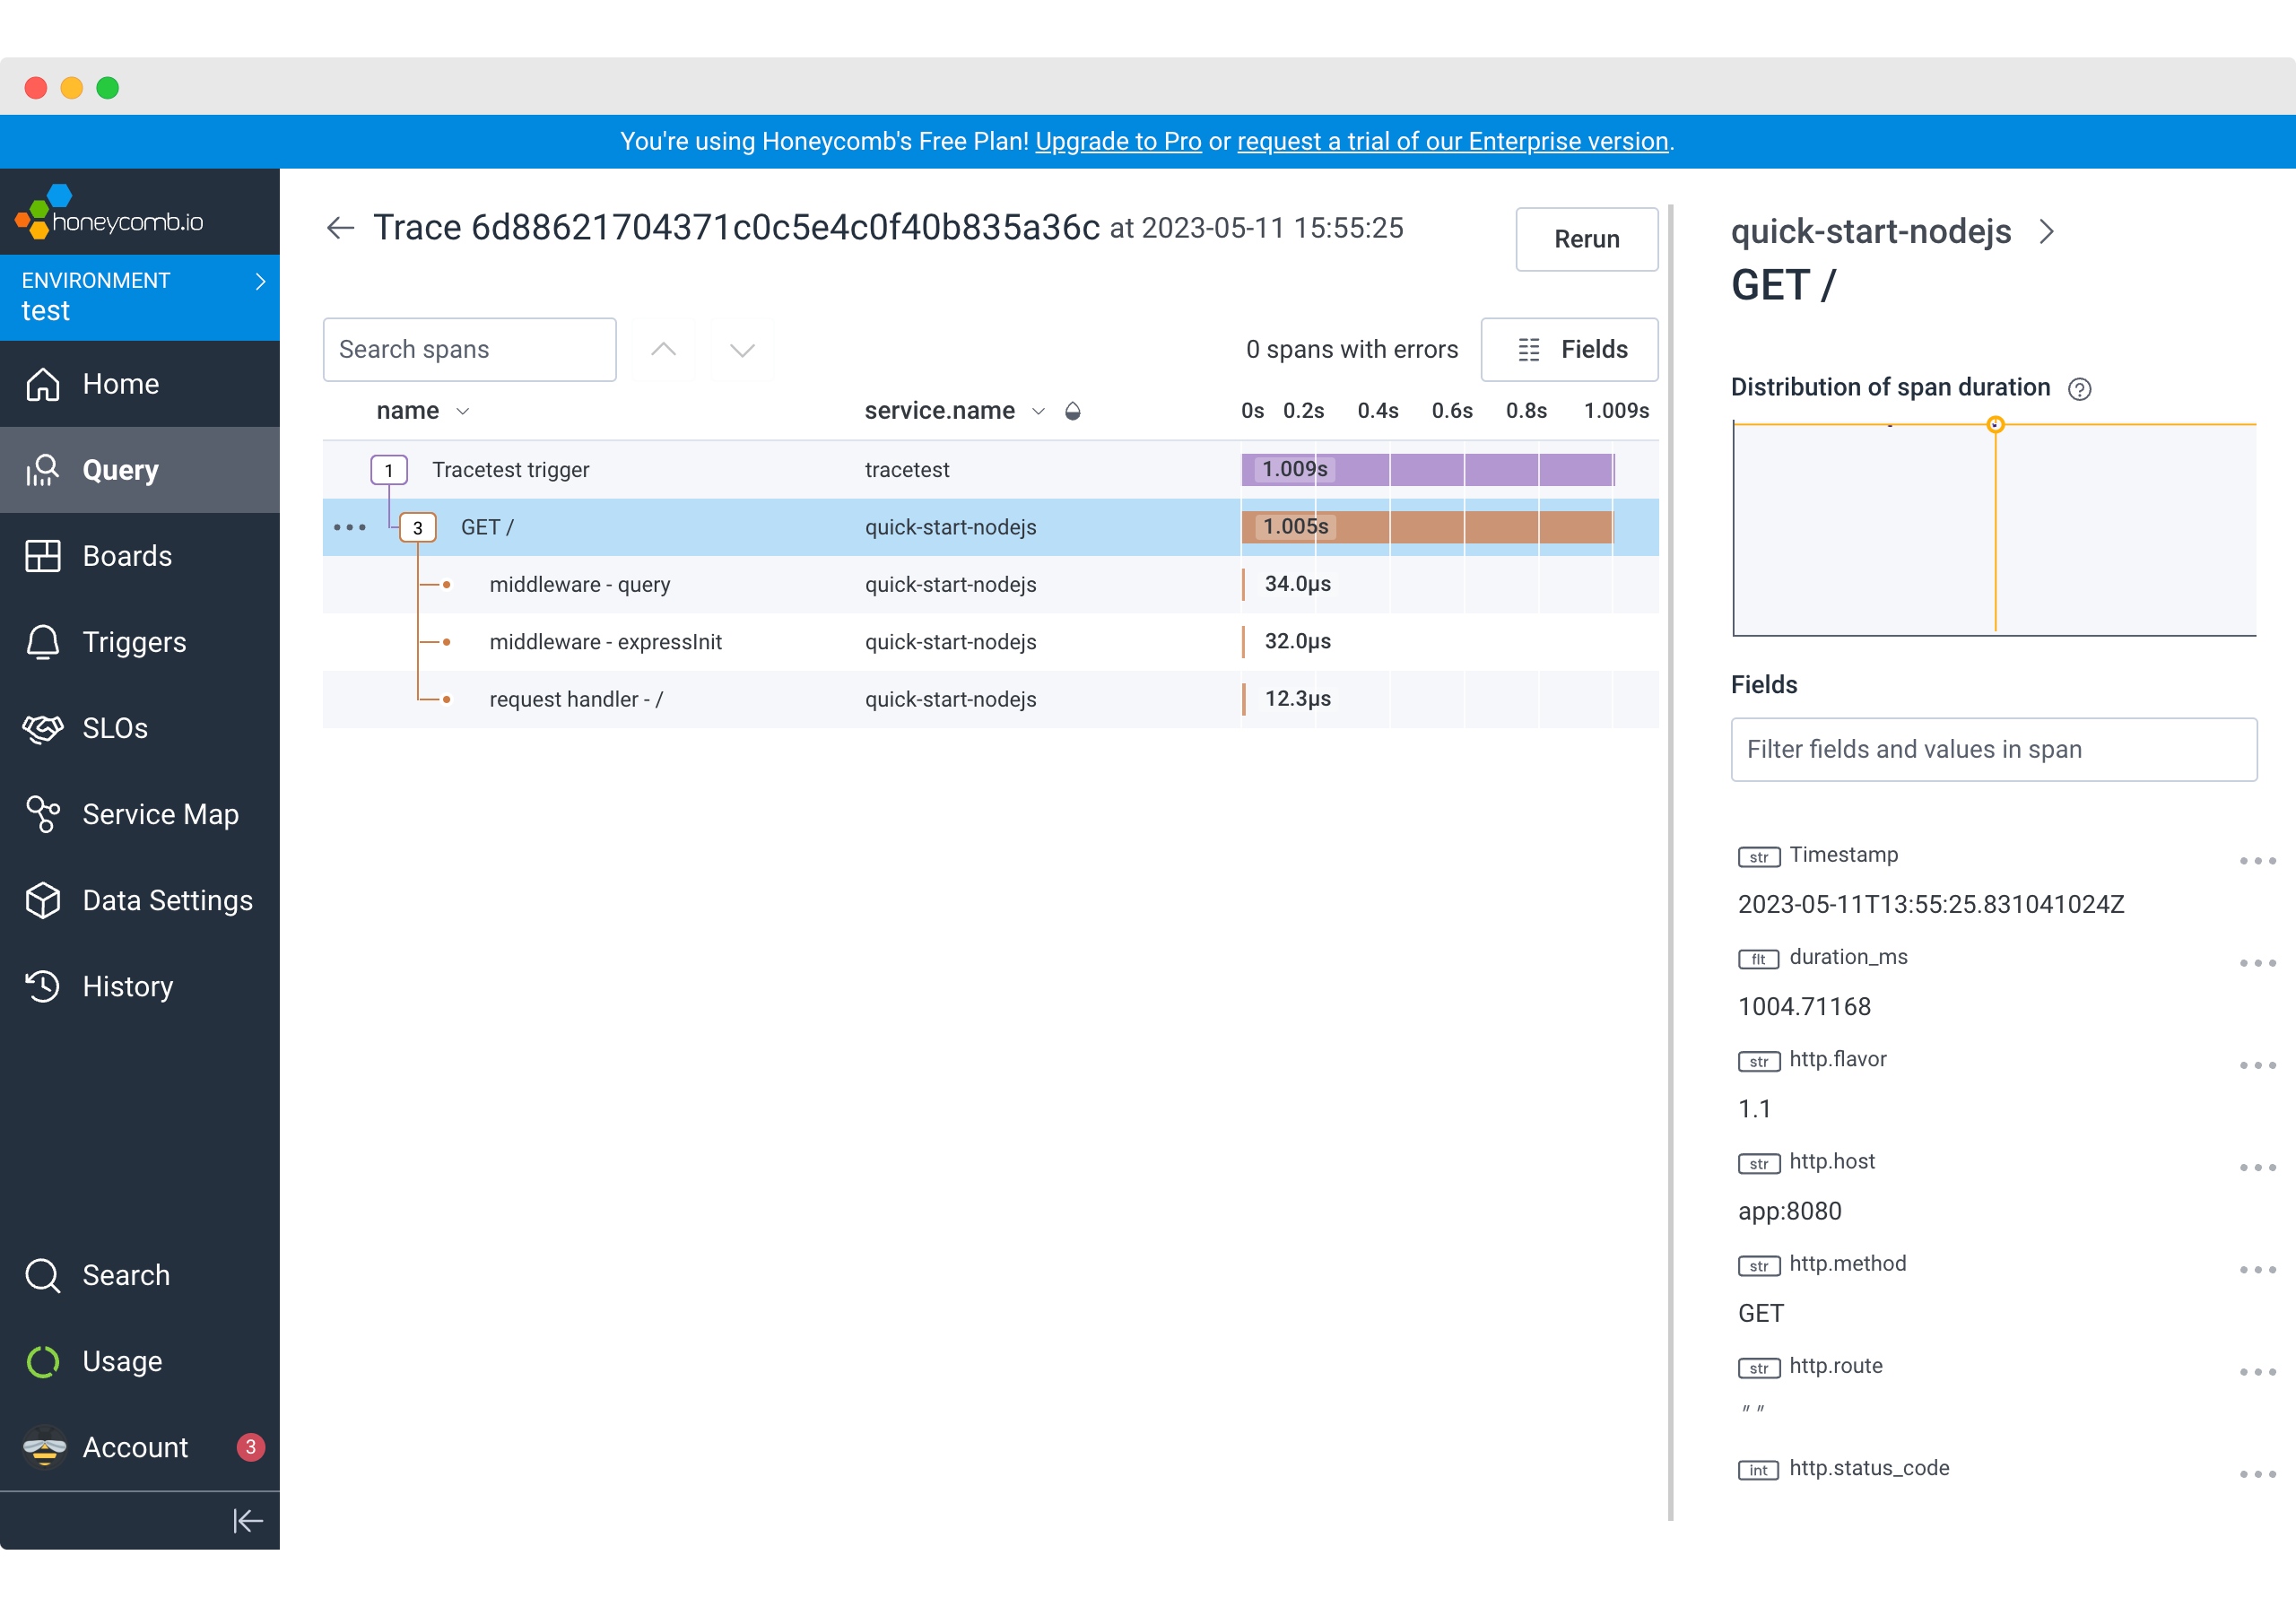
To create a test in Tracetest, start by clicking `Create` > `Create New Test` > `HTTP Request` > `Next` > Add a name for your test > `Next` > The URL field should be `http://app:8080` > `Create and Run`.
This will trigger the test and display a distributed trace in the `Trace` tab to run assertions against.
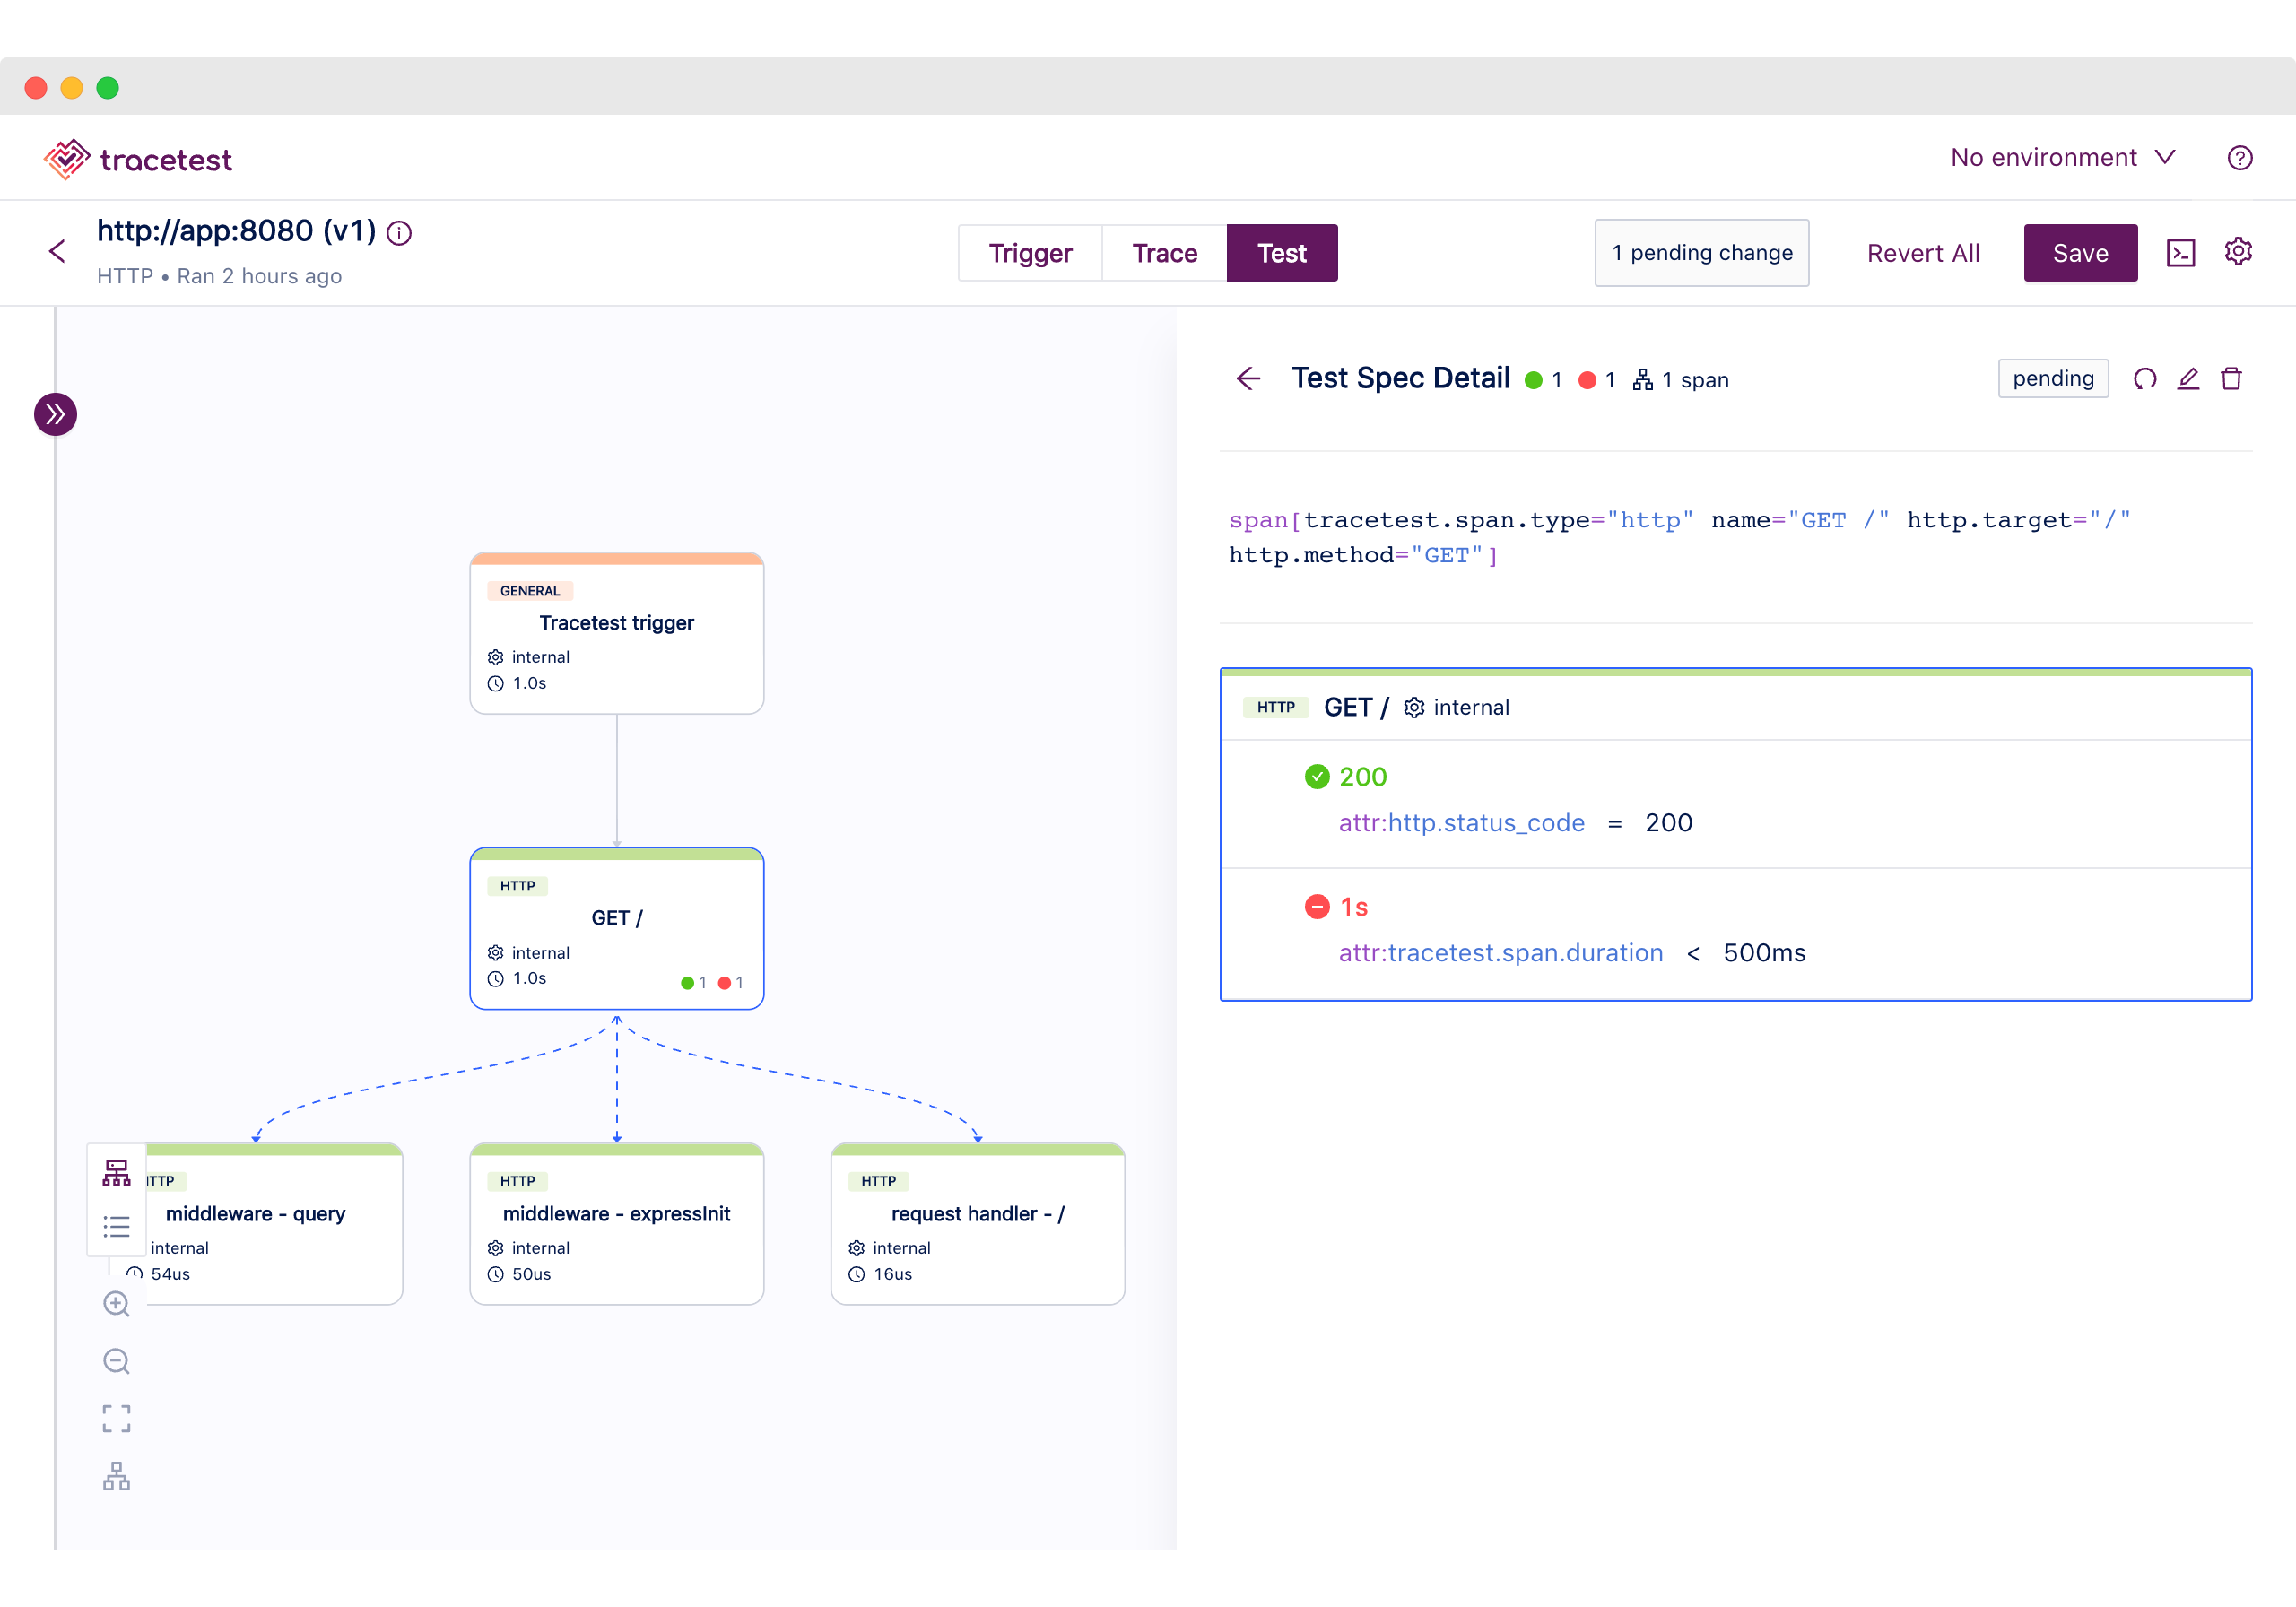
Proceed to add a test spec to assert all database queries return within `500 ms`. Click the `Test` tab and proceed to click the `Add Test Spec` button.
In the span selector, make sure to add this selector:
```css
span[tracetest.span.type="http" name="GET /" http.target="/" http.method="GET"]
```
In the assertion field add:
```css
attr:http.status_code = 200
attr:tracetest.span.duration < 500ms
```
Save the test spec and publish the test.
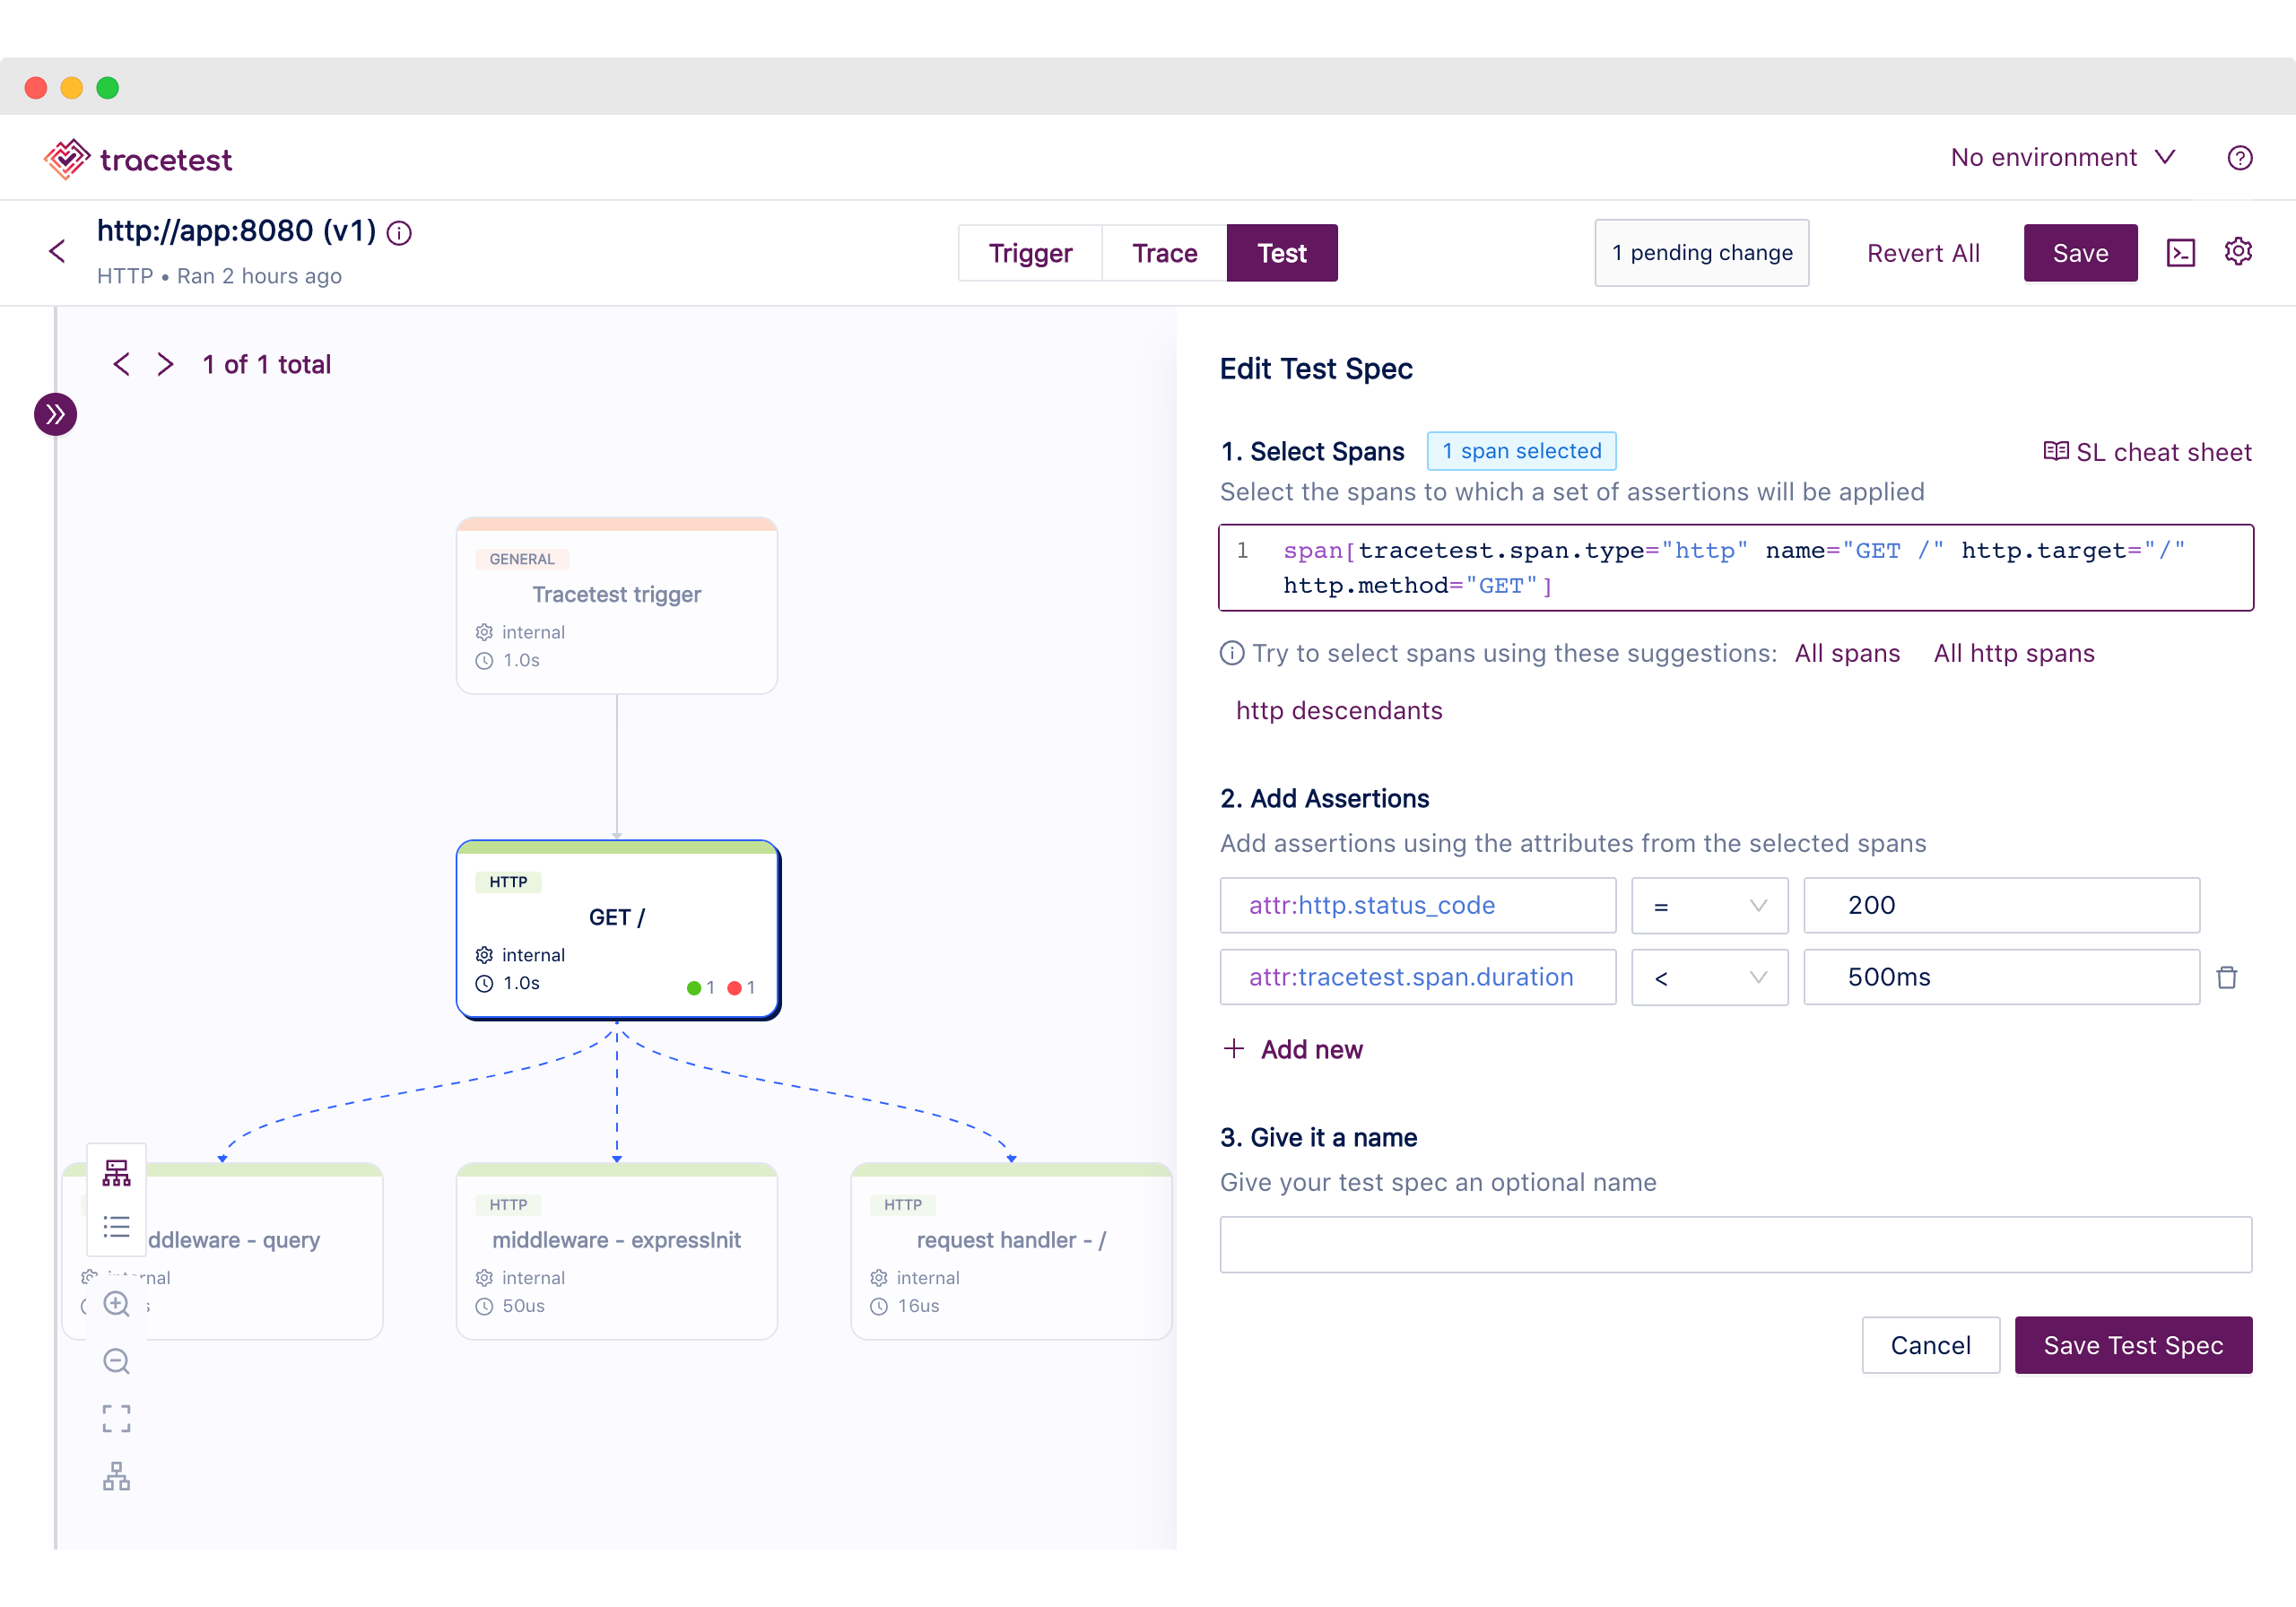
The `http` span is returning in more than `500ms` and will be labeled in red.

This is an example of a trace-based test that can assert against every single part of an HTTP transaction, including external API calls.
However, Tracetest cannot give you a historical overview of all test runs. Let's introduce how Honeycomb makes it possible.
### Monitor Trace-based Tests over Time with Honeycomb
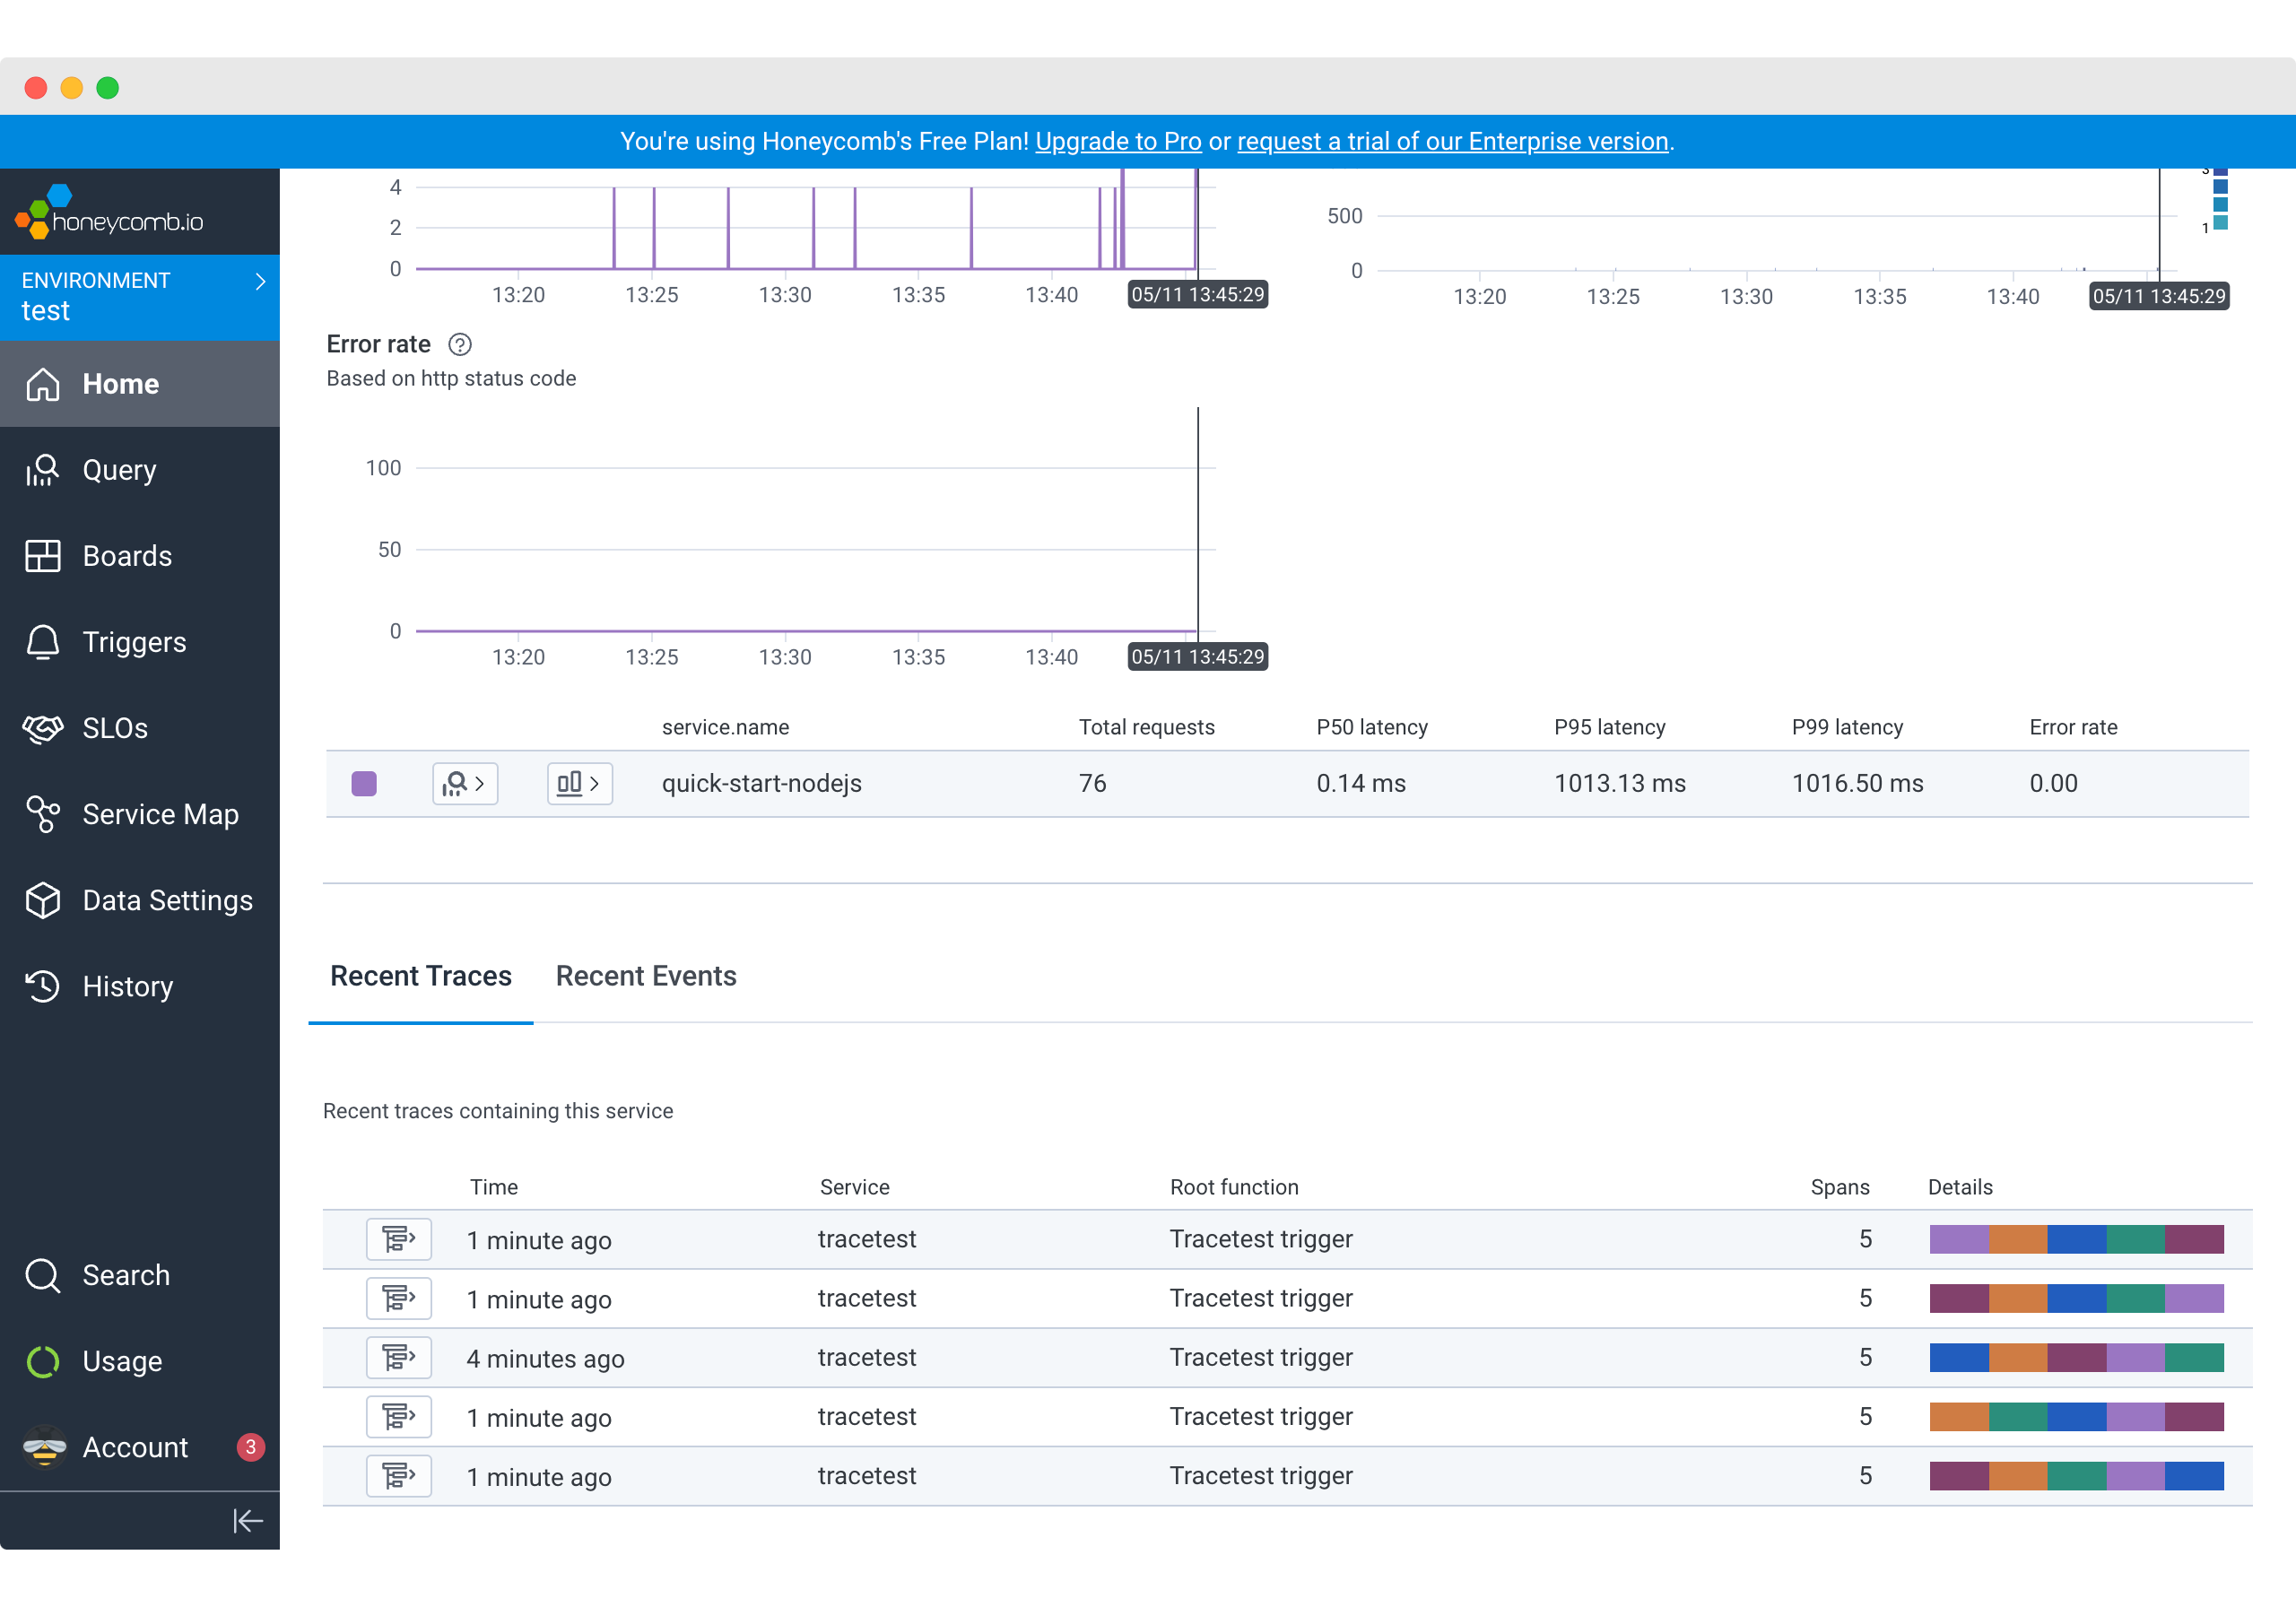
Because you are using two pipelines in the OpenTelemetry collector, all traces your distributed system generates will be stored in Honeycomb. Additionally, if you configure the Tracetest server with [Telemetry](https://docs.tracetest.io/configuration/telemetry), you will see the traces the Tracetest server generates as well.
This will give you insight into every test run! Here’s a board you can create to track P99 for the response time of a Tracetest test run shown over time and compared in 2-hour intervals.
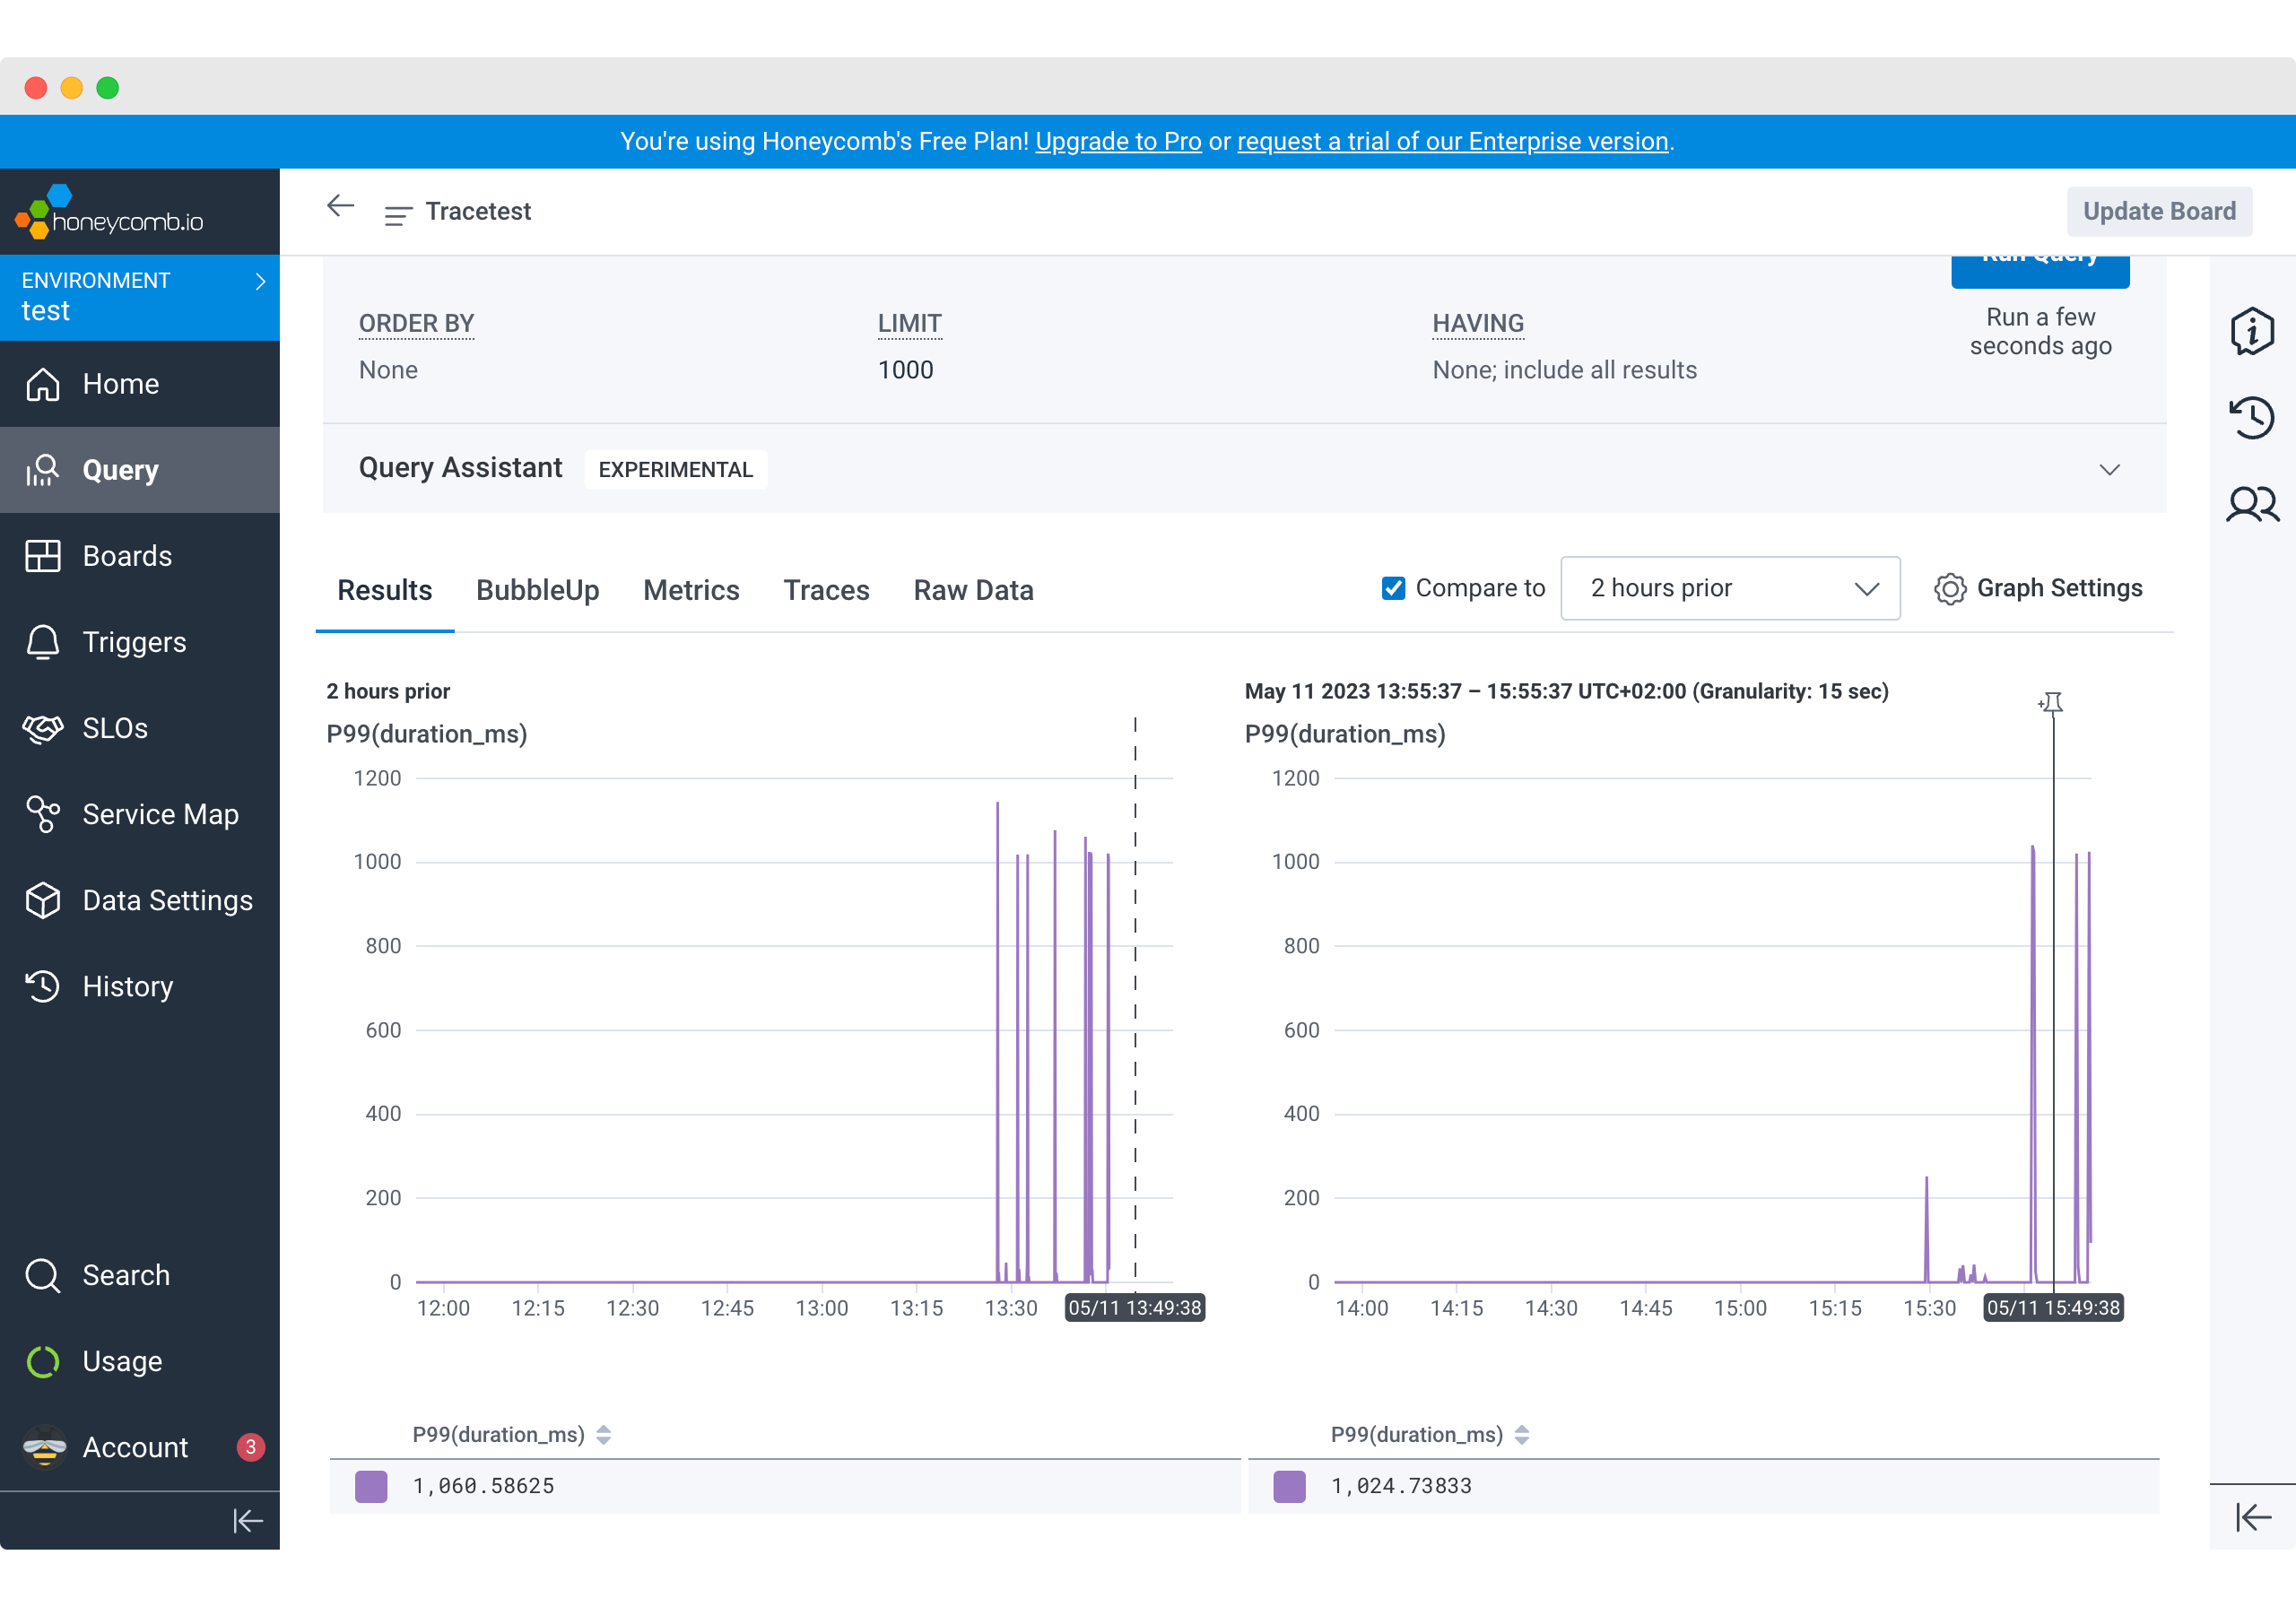
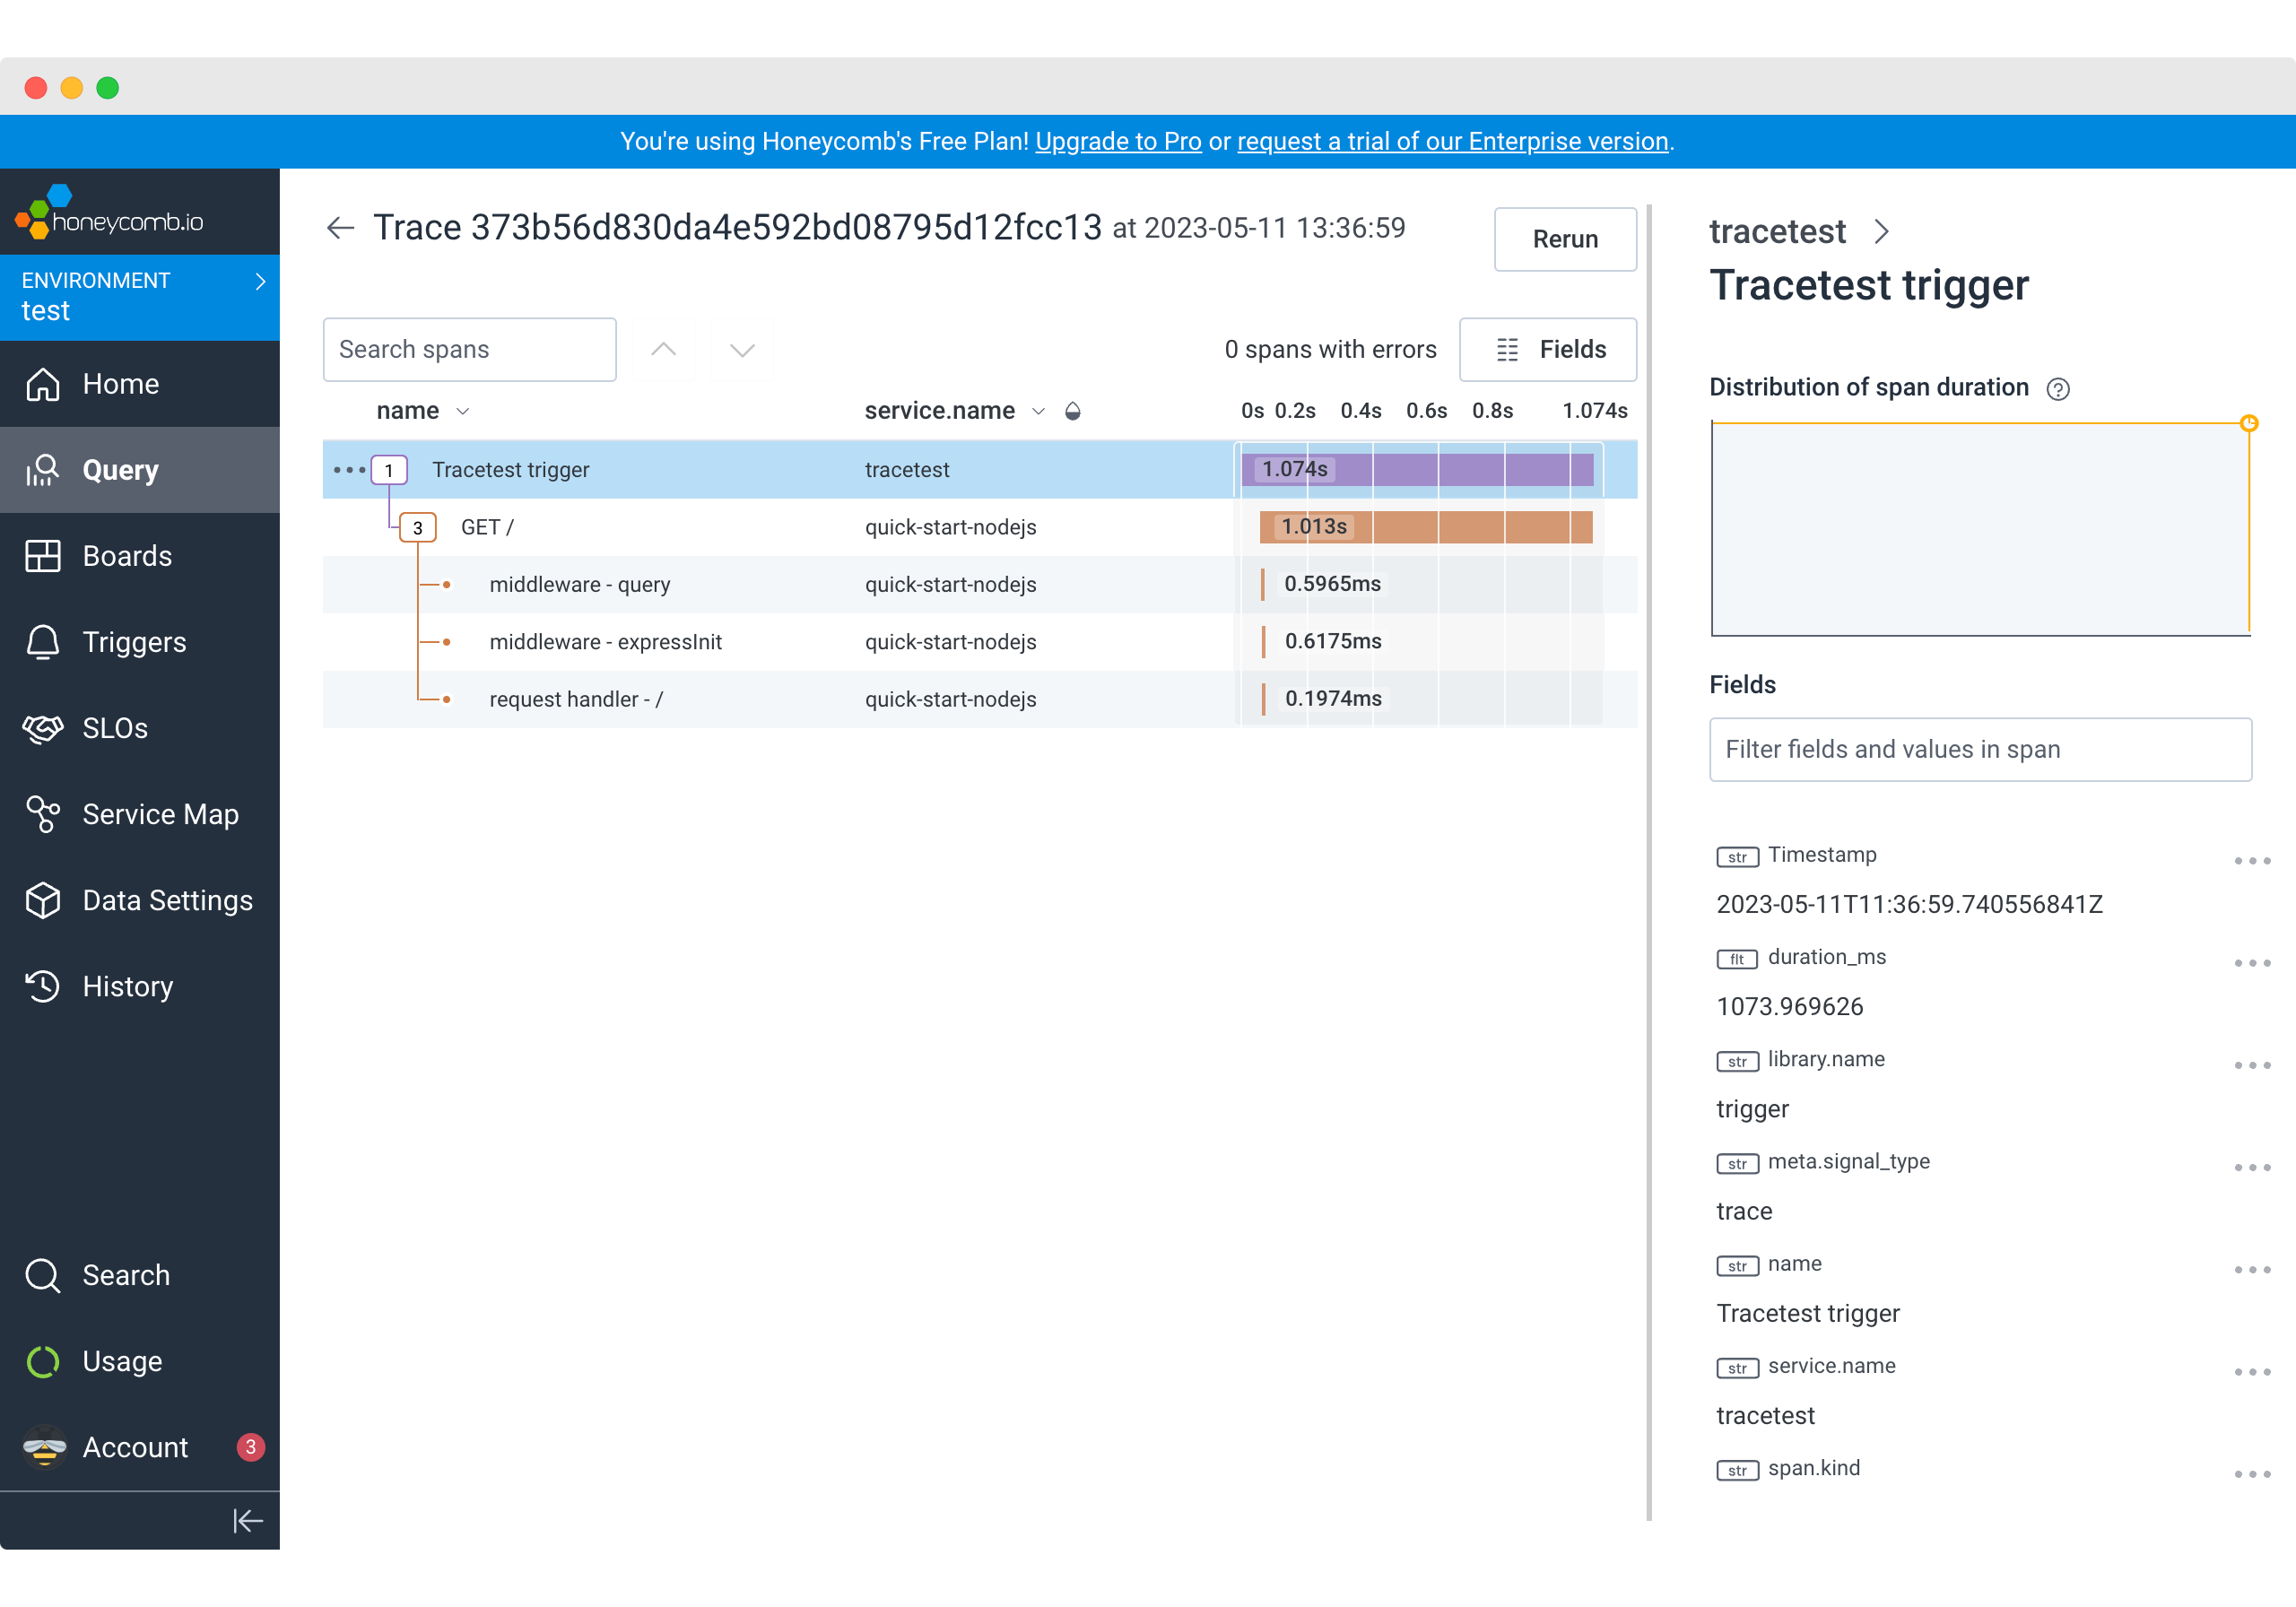
By changing the dataset, you can get the same insight into the sample app. But, the key feature would be drilling down into the specific trace for troubleshooting.
## What's next?
Tracetest provides detailed distributed trace data, allowing you to gain insight into the behavior of your application at a granular level and ultimately create assertions against this data to write bullet-proof tests. Honeycomb provides observability and granular insight over time, where you can monitor your distributed applications and track Tracetest test run behavior over time!
Would you like to learn more about Tracetest and what it brings to the table? Check the [docs](https://docs.tracetest.io/examples-tutorials/recipes/running-tracetest-with-lightstep/) and try it out today by [downloading](https://tracetest.io/download) it today!
Also, please feel free to join our [Slack community](https://dub.sh/tracetest-community), give [Tracetest a star on GitHub](https://github.com/kubeshop/tracetest), or schedule a [time to chat 1:1](https://calendly.com/ken-kubeshop/otel-user-interview-w-tracetest?month=2023-05).
.jpg)
.avif)
.avif)