
GitHub Actions + Observability + Slack: Synthetic API Tests
.avif)

Simulate user transactions by setting up synthetic monitoring for your API with Github Actions, Slack and Tracetest.
Table of Contents
Synthetic monitoring is a useful technique that allows you to simulate user transactions executed against your application. This helps you monitor critical API endpoints across different layers of your systems, alerting you to any failure. By proactively testing the API at regular intervals, you can quickly detect issues, investigate them and optimize system performance for your end-users, reducing MTTR.
Characteristics of synthetic monitoring:
- It is highly consistent, simulating user behavior but with a fixed, predictable test.
- It can be run on a scheduled basis and/or as part of a CI/CD process.
- It can be run in “pre-production”.
- It is typically tied to an alerting mechanism to inform the team of failures.
Let’s see how we can use existing, commonly available tooling to build our own synthetic monitoring alerts to cover an API back end.
## Using GitHub Actions to Simulate Synthetic Monitoring
Every major CI environment, including GitHub Actions, is capable of scheduling jobs. In GitHub Actions, we can schedule a workflow by using the `on.schedule` attribute and provide a `cron` expression to configure how often we want our job to run. If you are not sure how to use `cron`, you can use [generators](https://www.freeformatter.com/cron-expression-generator-quartz.html) to write the expression for you.
Secondly, we need a test framework to rely on. Traditionally, API synthetic monitoring tools have been limited to conducting simple black box tests. While effective when testing monolithic, synchronous applications, these black box tools are limited in their ability to test deeply across the entire flow triggered by an API call. They do not provide much confidence when building tests against modern, distributed, cloud-native architectures such as microservices or Lambda/FaaS-based systems.
Luckily, there is a way to utilize observability tools, namely distributed tracing, that are relied on by these complex systems to also empower your testing. The technique is called trace-based testing, and we will be using Tracetest, an open-source tool, to build and run these tests.
> For this article, we are considering that you already have a Tracetest instance running either on your CI environment or deployed somewhere. We are also using the sample [Pokeshop application](https://github.com/kubeshop/pokeshop) as the system under test. You will see an option to install it when [installing Tracetest](https://docs.tracetest.io/getting-started/detailed-installation#3-select-a-default-installation-or-an-installation-with-sample-app). If you don’t have Tracetest running yet, check out our [installation guide](https://docs.tracetest.io/getting-started/installation/), [recipes](https://docs.tracetest.io/examples-tutorials/recipes), and [examples](https://github.com/kubeshop/tracetest/tree/main/examples).
Finally, we need a way to send alerts when tests fail. For this, we will rely on Slack!
## Configure Trace-based Testing with Tracetest in GitHub Actions
What does this Pokeshop application we will be setting up a synthetic monitor for look like? It has two microservices with an asynchronous message queue tying them together. Their jobs are:
- Accept the API call, validate it and put it on a message queue, returning a 200 status code on success.
- The second ‘worker’ microservice gets the request off of the queue and does the ‘real’ work asynchronously.
We want our monitor to validate the full flow, ensuring both services do their jobs. We will be testing a critical API call, a POST to the Pokemon import process. All Pokemon MUST be imported properly!!!
Considering that you already set up your Tracetest instance, let’s start building our synthetic monitoring tool using it. Let’s create a full test that will verify both microservices execute properly:
```yaml
# monitoring/usecases/user_listing_products.yaml
type: Test
spec:
id: 8jEnYSwVg
name: Pokeshop - Import
description: Import a Pokemon
trigger:
type: http
httpRequest:
url: http://demo-pokemon-api.demo/pokemon/import
method: POST
headers:
- key: Content-Type
value: application/json
body: '{"id":52}'
specs:
- name: POST should return status code 200
selector: span[tracetest.span.type="http" name="POST /pokemon/import" http.method="POST"]
assertions:
- attr:http.status_code = 200
- name: Validation step in API microservice should validate properly
selector: span[tracetest.span.type="general" name="validate request"]
assertions:
- attr:validation.isValid = "true"
- name: Import process that pulls message off queue must exist!
selector: span[tracetest.span.type="general" name="import pokemon"]
assertions:
- attr:tracetest.selected_spans.count = 1
- name: External request to pokeapi.co should return 'Meowth'
selector: span[tracetest.span.type="http" name="HTTP GET pokeapi.pokemon" http.method="GET"]
assertions:
- attr:http.response.body| json_path '$.name' = 'meowth'
- name: Should insert into pokeshop postgres DB
selector: span[tracetest.span.type="database" name="pg.query:INSERT pokeshop"
db.system="postgresql" db.name="pokeshop" db.user="ashketchum"]
assertions:
- attr:tracetest.selected_spans.count = 1
```
We have 2 test specifications covering the first microservice:
- POST should return status code 200.
- Validation step in API microservice should validate properly.
And 3 test specifications covering the second “worker” microservice:
- Import process that pulls a message off the queue must exist!
- External request to `pokeapi.co` should return `Meowth`.
- Should insert into the `pokeshop` Postgres database.
Now that we have our test, let’s make it run in a GitHub Actions workflow:
```yaml
# This example illustrates how you can use Tracetest to achieve synthetic monitoring
# and get notified via Slack when something fails
name: Synthetic monitoring with Tracetest
on:
# allows the manual trigger
workflow_dispatch:
jobs:
run-synthetic-monitoring:
name: Run synthetic monitoring
runs-on: ubuntu-latest
steps:
- name: Checkout
uses: actions/checkout@v3
- name: Start app and tracetest
run: docker-compose -f docker-compose.yaml -f tracetest/docker-compose.yaml up -d
- name: Install tracetest CLI
run: curl -L https://raw.githubusercontent.com/kubeshop/tracetest/main/install-cli.sh | bash
- name: Configure Tracetest CLI
run: tracetest configure -g --endpoint http://localhost:11633 --analytics=false
- name: Run synthetic monitoring tests
run: |
tracetest test run -d test-api.yaml
```
## Automated Trace-based Testing with GitHub Actions Schedule
Now we can run our test any time we want by triggering it manually, however, synthetic monitoring requires us to run this test periodically, so, we can use `on.schedule` to make GitHub Actions run the workflow automatically on a set time interval:
```yaml
# This example illustrates how you can use Tracetest to achieve synthetic monitoring
# and get notified via Slack when something fails
name: Synthetic monitoring with Tracetest
on:
# allows the manual trigger
workflow_dispatch:
schedule:
# Normally, we run synthetic monitoring in a time schedule. GitHub Actions allows
# us to achieve that using a cron job. Read more about how cron jobs are configured in
# this article: https://docs.oracle.com/cd/E12058_01/doc/doc.1014/e12030/cron_expressions.htm
#
# Here are some examples of valid cron strings:
#
#- cron: '*/30 * * * *' # every 30 minutes
#- cron: '*/5 * * * *' # every 5 minutes
#- cron: '* * * * *' # every minute
#- cron: '0 */1 * * *' # every hour
#
# For this example, we are going to run the job every 5 minutes
- cron: '*/5 * * * *'
jobs:
run-synthetic-monitoring:
name: Run synthetic monitoring
runs-on: ubuntu-latest
steps:
- name: Checkout
uses: actions/checkout@v3
- name: Start app and tracetest
run: docker-compose -f docker-compose.yaml -f tracetest/docker-compose.yaml up -d
- name: Install tracetest CLI
run: curl -L https://raw.githubusercontent.com/kubeshop/tracetest/main/install-cli.sh | bash
- name: Configure Tracetest CLI
run: tracetest configure -g --endpoint http://localhost:11633 --analytics=false
- name: Run synthetic monitoring tests
run: |
tracetest test run -d test-api.yaml
```
## Introduce Synthetic Monitoring Alerts with Slack
And, to cover the last aspect of synthetic monitoring, we need a way of receiving alerts when something breaks. For this, we will set up a Slack bot to notify us when the test breaks.
> For this example, we are going to use [Slack’s Incoming Webhook](https://api.slack.com/messaging/webhooks) to send messages to a channel.
>
```yaml
# This example illustrates how you can use Tracetest to achieve synthetic monitoring
# and get notified via Slack when something fails
name: Synthetic monitoring with Tracetest
on:
# allows the manual trigger
workflow_dispatch:
schedule:
# Normally, we run synthetic monitoring in a time schedule. GitHub Actions allows
# us to achieve that using a cron job. Read more about how cron jobs are configured in
# this article: https://docs.oracle.com/cd/E12058_01/doc/doc.1014/e12030/cron_expressions.htm
#
# Here are some examples of valid cron strings:
#
#- cron: '*/30 * * * *' # every 30 minutes
#- cron: '*/5 * * * *' # every 5 minutes
#- cron: '* * * * *' # every minute
#- cron: '0 */1 * * *' # every hour
#
# For this example, we are going to run the job every 5 minutes
- cron: '*/5 * * * *'
jobs:
run-synthetic-monitoring:
name: Run synthetic monitoring
runs-on: ubuntu-latest
steps:
- name: Checkout
uses: actions/checkout@v3
- name: Start app and tracetest
run: docker-compose -f docker-compose.yaml -f tracetest/docker-compose.yaml up -d
- name: Install tracetest CLI
run: curl -L https://raw.githubusercontent.com/kubeshop/tracetest/main/install-cli.sh | bash
- name: Configure Tracetest CLI
run: tracetest configure -g --endpoint http://localhost:11633 --analytics=false
- name: Run synthetic monitoring tests
run: |
tracetest test run -d test-api.yaml
- name: Send message on Slack in case of failure
if: ${{ failure() }}
uses: slackapi/slack-github-action@v1.24.0
with:
# check the block kit builder docs to understand how it works
# and how to modify it: https://api.slack.com/block-kit
payload: |
{
"blocks": [
{
"type": "header",
"text": {
"type": "plain_text",
"text": ":warning: Synthetic Monitoring Alert :warning:",
"emoji": true
}
},
{
"type": "section",
"fields": [
{
"type": "mrkdwn",
"text": "*Status:*\nFailed"
},
{
"type": "mrkdwn",
"text": "*Pipeline:*\n<${{ github.server_url }}/${{ github.repository }}/actions/runs/${{ github.run_id }}|View workflow>"
}
]
}
]
}
env:
SLACK_WEBHOOK_URL: ${{ secrets.SLACK_WEBHOOK_URL }}
SLACK_WEBHOOK_TYPE: INCOMING_WEBHOOK
```
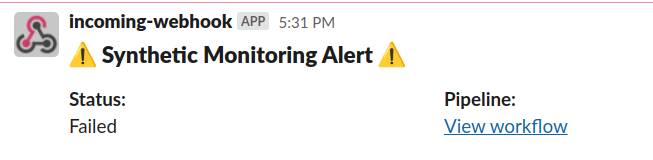
With this configuration, from now on, tests will run every 5 minutes and, if any of them fail, you will receive a message on Slack informing you about it:
You can check our [synthetic monitoring example](https://github.com/kubeshop/tracetest/tree/main/examples/tracetest-synthetic-monitoring) on GitHub to see how Tracetest and the demo application were configured.
Last, but not least - if would you like to learn more about Tracetest and what it brings to the table? Check the [docs](https://docs.tracetest.io/examples-tutorials/recipes/running-tracetest-with-lightstep/) and try it out by [downloading](https://tracetest.io/download) it today!
Also, please feel free to join our [Slack community](https://dub.sh/tracetest-community), give [Tracetest a star on GitHub](https://github.com/kubeshop/tracetest), or schedule a [time to chat 1:1](http://calendly.com/ken-kubeshop/otel-user-interview-w-tracetest).
## The Future
The Tracetest team has been discussing whether to build synthetic API monitoring directly into Tracetest to make creating and running synthetic tests easier. This would involve adding the scheduling of tests and notifications into Tracetest.
The Pros:
- It would make it super convenient to add scheduled tests with notifications.
- For SREs installing Tracetest, it would provide a ready tool for doing deep synthetic tests against the system they are responsible for.
The Cons:
- The dev team creating Tracetest would be focused on items outside its core mission of trace-based testing, pulling time from other needed and exciting improvements.
- There are a variety of different ways to notify team members, and it would be difficult to support a wide number of them.
Should we leave scheduling and notification to outside services, such as GitHub Actions paired with Slack, or would you like to see this capability embedded in Tracetest? Let us know in [this four-question poll](https://www.surveymonkey.com/r/75RFLCH).
.jpg)
.avif)
.avif)