
Get Started with Cloud-based Managed Tracetest
.avif)

Jump in and learn the ins-and-outs of configuring OpenTelemetry trace exporting and using Cloud-based Managed Tracetest for trace-based testing.
Table of Contents
Tracetest integrates observability and testing in software development through distributed tracing. With Tracetest, you can embrace test-driven development with observability, test against real data, and say goodbye to time-consuming mocks and black box testing.
Key features include:
1. Correlation of failing requests with distributed traces 🔍
2. Root cause analysis via span-level insights 👀
3. Assertion capabilities against both response data and distributed trace data 🧪
Tracetest enables:
- Test-driven development with observability — coined Observability-driven development ‼️
- Testing against real data
- Not spending time on mocks
- Comprehensive system visibility
This approach significantly enhances traditional software testing and observability practices by providing deeper insights and more efficient debugging processes.
## How OpenTelemetry Fits into the Picture
Tracetest does this by leveraging OpenTelemetry (or any other distributed tracing library).
[OpenTelemetry](https://opentelemetry.io/) is an open-source observability framework that provides a standardized way to collect and export telemetry data, including traces, metrics, and logs. By integrating with OpenTelemetry, Tracetest can seamlessly capture and analyze distributed traces from various parts of your application, providing a comprehensive view of system behavior and performance.
This allows Tracetest to provide powerful testing and debugging capabilities across complex, distributed systems. It enables developers to gain insights into the entire request flow, identify bottlenecks, and validate system behavior with unprecedented detail and accuracy.
## Tracetest Deployment Architecture
Tracetest contains two parts:
- A Control Plane which includes the Dashboard, Test Storage + Orchestration, RBAC, and all other [features part of Cloud-based Managed Tracetest](https://tracetest.io/features).
- A [Tracetest Agent](https://docs.tracetest.io/concepts/agent) running in your environment that runs tests and ingests traces.
> [View the detailed explanation of the Tracetest deployment architecture, here.](https://docs.tracetest.io/install/deployment-architecture)
For Tracetest to test your apps, you need to configure the Tracetest Agent to do two things:
- Access your apps to trigger tests.
- Ingest trace data from your OpenTelemetry libraries, OpenTelemetry Collector, or tracing backend.
To enable this, there is some slight networking involved, depending on how you are running your apps. If you’re testing apps behind a firewall, you’ll deploy the Tracetest Agent in the environment where your apps are running.
Tracetest supports every deployment option:
- Localhost (with [Tracetest CLI](https://docs.tracetest.io/install/cli))
- Docker/Docker Compose
- Kubernetes/Helm
Alternatively, if you have publicly accessible apps, like serverless apps using Lambda or similar technologies, you can use the [Tracetest Cloud Agent](https://docs.tracetest.io/concepts/cloud-agent). In this case:
- Tracetest Agent is running inside of Cloud-based Managed Tracetest.
- You will export traces from your public-facing apps directly to an OTLP endpoint provided in your Tracetest account.
Let’s walk through every option and explain how you can get started with trace-based testing on your own.
## Trace-based Testing on Localhost
In this scenario, let’s define three premises:
- You’re running an app on `localhost:8080`.
- You’re using OpenTelemetry libraries to export traces via gRPC.
- You’re running Tracetest Agent on `localhost:4317` via the Tracetest CLI.
Let’s walk through these steps.
## Running Apps on Localhost
With your app running on `localhost:8080` it would look something like this in a few popular programming languages.
### Node.js JavaScript on Localhost
```jsx
// Node.js Express
// app.js
const express = require('express');
const app = express();
app.get('/', (req, res) => {
res.send('Hello, World!');
});
app.listen(8080, () => {
console.log('Server is running on port 8080');
});
```
### Python Flask on Localhost
```python
# Python Flask
# app.py
from flask import Flask
app = Flask(__name__)
@app.route('/')
def hello_world():
return 'Hello, World!'
if __name__ == '__main__':
app.run(port=8080)
```
### Go on Localhost
```go
// Go
// main.go
package main
import (
"fmt"
"log"
"net/http"
)
func main() {
// Create a basic handler
handler := http.HandlerFunc(func(w http.ResponseWriter, r *http.Request) {
fmt.Fprintf(w, "Hello, World!")
})
// Wrap the handler with OpenTelemetry instrumentation
wrappedHandler := otelhttp.NewHandler(handler, "hello-world")
// Start the HTTP server
log.Println("Starting server on :8080")
if err := http.ListenAndServe(":8080", wrappedHandler); err != nil {
log.Fatalf("failed to start server: %v", err)
}
}
```
## Using OpenTelemetry Libraries to Export Traces via gRPC
When using OpenTelemetry to export traces via gRPC, you’ll use the official OpenTelemetry trace exporter libraries. Below are examples for popular programming languages. Note that the `traceExporter` URL is set to `'localhost:4317'`. This is where you’ll run Tracetest Agent.
To see all trace exporter options for all supporter languages, [refer to the OpenTelemetry docs, here.](https://opentelemetry.io/docs/languages/)
### Node.js JavaScript on Localhost
```bash
# Terminal
npm install express @opentelemetry/sdk-node @opentelemetry/auto-instrumentations-node @opentelemetry/exporter-trace-otlp-grpc
```
```jsx
// tracing.js
const { NodeSDK } = require('@opentelemetry/sdk-node');
const { OTLPTraceExporter } = require('@opentelemetry/exporter-trace-otlp-grpc');
const { getNodeAutoInstrumentations } = require('@opentelemetry/auto-instrumentations-node');
// Configure OTLP gRPC Trace Exporter
const traceExporter = new OTLPTraceExporter({
// Default endpoint for OTLP gRPC is localhost:4317
// You can change this to your OTLP collector or backend URL.
url: 'http://localhost:4317',
});
// Initialize the OpenTelemetry Node SDK
const sdk = new NodeSDK({
traceExporter,
instrumentations: [getNodeAutoInstrumentations()],
});
// Start the SDK (this enables tracing)
sdk.start();
// Graceful shutdown on exit
process.on('SIGTERM', () => {
sdk.shutdown().then(() => {
console.log('OpenTelemetry tracing terminated');
process.exit(0);
});
});
```
```jsx
// app.js
require('./tracing'); // Initialize OpenTelemetry tracing
const express = require('express');
const app = express();
app.get('/', (req, res) => {
res.send('Hello, World!');
});
app.listen(8080, () => {
console.log('Server is running on port 8080');
});
```
### Python Flask on Localhost
```bash
pip install Flask opentelemetry-api opentelemetry-sdk opentelemetry-instrumentation-flask opentelemetry-exporter-otlp-proto-grpc
```
```python
# tracing.py
from opentelemetry import trace
from opentelemetry.sdk.resources import Resource
from opentelemetry.sdk.trace import TracerProvider
from opentelemetry.sdk.trace.export import BatchSpanProcessor
from opentelemetry.exporter.otlp.proto.grpc.trace_exporter import OTLPSpanExporter
from opentelemetry.instrumentation.flask import FlaskInstrumentor
from opentelemetry.sdk.trace.export import BatchSpanProcessor
import flask
# Set up the OTLP gRPC exporter
otlp_exporter = OTLPSpanExporter(
endpoint="localhost:4317" # Default OTLP gRPC endpoint
)
# Set up the tracer provider and add the OTLP gRPC exporter to it
provider = TracerProvider(resource=Resource.create({"service.name": "my-python-flask-app"}))
processor = BatchSpanProcessor(otlp_exporter)
provider.add_span_processor(processor)
trace.set_tracer_provider(provider)
def init_tracing(app):
# Instrument the Flask app with OpenTelemetry
FlaskInstrumentor().instrument_app(app)
```
```python
# app.py
from flask import Flask
import tracing
app = Flask(__name__)
# Initialize OpenTelemetry tracing
tracing.init_tracing(app)
@app.route('/')
def hello_world():
return 'Hello, World!'
if __name__ == '__main__':
app.run(port=8080)
```
### Go on Localhost
```bash
go get go.opentelemetry.io/otel
go get go.opentelemetry.io/otel/sdk
go get go.opentelemetry.io/otel/exporters/otlp/otlptrace/otlptracegrpc
go get go.opentelemetry.io/otel/trace
go get go.opentelemetry.io/contrib/instrumentation/net/http/otelhttp
```
```go
// tracing.go
package main
import (
"context"
"log"
"go.opentelemetry.io/otel"
"go.opentelemetry.io/otel/sdk/resource"
"go.opentelemetry.io/otel/sdk/trace"
"go.opentelemetry.io/otel/exporters/otlp/otlptrace/otlptracegrpc"
"go.opentelemetry.io/otel/semconv/v1.21.0"
"google.golang.org/grpc"
)
// InitTracer initializes the OpenTelemetry tracer with gRPC exporter
func InitTracer() func() {
ctx := context.Background()
// Configure OTLP gRPC exporter
exporter, err := otlptracegrpc.New(ctx,
otlptracegrpc.WithInsecure(), // Insecure since it's local
otlptracegrpc.WithEndpoint("localhost:4317"),
otlptracegrpc.WithDialOption(grpc.WithBlock()))
if err != nil {
log.Fatalf("failed to create exporter: %v", err)
}
// Set resource information
resources := resource.NewWithAttributes(
semconv.SchemaURL,
semconv.ServiceName("my-golang-app"),
)
// Set up the tracer provider
tp := trace.NewTracerProvider(
trace.WithBatcher(exporter),
trace.WithResource(resources),
)
// Set the global tracer provider
otel.SetTracerProvider(tp)
// Return a function to gracefully shut down the tracer
return func() {
if err := tp.Shutdown(ctx); err != nil {
log.Fatalf("Error shutting down tracer provider: %v", err)
}
}
}
```
```go
// main.go
package main
import (
"fmt"
"log"
"net/http"
"go.opentelemetry.io/contrib/instrumentation/net/http/otelhttp"
)
func main() {
// Initialize tracing and get a shutdown function
shutdownTracer := InitTracer()
defer shutdownTracer() // Ensure tracer shuts down properly on exit
// Create a basic handler
handler := http.HandlerFunc(func(w http.ResponseWriter, r *http.Request) {
fmt.Fprintf(w, "Hello, World!")
})
// Wrap the handler with OpenTelemetry instrumentation
wrappedHandler := otelhttp.NewHandler(handler, "hello-world")
// Start the HTTP server
log.Println("Starting server on :8080")
if err := http.ListenAndServe(":8080", wrappedHandler); err != nil {
log.Fatalf("failed to start server: %v", err)
}
}
```
## Running Tracetest Agent on `localhost:4317` via the Tracetest CLI
1. [Sign in to Tracetest](https://app.tracetest.io/).
2. [Create an Organization](https://docs.tracetest.io/concepts/organizations).
3. Retrieve your [Tracetest Organization API Key/Token and Environment ID](https://app.tracetest.io/retrieve-token).
4. [Install the Tracetest CLI](https://docs.tracetest.io/install/cli#install-the-tracetest-cli).
5. Start [Tracetest Agent](https://docs.tracetest.io/concepts/agent) as a standalone process with the `<TRACETEST_API_KEY>` and `<TRACETEST_ENVIRONMENT_ID>` from step 2.
```bash
tracetest start --api-key <TRACETEST_API_KEY> --environment <TRACETEST_ENVIRONMENT_ID>
```
Tracetest Agent will run on gRPC and HTTP ports.
- `http://localhost:4317` — gRPC
- `http://localhost:4318/v1/traces` — HTTP
You care about gRPC, since you’ve configured the OpenTelemetry trace exporter to export traces to `localhost:4317`.
### Configure Trace Ingestion for Localhost
Go to the Trace Ingestion tab in the settings, select OpenTelemetry, and enable the toggle.
With OpenTelemetry trace ingestion enabled, the Tracetest Agent will directly ingest traces on ports `4317` and `4318` via the OTLP protocol. This default behavior matches all the standardized behavior for trace ingestion across all distributed tracing tools including OpenTelemetry Collector, Jaeger, Grafana Tempo, and more.
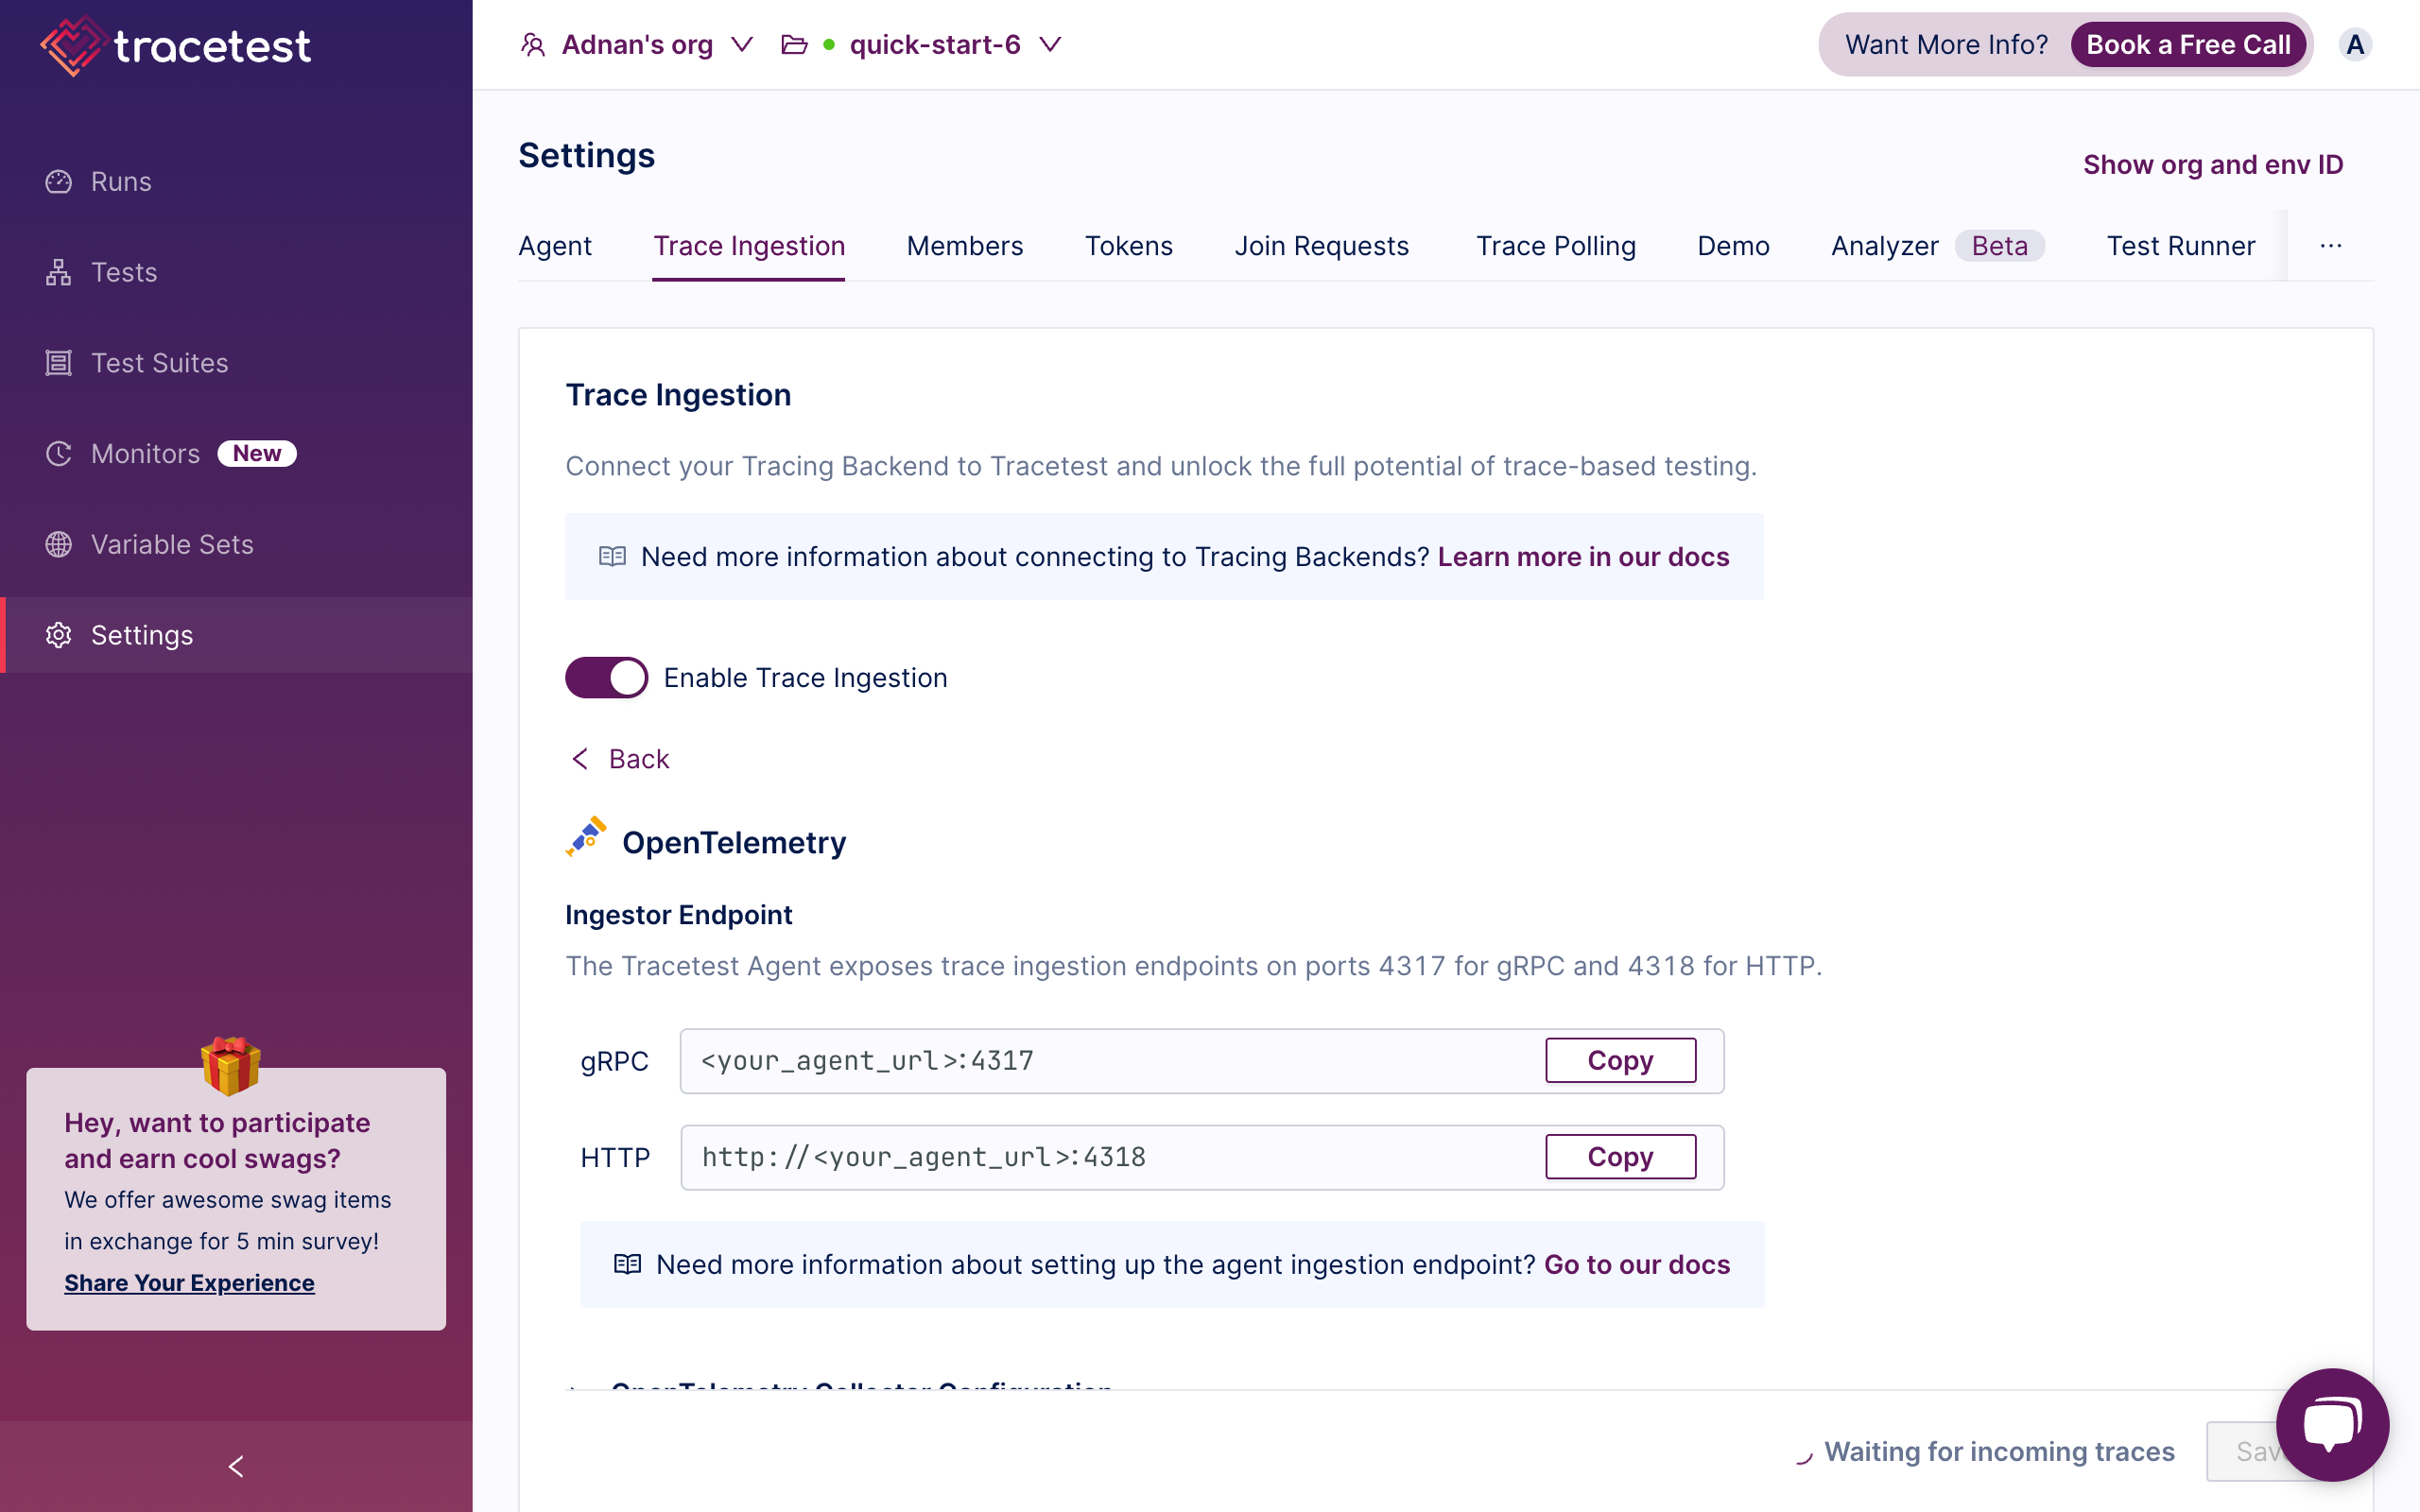
We suggest leaving this default behavior when getting started with Tracetest. If you wish to integrate with any of your existing distributed tracing tools, please view the [tracing backend integration docs, here](https://docs.tracetest.io/configuration/connecting-to-data-stores/overview).
### Run your First Trace-based Test
You can now run tests against your apps on `localhost:8080` by going to Tracetest and creating a new HTTP test.
1. Click create a test and select HTTP.
2. Add `http://localhost:8080` in the URL field.
3. Click Run. You’ll see the response data right away.
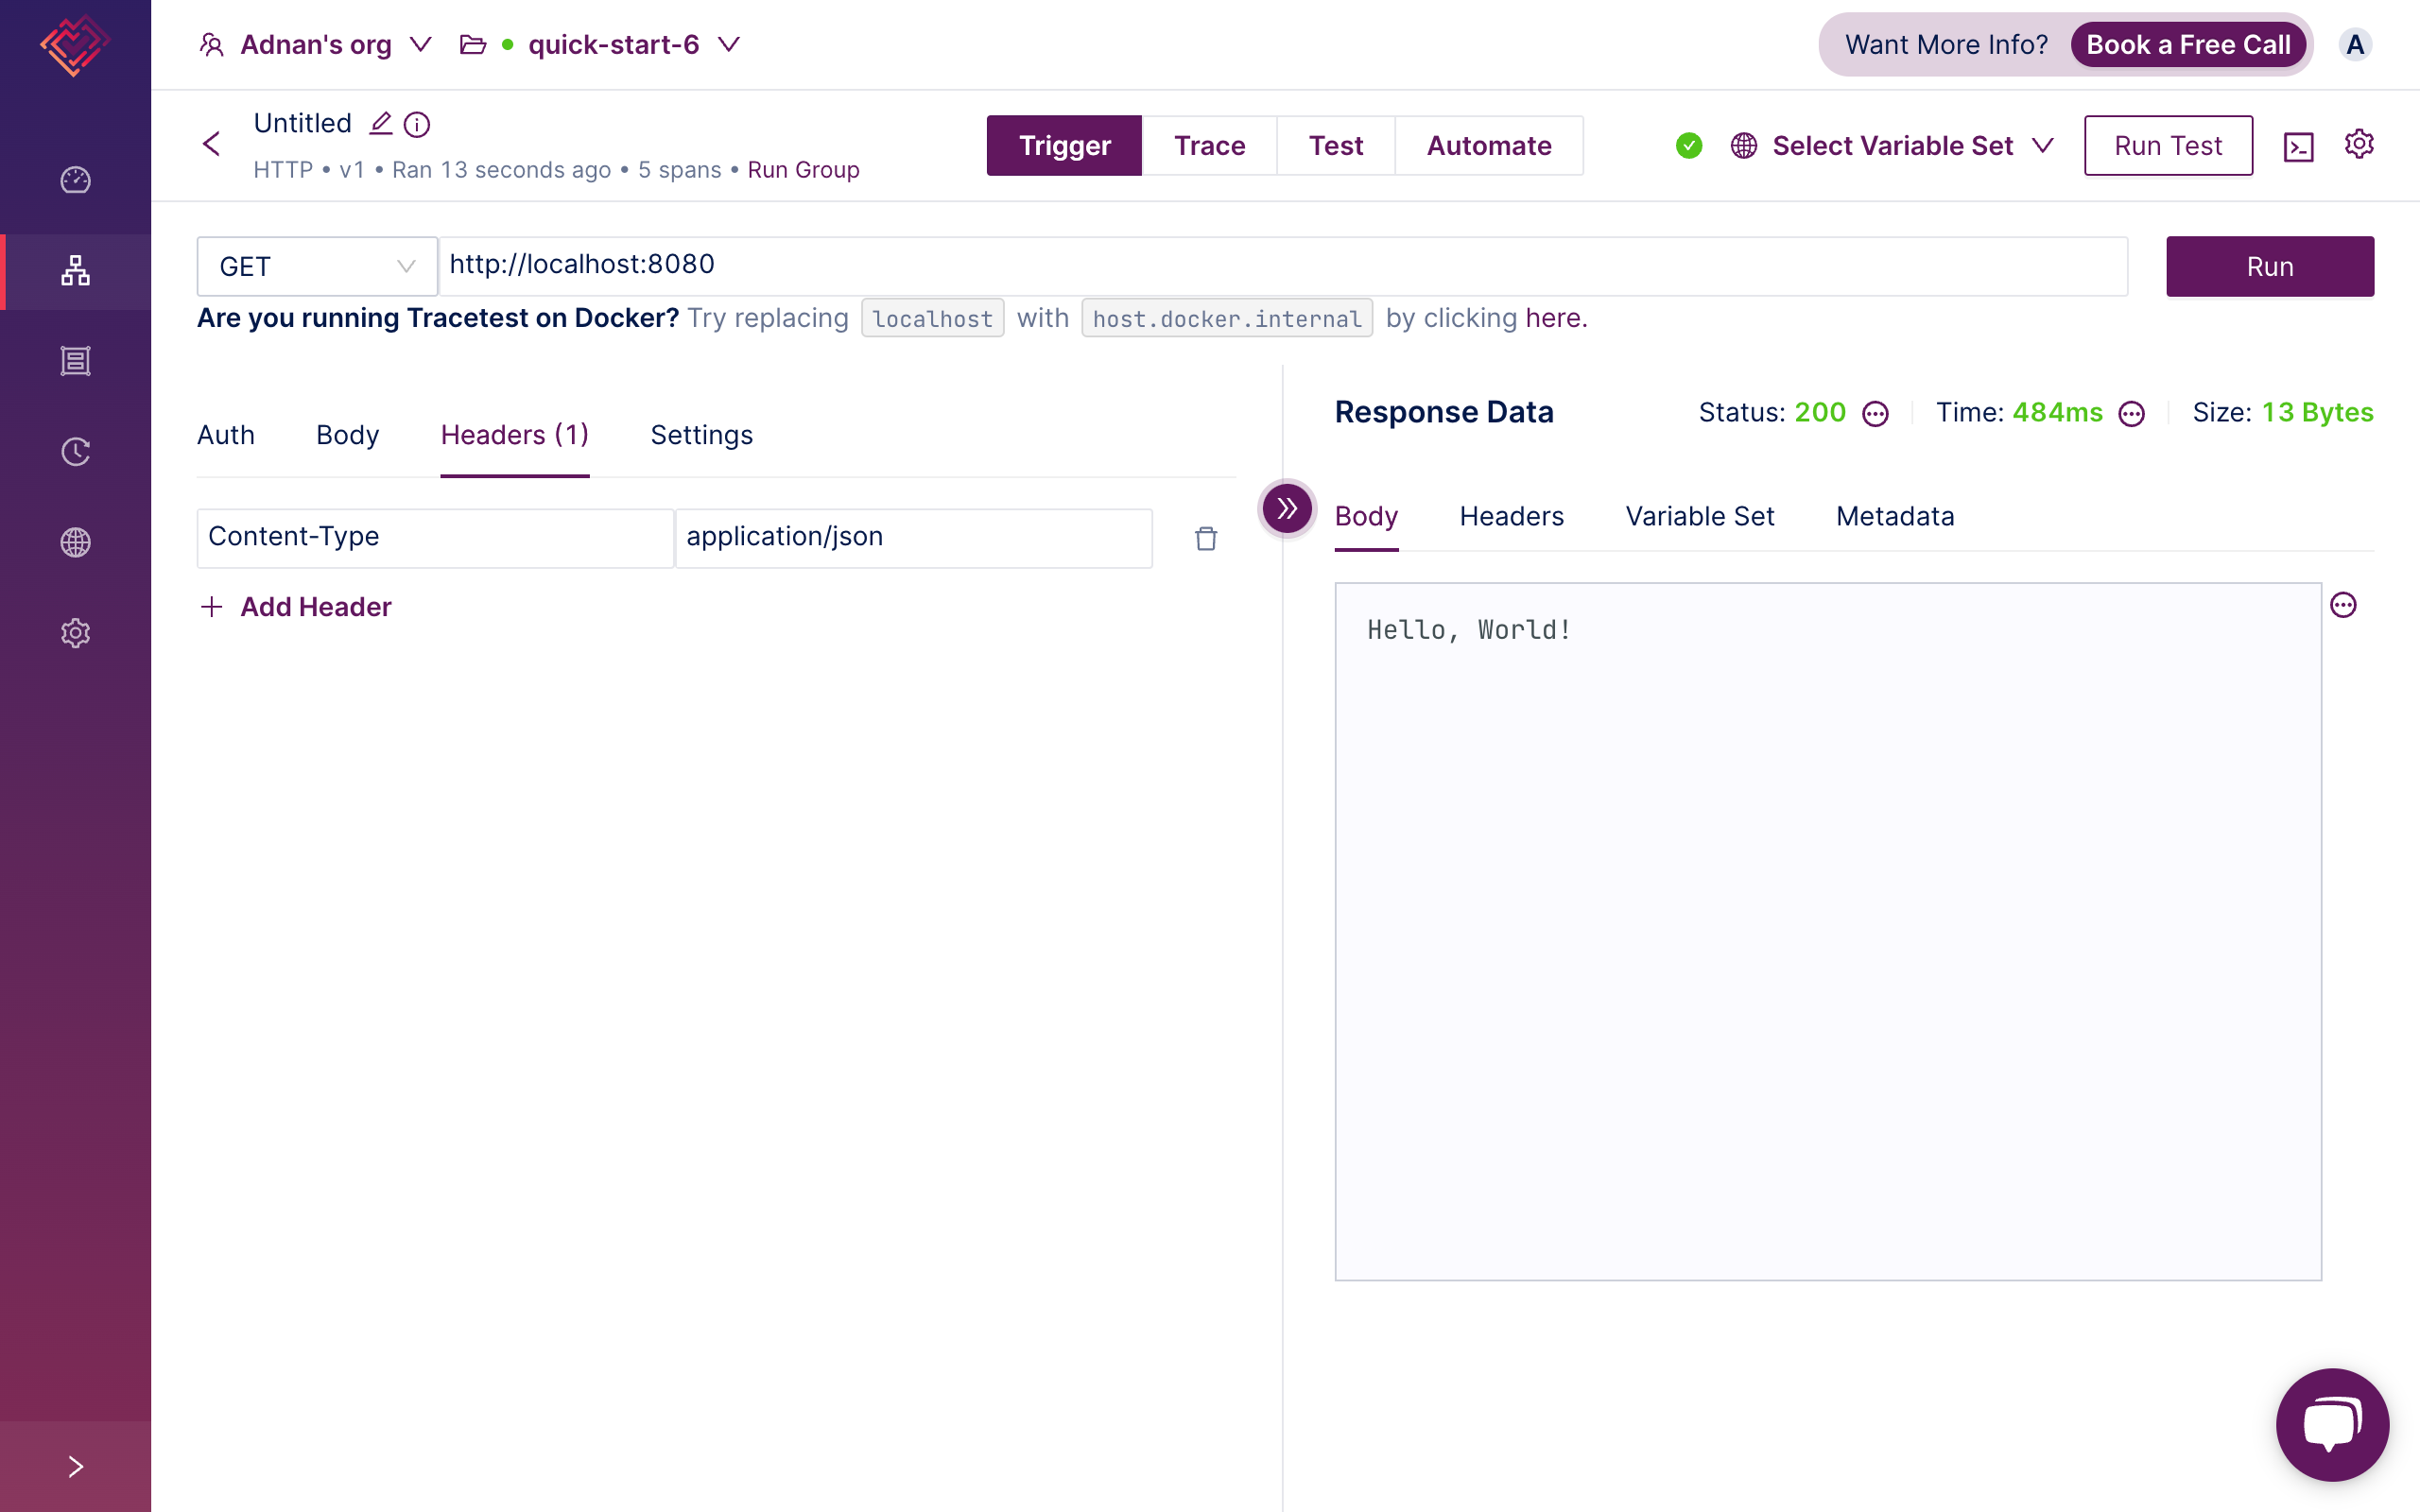
4. Click the Test tab. Here you will see the distributed trace for this test and can start adding test specs.
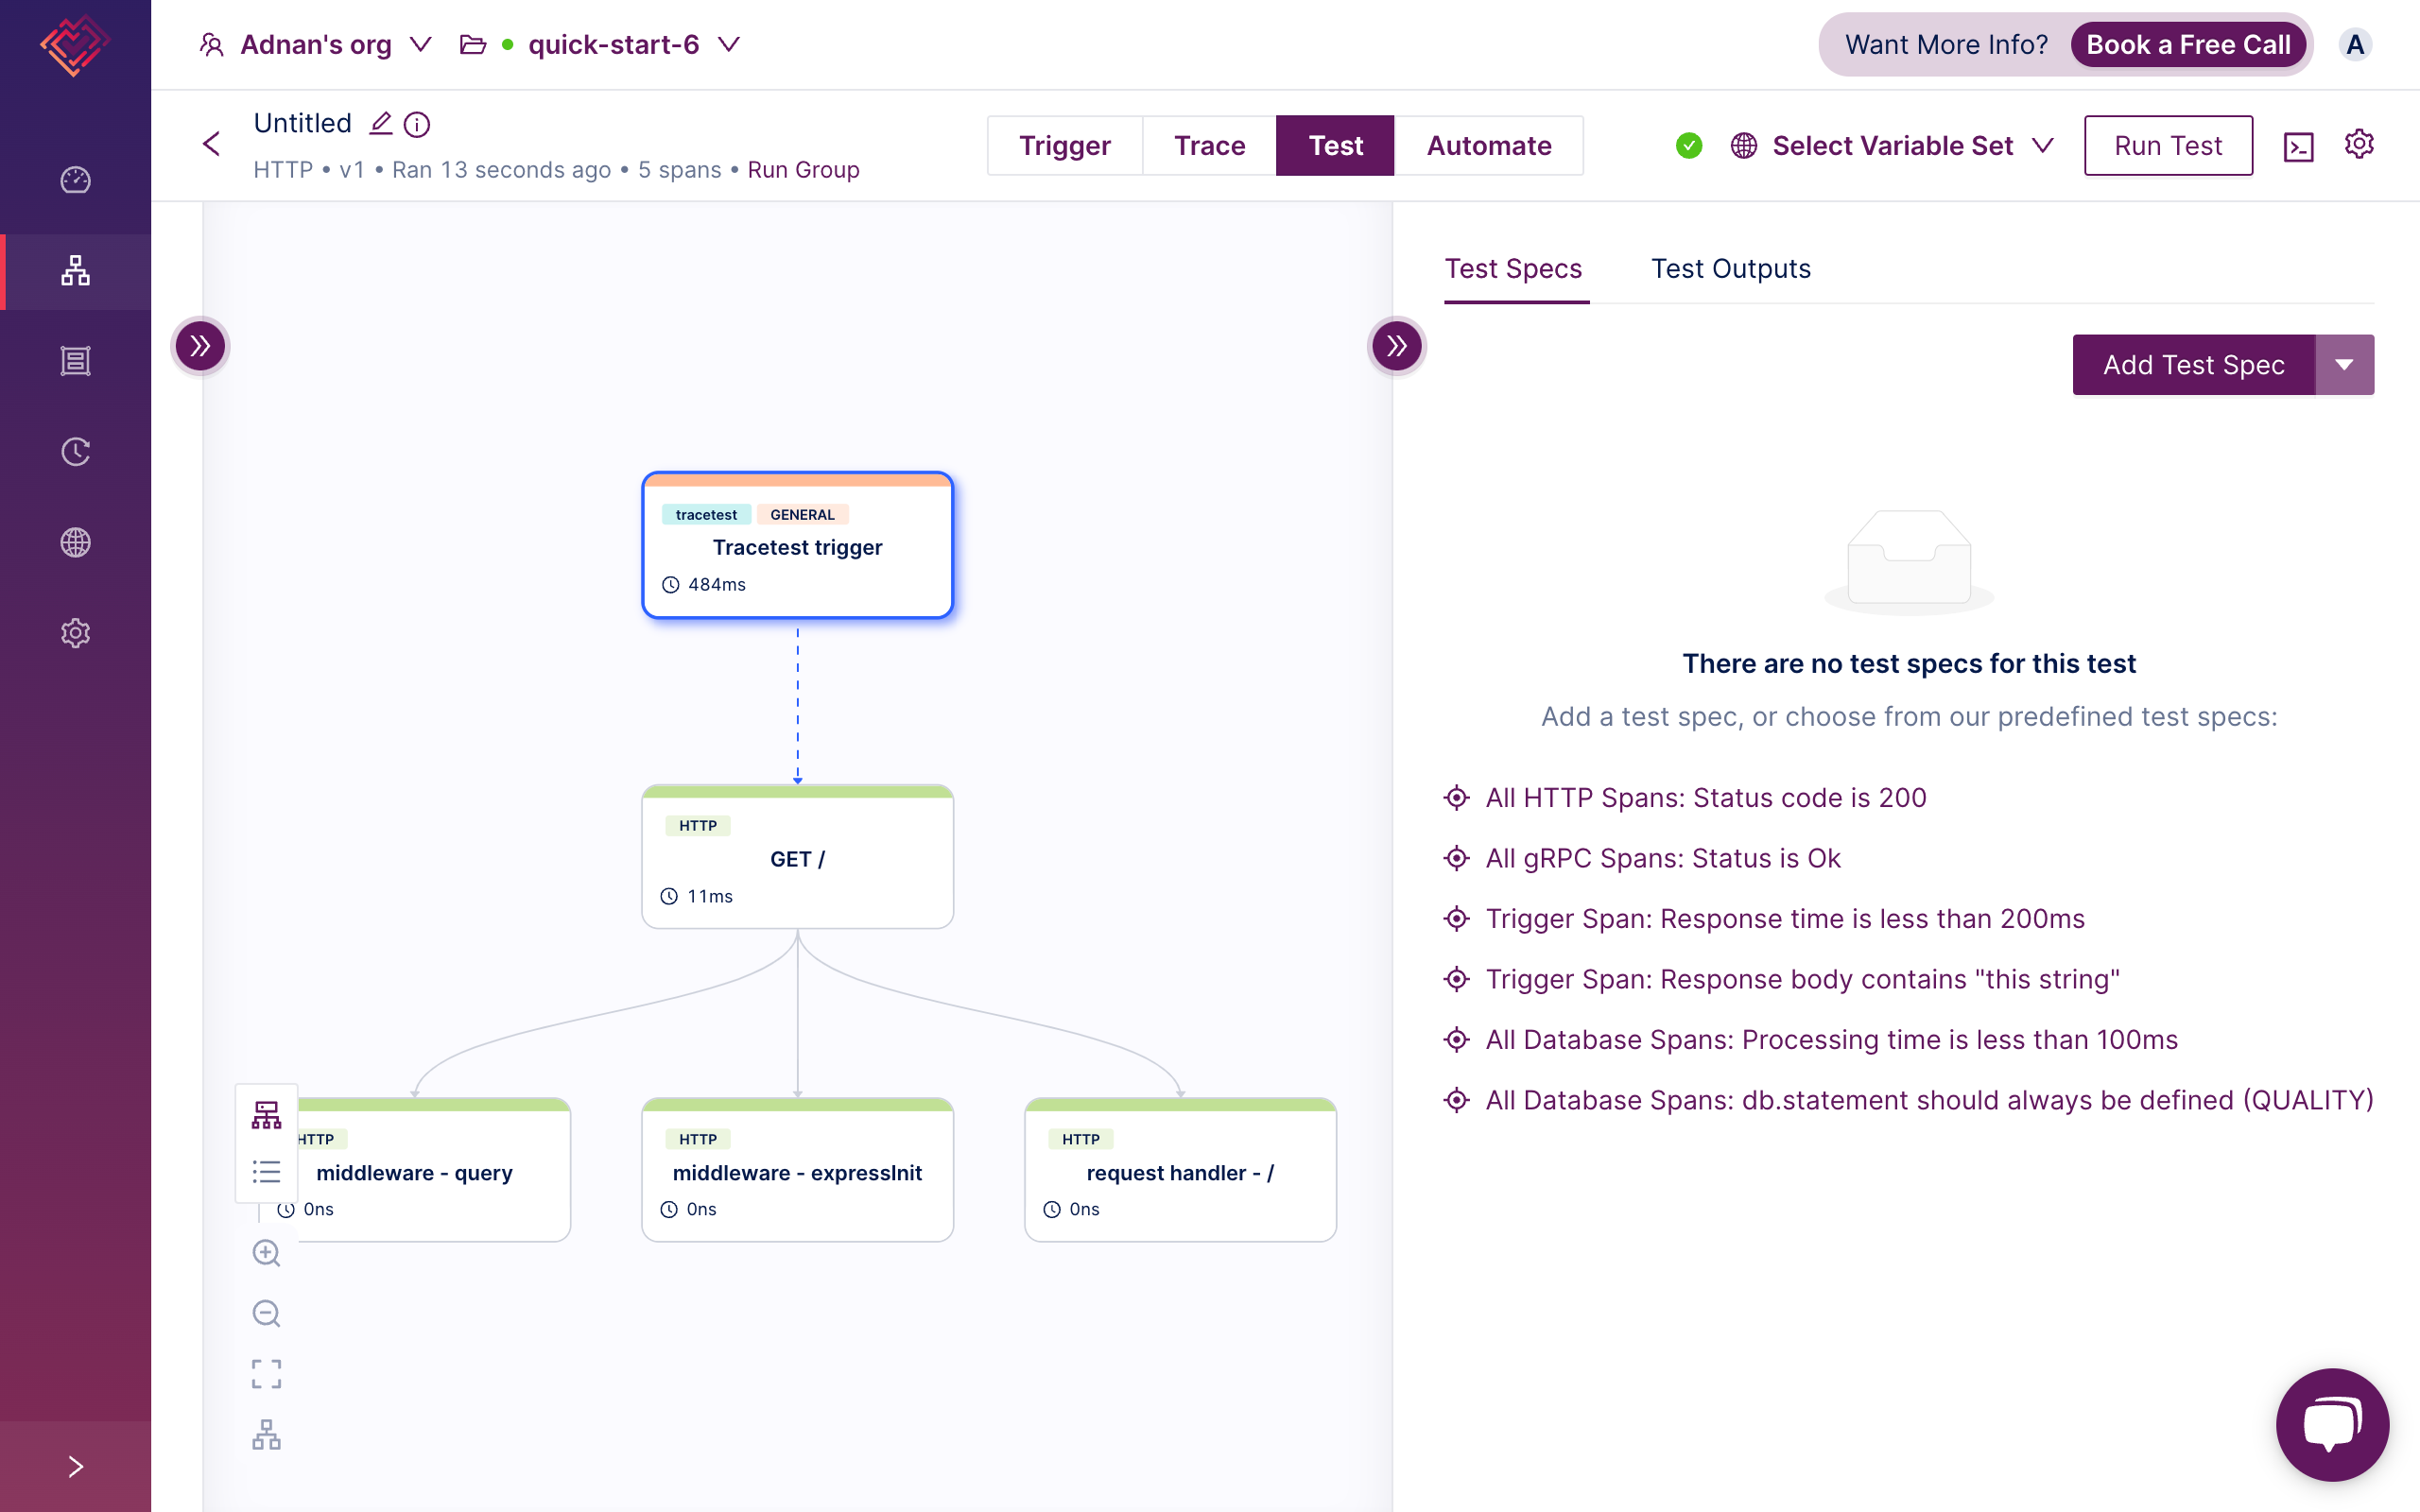
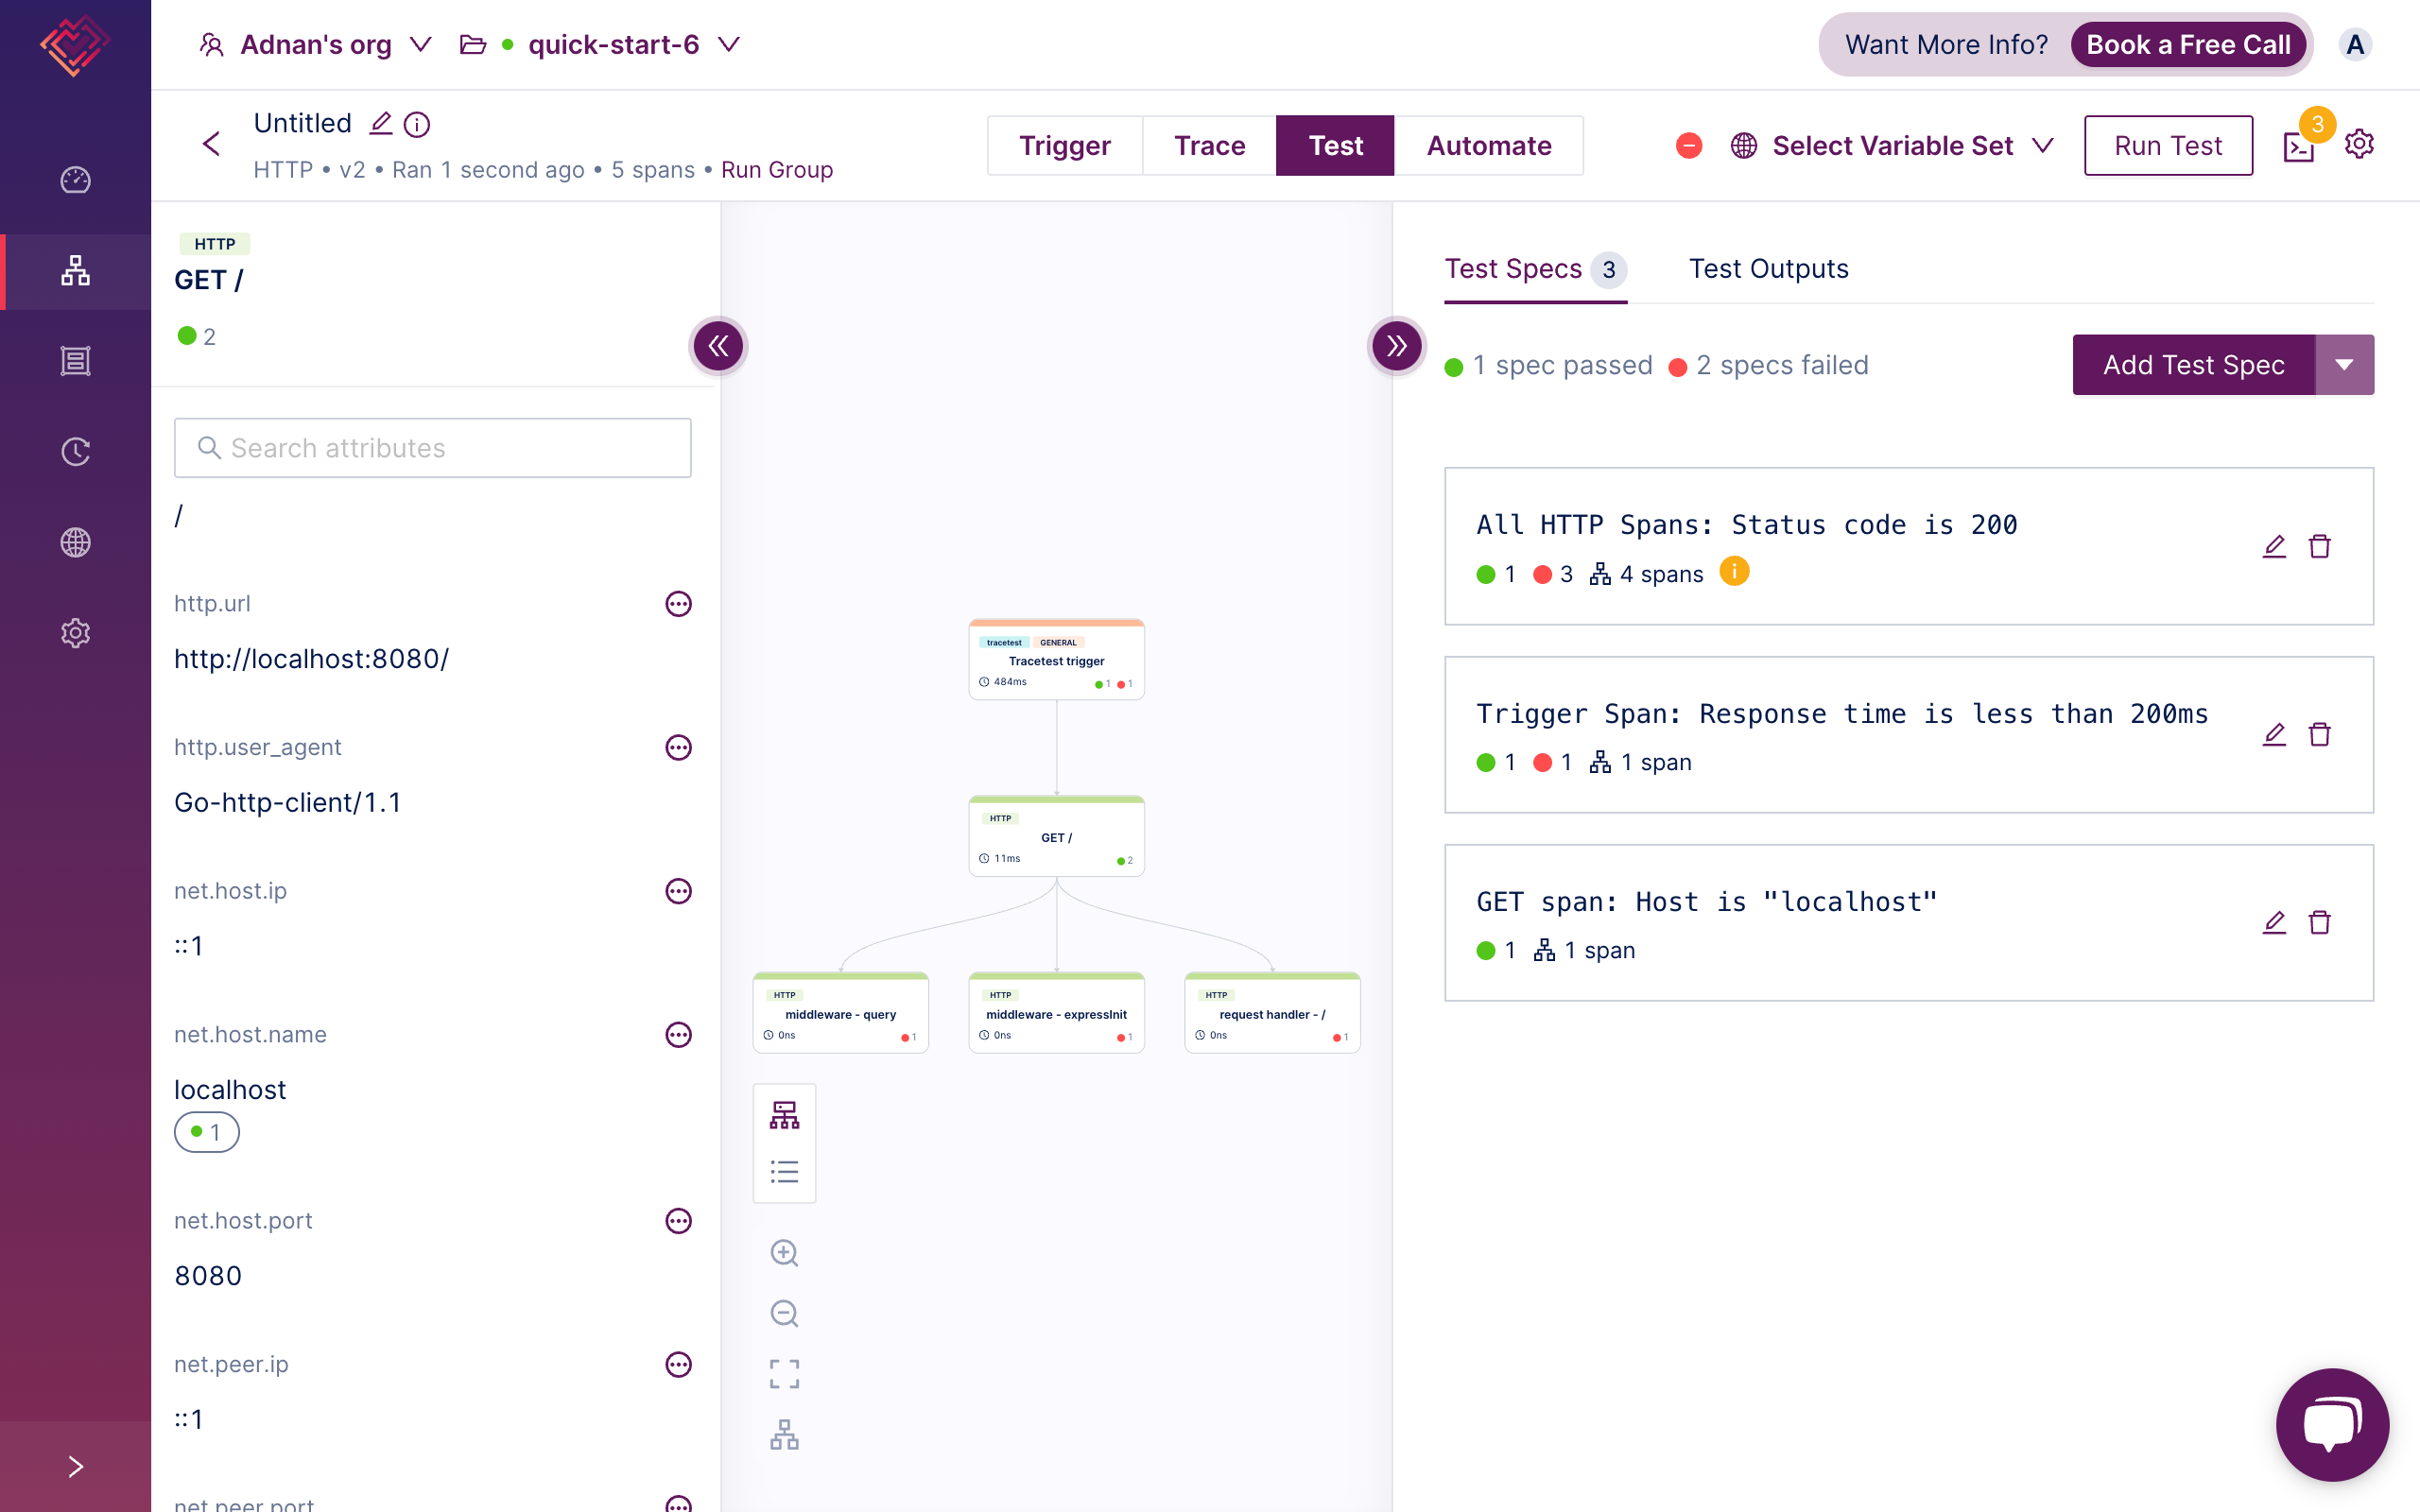
5. Add assertions to your test. View the [full assertions guide in the docs, here](https://docs.tracetest.io/concepts/assertions). To easily add assertions, view the span attributes in the left panel and add assertions by clicking the three dots and “Create test spec”.
## Trace-based Testing in Docker (Compose)
In this scenario, let’s again define three premises:
- You’re running an app in a Docker container and exposing port `8080`.
- You’re using OpenTelemetry libraries to export traces via gRPC.
- You’re running Tracetest Agent in a Docker container and exposing port `4317`.
Very similar to the `localhost` example indeed. Let’s walk through these steps.
## Running Apps in Docker
I’ll showcase using the same three sample apps as above. They’re running on `localhost:8080` so you will need to expose port `8080` in the Dockerfile.
```docker
# Node.js sample Dockerfile
FROM node:slim
WORKDIR /usr/src/app/
COPY package*.json ./
RUN npm install
COPY . .
EXPOSE 8080
CMD [ "npm", "start" ]
```
```yaml
# Node.js sample docker-compose.yaml
services:
app:
image: app
build: .
ports:
- "8080:8080"
```
## Using OpenTelemetry Libraries to Export Traces Via gRPC in Docker
You’ll export traces the same way as for `localhost`, but, instead, use the Docker service name. Note that the `traceExporter` URL is set to `'http://tracetest-agent:4317'` since you’ll run Tracetest Agent in Docker.
```jsx
// Node.js
// Configure OTLP gRPC Trace Exporter
const traceExporter = new OTLPTraceExporter({
// Default endpoint for OTLP gRPC is localhost:4317
// You can change this to your OTLP collector or backend URL.
url: 'http://tracetest-agent:4317',
});
```
```python
# Python
# Set up the OTLP gRPC exporter
otlp_exporter = OTLPSpanExporter(
endpoint="tracetest-agent:4317" # Default OTLP gRPC endpoint
)
```
```go
// Go
// Configure OTLP gRPC exporter
exporter, err := otlptracegrpc.New(ctx,
otlptracegrpc.WithInsecure(), // Insecure since it's local
otlptracegrpc.WithEndpoint("tracetest-agent:4317"),
otlptracegrpc.WithDialOption(grpc.WithBlock()))
```
## Running Tracetest Agent in Docker on `tracetest-agent:4317`
1. [Sign in to Tracetest](https://app.tracetest.io/).
2. [Create an Organization](https://docs.tracetest.io/concepts/organizations).
3. Retrieve your [Tracetest Organization API Key/Token and Environment ID](https://app.tracetest.io/retrieve-token).
4. Start [Tracetest Agent](https://docs.tracetest.io/concepts/agent) in Docker (Compose) with the `<TRACETEST_API_KEY>` and `<TRACETEST_ENVIRONMENT_ID>` from step 2.
```yaml
tracetest-agent:
image: kubeshop/tracetest-agent
environment:
- TRACETEST_API_KEY=<TRACETEST_API_KEY>
- TRACETEST_ENVIRONMENT_ID=<TRACETEST_ENVIRONMENT_ID>
ports:
- 4317:4317
- 4318:4318
```
Tracetest Agent will run and expose gRPC and HTTP ports.
- `http://tracetest-agent:4317` — gRPC
- `http://tracetest-agent:4318/v1/traces` — HTTP
You care about gRPC, since you’ve configured the OpenTelemetry trace exporter to export traces to `tracetest-agent:4317`.
### Configure Trace Ingestion for a Dockerized Environment
Just as with the `localhost` example, select OpenTelemetry trace ingestion and enable the toggle. The Tracetest Agent will directly ingest traces on ports `4317` and `4318` via the OTLP protocol. Let’s keep this configuration for this sample as well.
### Run your First Trace-based Test in a Dockerized Environment
You can now run tests against your apps running in Docker via its service name `app:8080` by going to Tracetest and creating a new HTTP test.
1. Click create a test and select HTTP.
2. Add `http://app:8080` in the URL field.
3. Click Run. You’ll see the response data right away.
4. The rest of the steps are identical to above!
## Trace-based Testing in Kubernetes (Helm)
This scenario is almost identical to the Docker example. The Docker image configuration will remain the same. The only thing that changes is the networking of how to ingest traces and trigger tests.
```yaml
# app.yaml
# Deployment
---
apiVersion: apps/v1
kind: Deployment
metadata:
labels:
service: app
name: app
spec:
replicas: 1
selector:
matchLabels:
service: app
template:
metadata:
labels:
service: app
spec:
containers:
image: app # (Built from the Dockerfile above)
imagePullPolicy: Always
name: app
ports:
- containerPort: 8080
protocol: TCP
restartPolicy: Always
# Service
---
apiVersion: v1
kind: Service
metadata:
labels:
service: app
name: app
spec:
ports:
- name: "HTTP"
port: 8080
targetPort: 8080
selector:
service: app
```
```bash
kubectl apply -f ./app.yaml
```
## Using OpenTelemetry Libraries to Export Traces Via gRPC in Kubernetes
You’ll export traces the same way as for `localhost`, but, instead, use the Kubernetes service DNS. Note that the `traceExporter` URL is set to `'http://tracetest-agent.default.svc.cluster.local:4317'` since you’ll run Tracetest Agent in Kubernetes.
```jsx
// Node.js
// Configure OTLP gRPC Trace Exporter
const traceExporter = new OTLPTraceExporter({
// Default endpoint for OTLP gRPC is localhost:4317
// You can change this to your OTLP collector or backend URL.
url: 'http://tracetest-agent.default.svc.cluster.local:4317',
});
```
```python
# Python
# Set up the OTLP gRPC exporter
otlp_exporter = OTLPSpanExporter(
endpoint="tracetest-agent.default.svc.cluster.local:4317" # Default OTLP gRPC endpoint
)
```
```go
// Go
// Configure OTLP gRPC exporter
exporter, err := otlptracegrpc.New(ctx,
otlptracegrpc.WithInsecure(), // Insecure since it's local
otlptracegrpc.WithEndpoint("tracetest-agent.default.svc.cluster.local:4317"),
otlptracegrpc.WithDialOption(grpc.WithBlock()))
```
## Running Tracetest Agent in Kubernetes
1. [Sign in to Tracetest](https://app.tracetest.io/).
2. [Create an Organization](https://docs.tracetest.io/concepts/organizations).
3. Retrieve your [Tracetest Organization API Key/Token and Environment ID](https://app.tracetest.io/retrieve-token).
4. Start [Tracetest Agent](https://docs.tracetest.io/concepts/agent) as a Kubernetes deployment with a service with the `<TRACETEST_API_KEY>` and `<TRACETEST_ENVIRONMENT_ID>` from step 2.
```yaml
# tracetest-agent.yaml
---
# Service
apiVersion: v1
kind: Service
metadata:
name: tracetest-agent
labels:
app.kubernetes.io/name: tracetest-agent
app.kubernetes.io/instance: tracetest-agent
spec:
selector:
app.kubernetes.io/name: tracetest-agent
app.kubernetes.io/instance: tracetest-agent
ports:
- name: grpc-collector-entrypoint
protocol: TCP
port: 4317
targetPort: 4317
- name: http-collector-entrypoint
protocol: TCP
port: 4318
targetPort: 4318
---
# Deployment
apiVersion: apps/v1
kind: Deployment
metadata:
name: tracetest-agent
labels:
app: tracetest-agent
app.kubernetes.io/name: tracetest-agent
app.kubernetes.io/instance: tracetest-agent
spec:
selector:
matchLabels:
app.kubernetes.io/name: tracetest-agent
app.kubernetes.io/instance: tracetest-agent
template:
metadata:
labels:
app.kubernetes.io/name: tracetest-agent
app.kubernetes.io/instance: tracetest-agent
spec:
containers:
- name: agent
image: "kubeshop/tracetest-agent:latest"
imagePullPolicy: Always
args: [
"--environment",
"<TRACETEST_ENVIRONMENT_ID>", # Add your env id
"--api-key",
"$TRACETEST_API_KEY",
"--server-url",
"https://app.tracetest.io",
]
env:
- name: TRACETEST_API_KEY
value: "<TRACETEST_API_KEY>" # Add your API key
```
```bash
kubectl apply -f ./tracetest-agent.yaml
```
Tracetest Agent will run and expose gRPC and HTTP ports.
- `http://tracetest-agent.default.svc.cluster.local:4317` — gRPC
- `http://tracetest-agent.default.svc.cluster.local:4318/v1/traces` — HTTP
You care about gRPC, since you’ve configured the OpenTelemetry trace exporter to export traces to `http://tracetest-agent.default.svc.cluster.local:4317`.
> [To run the Tracetest Agent with Helm, view the instructions for the chart, here.](https://docs.tracetest.io/install/cloud-helm)
### Configure Trace Ingestion for a Kubernetes Environment
Just as with the `localhost` and Docker example, configure the Tracetest Agent to directly ingest traces on ports `4317` and `4318` via the OTLP protocol.
### Run Your First Trace-based Test in a Kubernetes Environment
You can now run tests against your apps running in Kubernetes via it’s service DNS `http://app.default.svc.cluster.local:8080` by going to Tracetest and creating a new HTTP test.
1. Click create a test and select HTTP.
2. Add `http://app.default.svc.cluster.local:8080` in the URL field.
3. Click Run. You’ll see the response data right away.
4. The rest of the steps are identical to above!
## Trace-based Testing Publicly Accessible Apps (Serverless)
In this final use-case, again let’s define three premises:
- You’re running a serverless app on `your-domain.com`.
- You’re using OpenTelemetry libraries to export traces via gRPC.
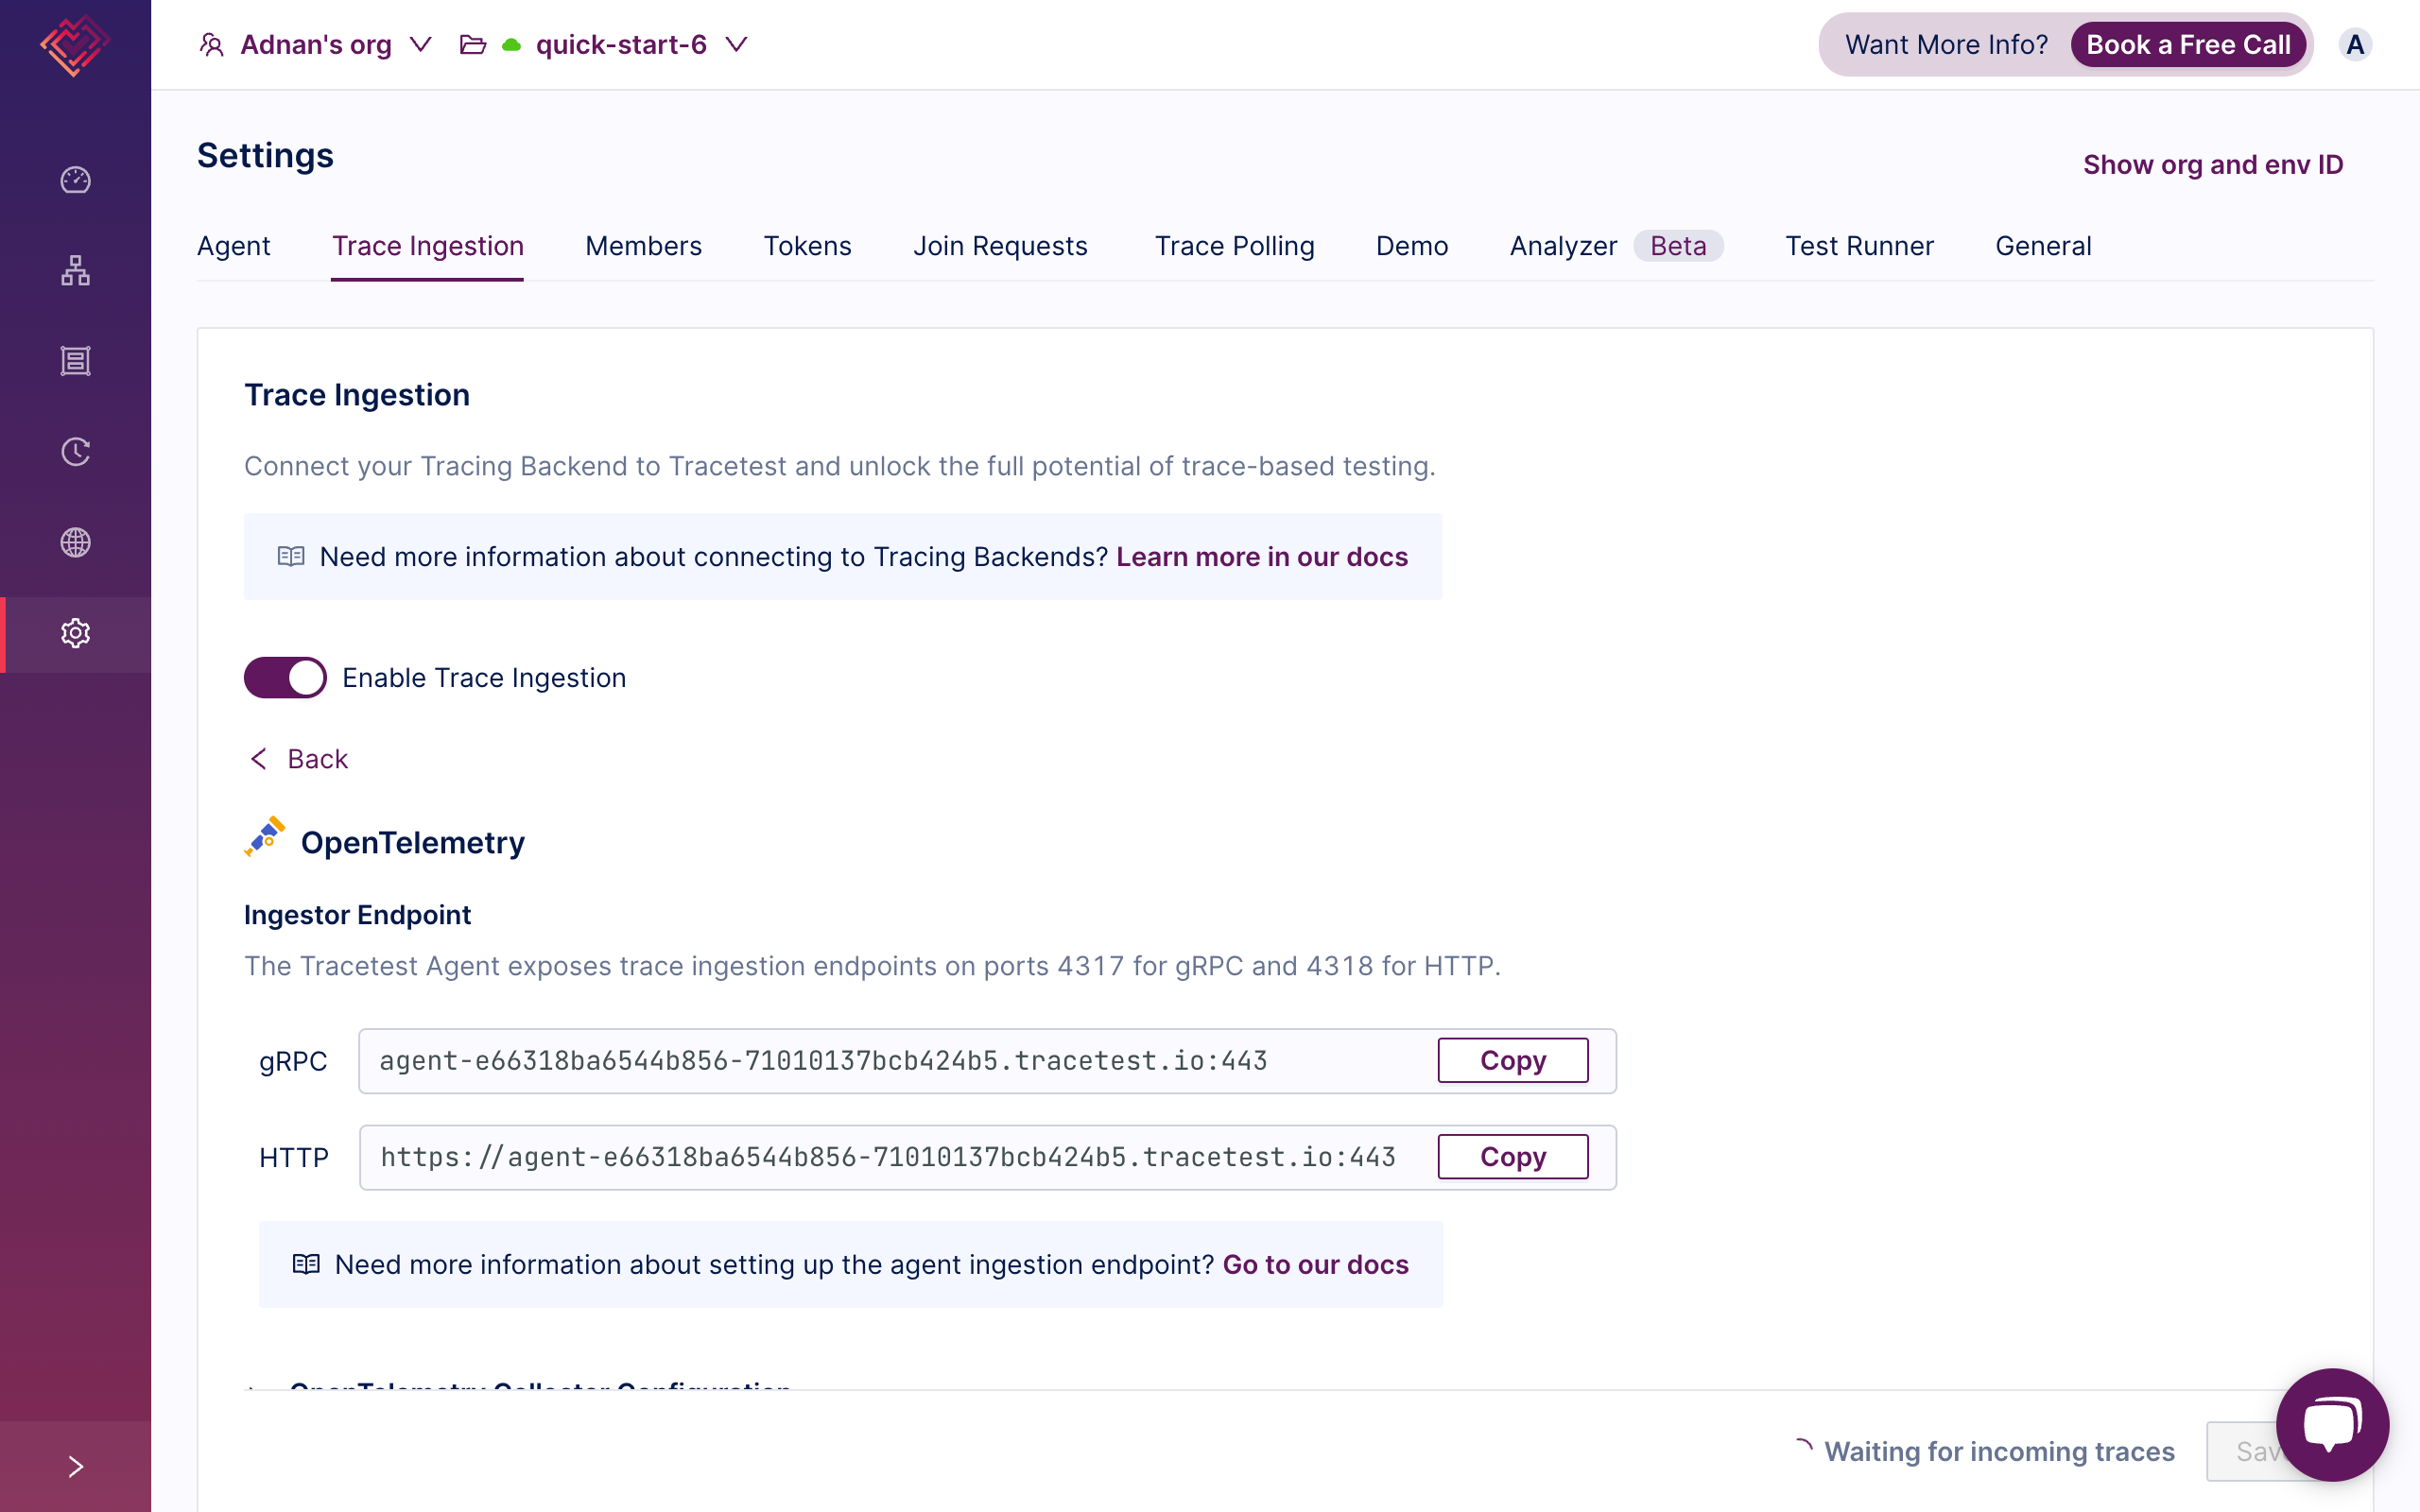
- You’re running Tracetest Cloud Agent in your Tracetest account. You’ll get an endpoint provided to you to configure exporting traces from your apps: `agent-e66318ba6544b856-71010137bcb424b5.tracetest.io:443`
Let’s walk through these steps.
## Running Serverless Apps
Here’s a sample Node.js with the Serverless Framework.
```bash
npm install serverless \
@opentelemetry/api \
@opentelemetry/auto-instrumentations-node \
@opentelemetry/exporter-trace-otlp-grpc \
@opentelemetry/instrumentation \
@opentelemetry/sdk-trace-base \
@opentelemetry/sdk-trace-node
```
```jsx
// handler.js
module.exports.hello = async (event) => {
const response = {
statusCode: 200,
body: JSON.stringify({
message: 'Hello, world!',
}),
};
return response;
};
```
```yaml
# serverless.yaml
service: otel-serverless-node
provider:
name: aws
region: us-east-1
runtime: nodejs18.x
environment:
NODE_OPTIONS: --require ./tracing
functions:
hello:
handler: handler.hello
events:
- httpApi:
path: /
method: get
```
You're using the `NODE_OPTIONS` to preload a file called `tracing.js` I'll show in the section below.
Deploying this to the cloud and connecting it to `your-domain.com` will expose an API that returns “Hello, world!”.
## Using OpenTelemetry Libraries to Export Traces Via gRPC in Serverless Apps
You’ll export traces directly to the Tracetest Cloud Agent running in your Tracetest account.
When enabling Tracetest Cloud Agent an endpoint will be provided to you to configure exporting traces from your apps.
Here’s an example of what it looks like: `https://agent-e66318ba6544b856-71010137bcb424b5.tracetest.io:443`
```jsx
// tracing.js
const api = require('@opentelemetry/api');
const { BatchSpanProcessor } = require('@opentelemetry/sdk-trace-base');
const { OTLPTraceExporter } = require('@opentelemetry/exporter-trace-otlp-grpc');
const { NodeTracerProvider } = require('@opentelemetry/sdk-trace-node');
const { registerInstrumentations } = require('@opentelemetry/instrumentation');
const { getNodeAutoInstrumentations } = require('@opentelemetry/auto-instrumentations-node');
api.diag.setLogger(new api.DiagConsoleLogger(), api.DiagLogLevel.ALL);
const provider = new NodeTracerProvider();
const spanProcessor = new BatchSpanProcessor(
new OTLPTraceExporter({
url: 'https://agent-e66318ba6544b856-71010137bcb424b5.tracetest.io:443',
}),
);
provider.addSpanProcessor(spanProcessor);
provider.register();
registerInstrumentations({
instrumentations: [
getNodeAutoInstrumentations({
'@opentelemetry/instrumentation-aws-lambda': {
disableAwsContextPropagation: true,
},
}),
],
});
```
The `handler.js` stays the same since the `tracing.js` is preloaded.
## Running Tracetest Cloud Agent
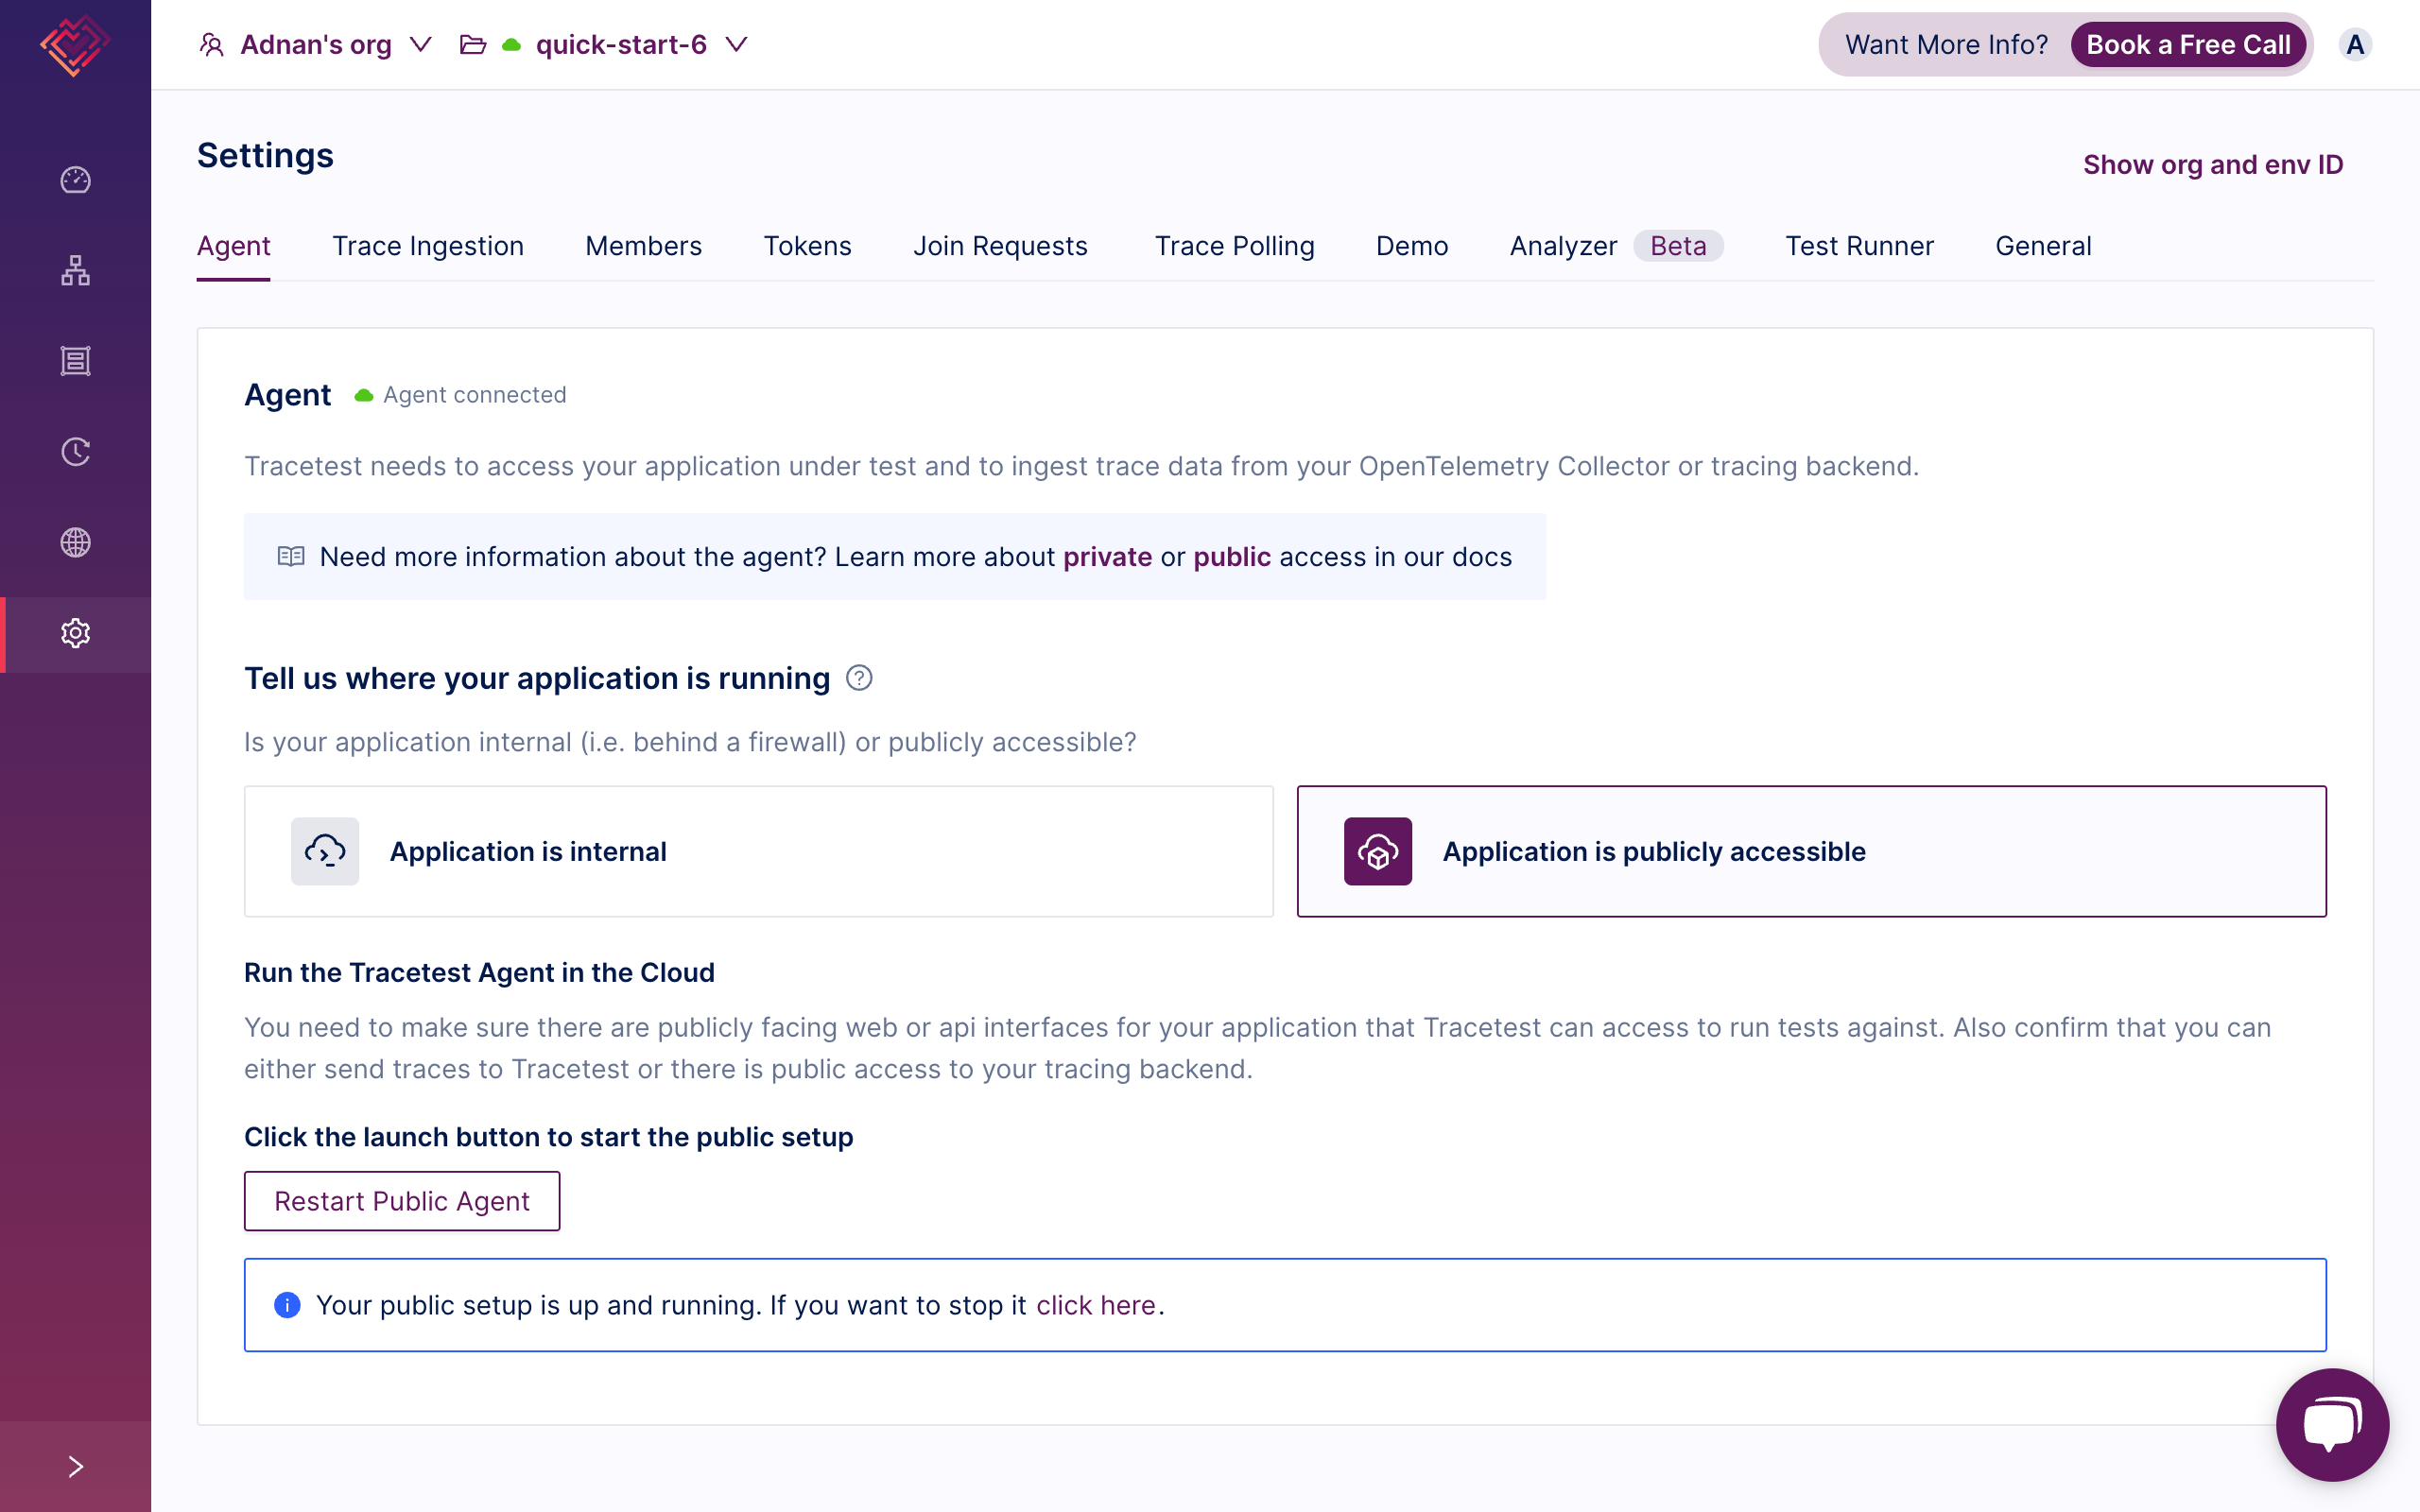
In your Tracetest account, select your desired environment, go into settings, select "Application is publicly accessible”, and enable “Trace Ingestion” with OpenTelemetry.
### Configure Trace Ingestion for a Serverless Environment
This will show you an Ingestor Endpoint where you will export traces from your serverless apps. Use this endpoint in your OpenTelemetry library trace exporter. The Tracetest Cloud Agent is configured to directly ingest traces via the SSL port `443` for both gRPC and HTTP. Make sure to use `https://` in the URL field.
### Run Your First Trace-based Test in a Serverless Environment
You can now run tests against your publicly accessible apps running in serverless environments via its domain name `https://your-domain.com` by going to Tracetest and creating a new HTTP test.
1. Click create a test and select HTTP.
2. Add `https://your-domain.com` in the URL field.
3. Click Run. You’ll see the response data right away.
4. The rest of the steps are identical to the examples above!
## Frequently Asked Question and Common Problems
Trace ingestion with OpenTelemetry Collector:
- You can set the OpenTelemetry libraries to export traces to a central OpenTelemetry Collector and forward traces to Tracetest Agent from there.
- It’s common to use a central OpenTelemetry Collector with multiple pipelines. [View the Tracetest docs here](https://docs.tracetest.io/configuration/connecting-to-data-stores/opentelemetry-collector) to follow a guide on configuring an OpenTelemetry Collector with Tracetest.
**Trace ingestion issues:**
- Ensure your OpenTelemetry trace exporter configuration is correct and the Tracetest Agent is running and accessible.
- It’s a common issue to misconfigure the trace exporter URL by not prefixing it with `http://` when using gRPC or not suffixing it with `/v1/traces` in case of using HTTP.
**Test creation difficulties:**
- Verify you're using the correct URL for your application in the test configuration.
- It’s a common issue to use an incorrect URL when creating tests against your apps. This is often seen when not running the app and the Tracetest Agent on the same network. If your app is running on `localhost` , you will also need to run your Tracetest Agent on `localhost`. The same applies to using Docker or Kubernetes.
**Assertion failures:**
- Double-check your test assertions against the actual trace data and adjust as needed.
**Performance concerns:**
- Monitor system resources and consider scaling your Tracetest Agent deployment if necessary.
**Integrations with tracing backends and observability tools:**
- View the [Tracetest documentation](https://docs.tracetest.io/configuration/connecting-to-data-stores/overview#supported-tracing-backends) for specific guidance on integrating with different tools and observability tools.
## How to Start Trace-based Testing Your Own Apps?
In conclusion, trace-based testing with Tracetest offers a powerful approach to quality assurance that integrates seamlessly with modern observability practices. By leveraging distributed tracing, you can create more robust, reliable, and efficient tests that provide deeper insights into application behavior and performance.
Throughout this guide, I wanted to show you how to set up Tracetest in various environments, from local development to containerized applications and Kubernetes deployments. You’ve seen how to configure OpenTelemetry for exporting traces from your apps and ingesting the traces into Tracetest. The cherry on top was to learn how to make assertions against both response and trace data.
I hope this guide will help you get started with Cloud-based Managed Tracetest.
Visit [https://app.tracetest.io](https://app.tracetest.io) to create your account and start your journey towards more effective, insightful, and efficient testing. With Tracetest, you'll not only catch bugs faster but also gain a deeper understanding of your entire system's performance.
Also, please feel free to join our [Slack community](https://dub.sh/tracetest-community), give [Tracetest a star on GitHub](https://github.com/kubeshop/tracetest), or schedule a [time to chat 1:1](https://calendly.com/ken-kubeshop/tracetest-walkthrough).
.jpg)
.avif)
.avif)