
Adding OpenTelemetry Metrics in Your Go App
.avif)

This guide will describe how our team added OpenTelemetry metrics to Tracetest and how you can do the same with your Go app.
Table of Contents
When releasing a product, things can go wrong. Even if you prepare beforehand. When deploying something to production, it’s probably the first time that a version of your application will be running for days without being restarted. This scenario will unfortunately bring up issues that you will not see until then, such as memory leaks, dependencies failing randomly, and networking issues. The list goes on and on.
Without having metrics to cover those cases, it is almost impossible to detect and fix these issues before they happen. That’s why having metrics is important, you want to know beforehand if something is going to fail or at least get notified if something is broken.
In this guide, I’m going to describe how our team added metrics to [Tracetest](https://tracetest.io/) and how you can do the same with your application.
## Types of Metrics
Before starting, it’s important to understand the three types of metrics that you can have:
1. Counter
2. Gauge
3. Histogram
### Counter
A counter is a metric where you can only add positive values. It’s useful for keeping track of the number of times that something happened. Some examples are:
- Number of events from a queue.
- Number of errors in the REST API.
- Number of bytes transferred.
### Gauge
A gauge is useful for storing non-additive values over time. It can be used to keep track of resources used or how many concurrent operations are being executed. Some examples are:
- Amount of RAM used by the application.
- Number of active database connections.
- Number of active HTTP connections.
### Histogram
A histogram is very useful for sampling values and analyzing them. Think of a histogram as a Gauge, but capable of organizing the values into buckets while also keeping track of the number of values and their sum. It’s usually used with values that can be statistically meaningful. Some examples are:
- Duration of an HTTP endpoint execution.
- Size of HTTP request payloads.
> I’m going to focus on histograms, but this doesn’t mean the other types of metrics are less important.
>
## Configuring OpenTelemetry Metrics
The very first step is to install the OpenTelemetry Go libraries in your project:
```bash
go get go.opentelemetry.io/otel \
go.opentelemetry.io/otel/metric \
go.opentelemetry.io/otel/sdk \
go.opentelemetry.io/otel/exporters/otlp/otlpmetric/otlpmetricgrpc
```
Next, you will need to create a `metric.Meter` which is the interface responsible for creating your metric meters. Those are the actual objects needed to record the metrics from your application:
```go
// telemetry/metrics.go
package telemetry
import (
"fmt"
"context"
"go.opentelemetry.io/otel/exporters/otlp/otlpmetric/otlpmetricgrpc"
"go.opentelemetry.io/otel/sdk/resource"
"go.opentelemetry.io/otel/metric"
semconv "go.opentelemetry.io/otel/semconv/v1.21.0"
metricsdk "go.opentelemetry.io/otel/sdk/metric"
)
// NewMeter creates a new metric.Meter that can create any metric reporter
// you might want to use in your application.
func NewMeter(ctx context.Context) (metric.Meter, error) {
provider, err := newMeterProvider(ctx)
if err != nil {
return nil, fmt.Errorf("could not create meter provider: %w", err)
}
return provider.Meter("tracetest"), nil
}
// newMeterProvcider initialize the application resource, connects to the
// OpenTelemetry Collector and configures the metric poller that will be used
// to collect the metrics and send them to the OpenTelemetry Collector.
func newMeterProvider(ctx context.Context) (metric.MeterProvider, error) {
// Interval which the metrics will be reported to the collector
interval := 10 * time.Second
resource, err := getResource()
if err != nil {
return nil, fmt.Errorf("could not get resource: %w", err)
}
collectorExporter, err := getOtelMetricsCollectorExporter(ctx, exporterConfig)
if err != nil {
return nil, fmt.Errorf("could not get collector exporter: %w", err)
}
periodicReader := metricsdk.NewPeriodicReader(collectorExporter,
metricsdk.WithInterval(interval),
)
provider := metricsdk.NewMeterProvider(
metricsdk.WithResource(resource),
metricsdk.WithReader(periodicReader),
)
return provider, nil
}
// getResource creates the resource that describes our application.
//
// You can add any attributes to your resource and all your metrics
// will contain those attributes automatically.
//
// There are some attributes that are very important to be added to the resource:
// 1. hostname: allows you to identify host-specific problems
// 2. version: allows you to pinpoint problems in specific versions
func getResource() (*resource.Resource, error) {
resource, err := resource.Merge(
resource.Default(),
resource.NewWithAttributes(
semconv.SchemaURL,
semconv.ServiceNameKey.String("tracetest"),
),
)
if err != nil {
return nil, fmt.Errorf("could not merge resources: %w", err)
}
return resource
}
// getOtelMetricsCollectorExporter creates a metric exporter that relies on
// an OpenTelemetry Collector running on "localhost:4317".
func getOtelMetricsCollectorExporter(ctx context.Context) (metricsdk.Exporter, error) {
ctx, cancel := context.WithTimeout(ctx, 5*time.Second)
defer cancel()
exporter, err := otlpmetricgrpc.New(ctx,
otlpmetricgrpc.WithEndpoint("localhost:4317"),
otlpmetricgrpc.WithCompressor("gzip"),
otlpmetricgrpc.WithInsecure(),
)
if err != nil {
return nil, fmt.Errorf("could not create metric exporter: %w", err)
}
return exporter, nil
}
```
Now that you can create your own `metric.Meter`, you can start adding metrics to your system and receive them in your OpenTelemetry Collector. Let’s look at two examples of metrics to illustrate how you can use it.
### Allocated Memory Metric
One of the first infrastructure metrics you should consider is the `allocated memory` because it can help you identify memory leaks.
```go
// main.go
package main
import (
"context"
"time"
"runtime"
"go.opentelemetry.io/otel/metric"
)
func main() {
meter, err := telemetry.NewMeter(context.Background())
if err != nil {
panic(err)
}
go collectMachineResourceMetrics(meter)
// your startup code here
// ...
}
// collectMachineResourceMetrics gets some important resource usage from time
// to time and report metrics about it:
func collectMachineResourceMetrics(meter metric.Meter) {
period := 5 * time.Second
ticker := time.NewTicker(period)
var Mb uint64 = 1_048_576 // number of bytes in a MB
for {
select {
case <-ticker.C:
// This will be executed every "period" of time passes
meter.Float64ObservableGauge(
"process.allocated_memory",
metric.WithFloat64Callback(
func(ctx context.Context, fo metric.Float64Observer) error {
var memStats runtime.MemStats
runtime.ReadMemStats(&memStats)
allocatedMemoryInMB := float64(memStats.Alloc) / float64(Mb)
fo.Observe(allocatedMemoryInMB)
return nil
}
)
)
}
}
}
```
In this example, the application will report a `process.allocated_memory` every `5 seconds`. This will collect the number of bytes that are allocated by the application, convert it to Megabytes and register it as part of the metric.
### HTTP Endpoint Metrics
Another simple metric that is very useful is to have a histogram of the latency of all your HTTP requests. In this case, you can use an `http.Middleware` to apply this metric to all your endpoints at the same time without the need to modify them one by one. In my case, I use `mux` to handle HTTP endpoints, so this example will also rely on `mux`:
```go
// http/middleware/metrics.go
package http
import (
"net/http"
"go.opentelemetry.io/otel/metric"
)
// NewMetricMiddleware creates the middleware that will record all
// HTTP-related metrics.
func NewMetricMiddleware(meter metric.Meter) mux.MiddlewareFunc {
return func(next http.Handler) http.Handler {
durationHistogram, _ := meter.Int64Histogram("http.server.latency", metric.WithUnit("ms"))
return &httpMetricMiddleware{
next: next,
requestDurationHistogram: durationHistogram,
}
}
}
// httpMetricMiddleware executes the HTTP endpoint while keeping track
// of how much time it took to execute and add some extra routing information
// to all metrics
type httpMetricMiddleware struct {
next http.Handler
requestDurationHistogram metric.Int64Histogram
}
func (m *httpMetricMiddleware) ServeHTTP(w http.ResponseWriter, r *http.Request) {
// Golang's http implementation doesn't allow us to retrieve the raw response
// so we have to use a capturer in order to have access to any response
// data. In this case, we want to capture the response HTTP status code.
rw := NewStatusCodeCapturerWriter(w)
initialTime := time.Now()
m.next.ServeHTTP(rw, r)
duration := time.Since(initialTime)
route := mux.CurrentRoute(r)
// It's important to use `route.GetPathTemplate` to get the unformated
// path: For example, we get "/orders/{id}" instead of "/orders/2" or
// "/orders/1234"
pathTemplate, _ := route.GetPathTemplate()
metricAttributes := attribute.NewSet(
attribute.String(semconv.AttributeHTTPRoute, pathTemplate),
attribute.String(semconv.AttributeHTTPMethod, r.Method),
attribute.Int(semconv.AttributeHTTPStatusCode, rw.statusCode),
)
m.requestDurationHistogram.Record(
r.Context(),
duration.Milliseconds(),
metric.WithAttributeSet(metricAttributes),
)
}
// NewStatusCodeCapturerWriter creates an HTTP.ResponseWriter capable of
// capture the HTTP response status code.
func NewStatusCodeCapturerWriter(w http.ResponseWriter) *responseWriter {
return &responseWriter{w, http.StatusOK}
}
type responseWriter struct {
http.ResponseWriter
statusCode int
}
func (w *responseWriter) WriteHeader(code int) {
w.statusCode = code
w.ResponseWriter.WriteHeader(code)
}
```
Now, add the middleware to your router:
```go
// main.go
package main
func main() {
router := mux.NewRouter()
// Your routes
// router.HandleFunc("/", index)
// router.HandleFunc("/orders", ordersEndpoint)
// Add the metric middleware as the first middleware of the router
// so it can keep track of how much time the endpoint takes to execute
// with more precision.
router.Use(middleware.NewMetricMiddleware(meter))
// Add all other middlewares after this place
// router.Use(analyticsMiddleware)
// router.Use(authenticationMiddleware)
}
```
## Sending Metrics to an Analytics Tool
For Tracetest, we chose [Grafana Cloud](https://grafana.com/products/cloud/) to store our metrics. But this doesn’t affect our code in any way because we are forwarding all our metrics to the [OpenTelemetry Collector](https://opentelemetry.io/docs/collector/). We just need to configure the Collector to send those metrics to Grafana Cloud’s Prometheus endpoint.
```yaml
receivers:
otlp:
protocols:
grpc:
http:
processors:
batch/metrics:
send_batch_size: 650
exporters:
prometheusremotewrite/grafanacloud:
# When you set your prometheus account in Grafana cloud, you will see
# these three variables. Just replace them or start your collector with
# the environment variables set.
endpoint: https://${PROMETHEUS_USER}:${PROMETHEUS_PASSWORD}@${PROMETHEUS_URL}
tls:
insecure: true
# This will make your metrics to have all the attributes from the
# resource you configured when creating the metrics provider.
resource_to_telemetry_conversion:
enabled: true
services:
pipelines:
metrics/grafana:
receivers: [otlp]
processors: [batch/metrics]
exporters: [prometheusremotewrite/grafanacloud]
```
With the OpenTelemetry Collector configured, you will be able to see all your metrics in Grafana Cloud and can start building dashboards and alerts based on them.
## Using OpenTelemetry Metrics in Your Daily Work
You have an application that is currently reporting metrics, but what is the benefit? What can be achieved by instrumenting your applications? Let's delve into this subject and explain some of the benefits you can derive from using your metrics.
### Grafana Cloud
After your application starts sending metrics to Grafana, you can start building dashboards with visualizations like this:
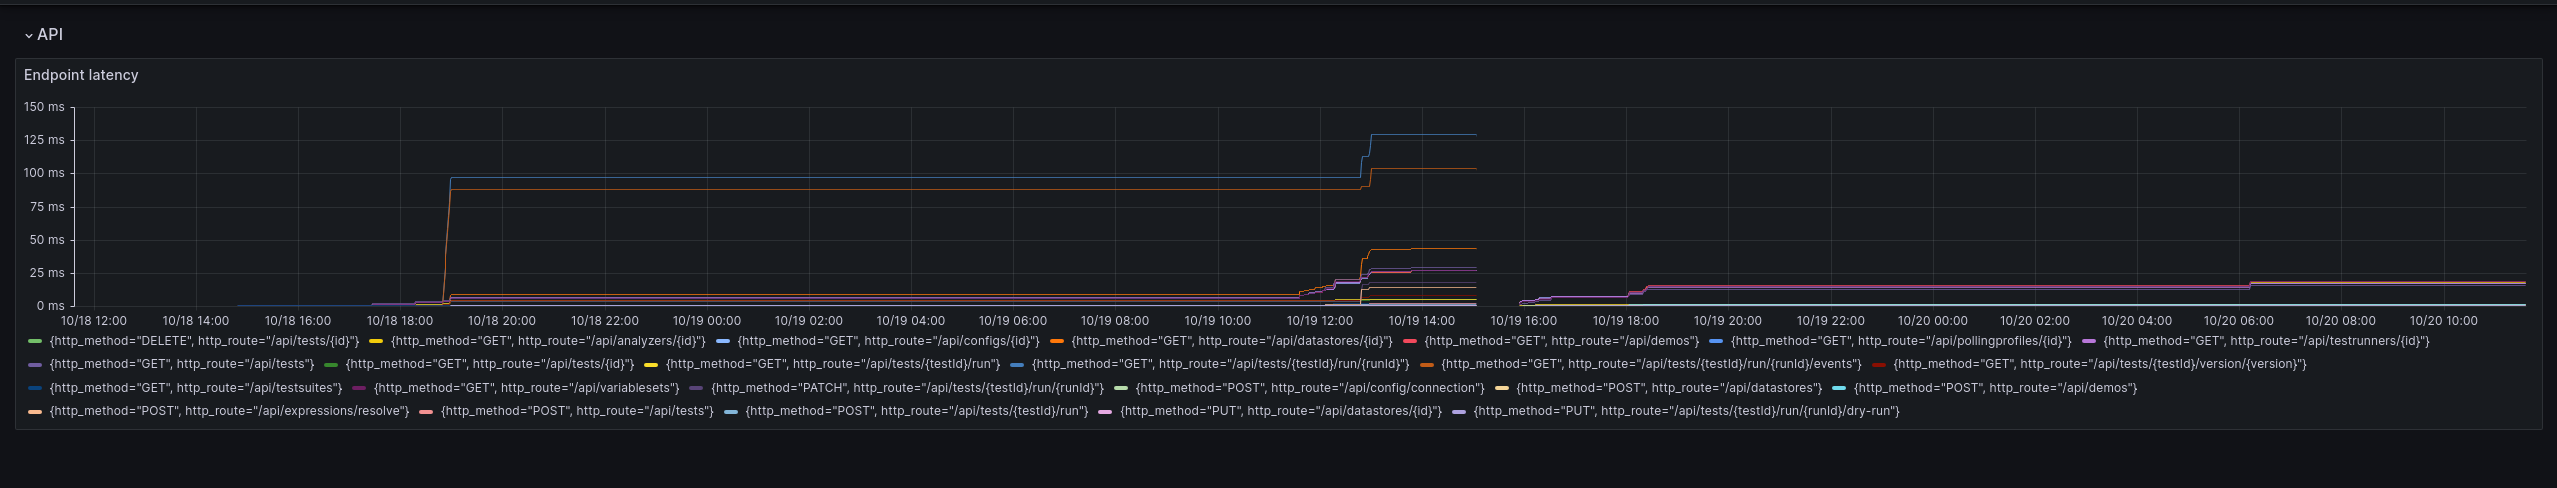
It shows the average latency of each endpoint in Tracetest in the last 2 days. It’s very useful for detecting if our application’s performance is degrading before it can actually impact our users.
To create a dashboard with this kind of visualization, you can follow [Grafana’s guide](https://grafana.com/docs/grafana/latest/getting-started/build-first-dashboard/) and use the following query:
```sql
avg by(http_method, http_route) (http_server_latency_milliseconds_bucket{server_environment="production",http_route!=""})
```
Other than just visualizing your metrics, you can also benefit from using them actively to alert your team about anomalies. Alarms let you set a threshold of how long API requests should take and in case of an incident and your API latency surpasses the threshold for more than 5 minutes, you will be notified.
This allows you to detect problems in new deployments of your application, resource starvation, or dependencies degrading before these issues affect your users. The more meaningful metrics you have, the better your dashboards and alerts will be.
## Why you should use OpenTelemetry Metrics
Metrics are crucial for building reliable products. When facing technical problems, most users of a product will not report the issue and just leave. Having a way of identifying those problems before they happen or at least getting notified when the problems start happening is crucial for quickly fixing your product before losing users because of preventable errors.
## What’s next?
Would you like to learn more about Tracetest and what it brings to the table? Check the [docs](https://docs.tracetest.io/examples-tutorials/recipes/running-tracetest-with-dynatrace) and try it out today by [downloading](https://tracetest.io/download) it today!
Also, please feel free to join our [Slack community](https://dub.sh/tracetest-community), give [Tracetest a star on GitHub](https://github.com/kubeshop/tracetest), or schedule a [time to chat 1:1](https://calendar.app.google/8qHAomjQZDKKDARd8).
.jpg)
.avif)
.avif)