
Monitoring and Testing Cloud Native APIs with Grafana
.avif)

This tutorial provides step-by-step instructions for setting up & using Docker Compose to run Grafana, Tempo and Tracetest to monitor & test APIs.
Table of Contents
[Grafana](https://grafana.com/), when combined with distributed tracing, is widely used for troubleshooting and diagnosing problems. What if you could use the data captured in the distributed trace as part of your testing strategy to prevent errors from reaching production in the first place?
By combining [Grafana Tempo](https://github.com/grafana/tempo) with [Tracetest](https://github.com/kubeshop/tracetest), you can create a robust solution for monitoring and testing APIs with distributed tracing.
This tutorial guides you through setting up and using Docker Compose to run Grafana Cloud and Tracetest, enabling effective monitoring and testing of your APIs.
> [See the full code for the example app you’ll build in the GitHub repo, here.](https://github.com/kubeshop/tracetest/tree/main/examples/tracetest-grafana-cloud-tempo-pokeshop)
Want to see the demo live? Tune in for the Grafana Office hours!
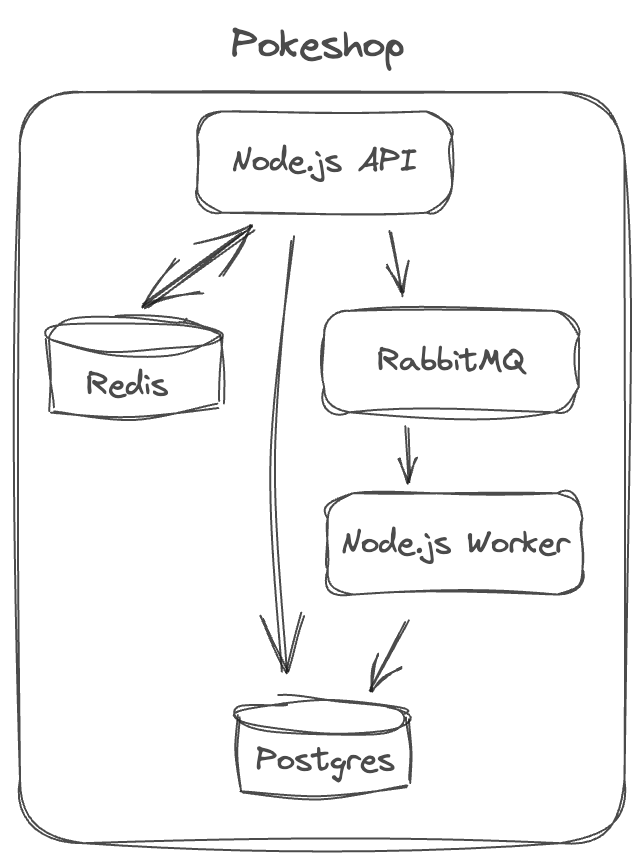
I’ll use a sample microservice app called [Pokeshop](https://docs.tracetest.io/live-examples/pokeshop/overview) to demo distributed tracing and how to forward traces to Grafana Tempo.
It consists of 5 services.
1. Node.js API
1. HTTP
2. gRPC
2. Node.js Worker
3. RabbitMQ (Queue)
4. Redis (Cache)
5. Postgres
I’ve prepared a `docker-compose.yaml` file with the Pokeshop services. Check it out [here](https://github.com/kubeshop/tracetest/blob/main/examples/tracetest-grafana-cloud-tempo-pokeshop/docker-compose.yml).
```yaml
version: "3"
services:
# ...
# Demo
postgres:
image: postgres:14
environment:
POSTGRES_PASSWORD: postgres
POSTGRES_USER: postgres
healthcheck:
test: pg_isready -U "$$POSTGRES_USER" -d "$$POSTGRES_DB"
interval: 1s
timeout: 5s
retries: 60
ports:
- 5432:5432
demo-cache:
image: redis:6
restart: unless-stopped
healthcheck:
test: ["CMD", "redis-cli", "ping"]
interval: 1s
timeout: 3s
retries: 60
demo-queue:
image: rabbitmq:3.8-management
restart: unless-stopped
healthcheck:
test: rabbitmq-diagnostics -q check_running
interval: 1s
timeout: 5s
retries: 60
demo-api:
image: kubeshop/demo-pokemon-api:latest
restart: unless-stopped
pull_policy: always
environment:
REDIS_URL: demo-cache
DATABASE_URL: postgresql://postgres:postgres@postgres:5432/postgres?schema=public
RABBITMQ_HOST: demo-queue
POKE_API_BASE_URL: https://pokeapi.co/api/v2
COLLECTOR_ENDPOINT: http://otel-collector:4317
NPM_RUN_COMMAND: api
ports:
- "8081:8081"
healthcheck:
test: ["CMD", "wget", "--spider", "localhost:8081"]
interval: 1s
timeout: 3s
retries: 60
depends_on:
postgres:
condition: service_healthy
demo-cache:
condition: service_healthy
demo-queue:
condition: service_healthy
demo-worker:
image: kubeshop/demo-pokemon-api:latest
restart: unless-stopped
pull_policy: always
environment:
REDIS_URL: demo-cache
DATABASE_URL: postgresql://postgres:postgres@postgres:5432/postgres?schema=public
RABBITMQ_HOST: demo-queue
POKE_API_BASE_URL: https://pokeapi.co/api/v2
COLLECTOR_ENDPOINT: http://otel-collector:4317
NPM_RUN_COMMAND: worker
depends_on:
postgres:
condition: service_healthy
demo-cache:
condition: service_healthy
demo-queue:
condition: service_healthy
demo-rpc:
image: kubeshop/demo-pokemon-api:latest
restart: unless-stopped
pull_policy: always
environment:
REDIS_URL: demo-cache
DATABASE_URL: postgresql://postgres:postgres@postgres:5432/postgres?schema=public
RABBITMQ_HOST: demo-queue
POKE_API_BASE_URL: https://pokeapi.co/api/v2
COLLECTOR_ENDPOINT: http://otel-collector:4317
NPM_RUN_COMMAND: rpc
ports:
- 8082:8082
healthcheck:
test: ["CMD", "lsof", "-i", "8082"]
interval: 1s
timeout: 3s
retries: 60
depends_on:
postgres:
condition: service_healthy
demo-cache:
condition: service_healthy
demo-queue:
condition: service_healthy
# Demo End
```
### OpenTelemetry Instrumentation in the Pokeshop Microservice App
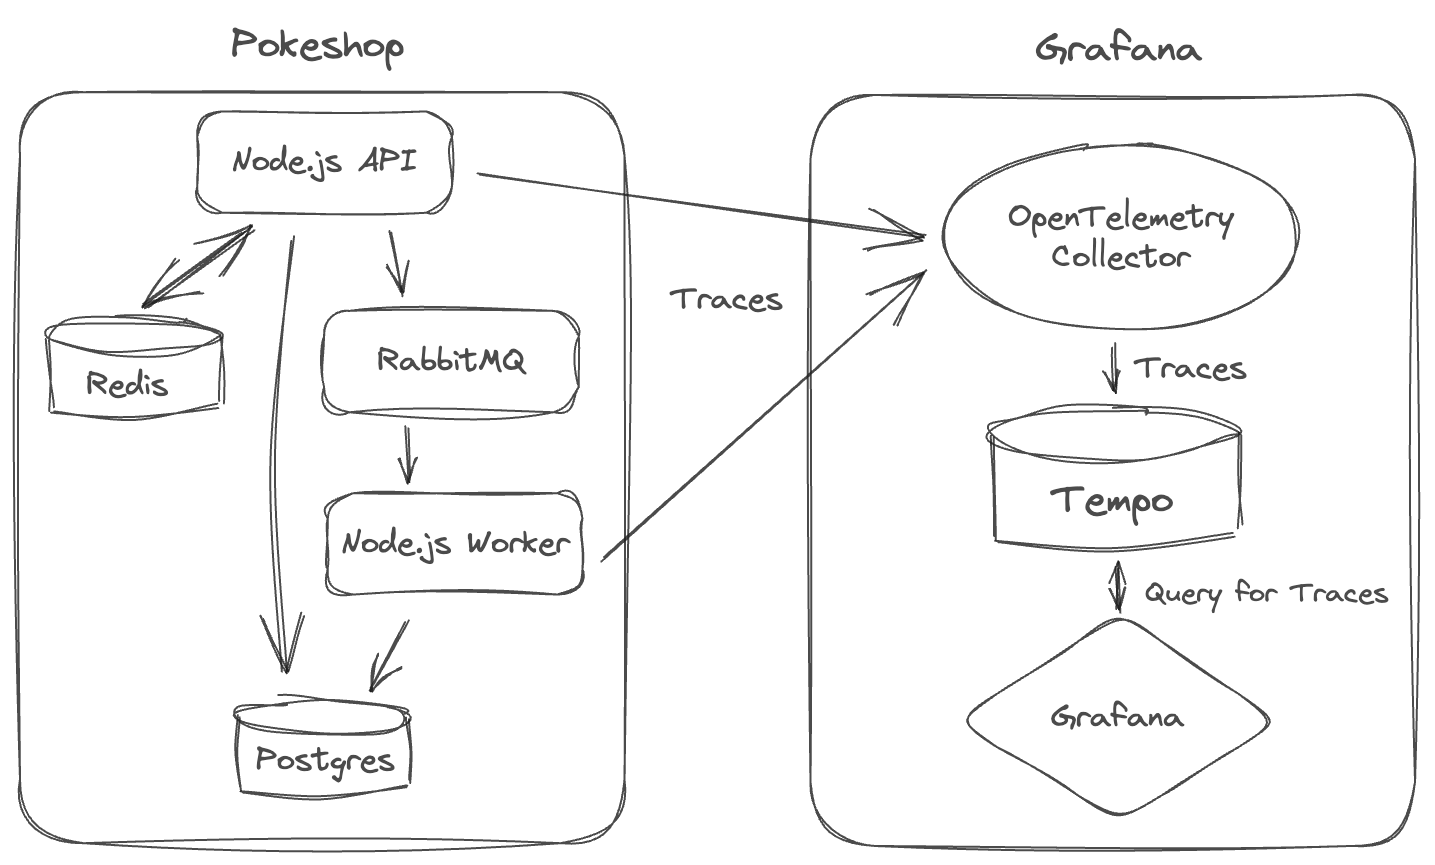
The Pokeshop is configured with OpenTelemetry code instrumentation using the official tracing libraries. These libraries will capture and propagate distributed traces across the Pokeshop microservice app.
The tracing libraries are configured to send traces to OpenTelemetry Collector. The OpenTelemetry Collector will then forward traces to Grafana Tempo. It will be explained in the following section.
By [opening the `tracing.ts`](https://github.com/kubeshop/pokeshop/blob/master/api/src/telemetry/tracing.ts) you can see how to set up the OpenTelemetry SDKs to instrument your code. It contains all the required modules and helper functions.
```javascript
// tracing.ts
import * as opentelemetry from '@opentelemetry/api';
import { NodeSDK } from '@opentelemetry/sdk-node';
import { OTLPTraceExporter } from '@opentelemetry/exporter-trace-otlp-grpc';
import { Resource } from '@opentelemetry/resources';
import * as dotenv from 'dotenv';
import { SemanticResourceAttributes } from '@opentelemetry/semantic-conventions';
import { SpanStatusCode } from '@opentelemetry/api';
dotenv.config(); // Loaded from .env
const { COLLECTOR_ENDPOINT = '', SERVICE_NAME = 'pokeshop' } = process.env;
// [rest of the file]
// ...
```
I’m using an env var for the OpenTelemetry Collector endpoint. See the [`.env` file here.](https://github.com/kubeshop/pokeshop/blob/master/api/.env)
```jsx
DATABASE_URL="postgresql://ashketchum:squirtle123@localhost:5434/pokeshop?schema=public"
REDIS_URL=localhost
RABBITMQ_HOST=localhost
POKE_API_BASE_URL=https://pokeapi.co/api/v2
COLLECTOR_ENDPOINT=http://localhost:4317
APP_PORT=8081
RPC_PORT=8082
```
The rest of the `tracing.ts` file contains helper methods for creating trace spans.
```jsx
// tracing.js
// [...]
let globalTracer: opentelemetry.Tracer | null = null;
async function createTracer(): Promise<opentelemetry.Tracer> {
const collectorExporter = new OTLPTraceExporter({
url: COLLECTOR_ENDPOINT,
});
const sdk = new NodeSDK({
traceExporter: collectorExporter,
instrumentations: [],
});
sdk.addResource(
new Resource({
[SemanticResourceAttributes.SERVICE_NAME]: SERVICE_NAME,
})
);
await sdk.start();
process.on('SIGTERM', () => {
sdk
.shutdown()
.then(
() => console.log('SDK shut down successfully'),
err => console.log('Error shutting down SDK', err)
)
.finally(() => process.exit(0));
});
const tracer = opentelemetry.trace.getTracer(SERVICE_NAME);
globalTracer = tracer;
return globalTracer;
}
async function getTracer(): Promise<opentelemetry.Tracer> {
if (globalTracer) {
return globalTracer;
}
return createTracer();
}
async function getParentSpan(): Promise<opentelemetry.Span | undefined> {
const parentSpan = opentelemetry.trace.getSpan(opentelemetry.context.active());
if (!parentSpan) {
return undefined;
}
return parentSpan;
}
async function createSpan(
name: string,
parentSpan?: opentelemetry.Span | undefined,
options?: opentelemetry.SpanOptions | undefined
): Promise<opentelemetry.Span> {
const tracer = await getTracer();
if (parentSpan) {
const context = opentelemetry.trace.setSpan(opentelemetry.context.active(), parentSpan);
return createSpanFromContext(name, context, options);
}
return tracer.startSpan(name);
}
async function createSpanFromContext(
name: string,
ctx: opentelemetry.Context,
options?: opentelemetry.SpanOptions | undefined
): Promise<opentelemetry.Span> {
const tracer = await getTracer();
if (!ctx) {
return tracer.startSpan(name, options, opentelemetry.context.active());
}
return tracer.startSpan(name, options, ctx);
}
async function runWithSpan<T>(parentSpan: opentelemetry.Span, fn: () => Promise<T>): Promise<T> {
const ctx = opentelemetry.trace.setSpan(opentelemetry.context.active(), parentSpan);
try {
return await opentelemetry.context.with(ctx, fn);
} catch (ex) {
parentSpan.recordException(ex);
parentSpan.setStatus({ code: SpanStatusCode.ERROR });
throw ex;
}
}
export { getTracer, getParentSpan, createSpan, createSpanFromContext, runWithSpan };
```
## Monitoring with Grafana, Tempo and OpenTelemetry Collector
[Grafana Tempo](https://grafana.com/oss/tempo/) is a powerful solution for monitoring and testing APIs using distributed tracing. Tempo provides a highly scalable, cost-effective, and easy-to-use trace data store. It’s optimized for trace visualization with Grafana. With Tempo, you can monitor and test your APIs in real time. This allows you to identify potential bottlenecks or performance issues and respond quickly to ensure the reliability and performance of your APIs. Grafana Cloud has a managed version called [Traces](https://grafana.com/products/cloud/traces/).
In this section, you’ll learn how to configure:
- **Grafana Tempo.** First, you’ll set up Grafana Tempo on Grafana Cloud to receive and store traces from the Pokeshop app. It will need the OpenTelemetry Collector as the main trace receiver and forwarder.
- **OpenTelemetry Collector.** The OpenTelemetry Collector will receive traces from the Pokeshop app and forward them to Grafana Tempo on Grafana Cloud. I'll explain how to configure OpenTelemetry Collector with a Grafana Cloud token.
- **Grafana.** Lastly, I’ll explain how to configure Grafana on Grafana Cloud to read trace data from the Tempo instance in Grafana Cloud.
### Adding OpenTelemetry Collector to Docker Compose
You need to add 2 more services to the Docker Compose.
```yaml
# docker-compose.yaml
# [...]
# OpenTelemetry
otel-collector:
image: otel/opentelemetry-collector-contrib:0.101.0
command:
- "--config"
- "/otel-local-config.yaml"
volumes:
- ./collector.config.yaml:/otel-local-config.yaml
# OpenTelemetry End
```
For these two services, you are loading one dedicated config file. Keep the config file in the same directory as the `docker-compose.yaml` file. Let’s move on to the configuration!
### OpenTelemetry Collector Configuration
The OpenTelemetry Collector is configured via a config file. Let’s configure it to ingest traces on the default HTTP and GRPC ports via the OTLP protocol.
- HTTP: `4318`
- gRPC: `4317`
Create a file called `collector.config.yaml`.
```yaml
# collector.config.yaml
receivers:
otlp:
protocols:
grpc:
http:
exporters:
# ...
otlp:
endpoint: tempo-us-central1.grafana.net:443
headers:
authorization: Basic <base64 encoded username:password>
service:
pipelines:
traces:
receivers: [otlp]
exporters: [logging, otlp]
```
The `exporter` config defines the location you’ll send traces to. In this case, Tempo. The Tempo ingestion endpoint uses OTLP as well and uses the TLS port , `443`.
Now, let’s configure Tempo to receive the traces, and create an auth token for the OpenTelemetry Collector config.
### Grafana Cloud Tempo Configuration
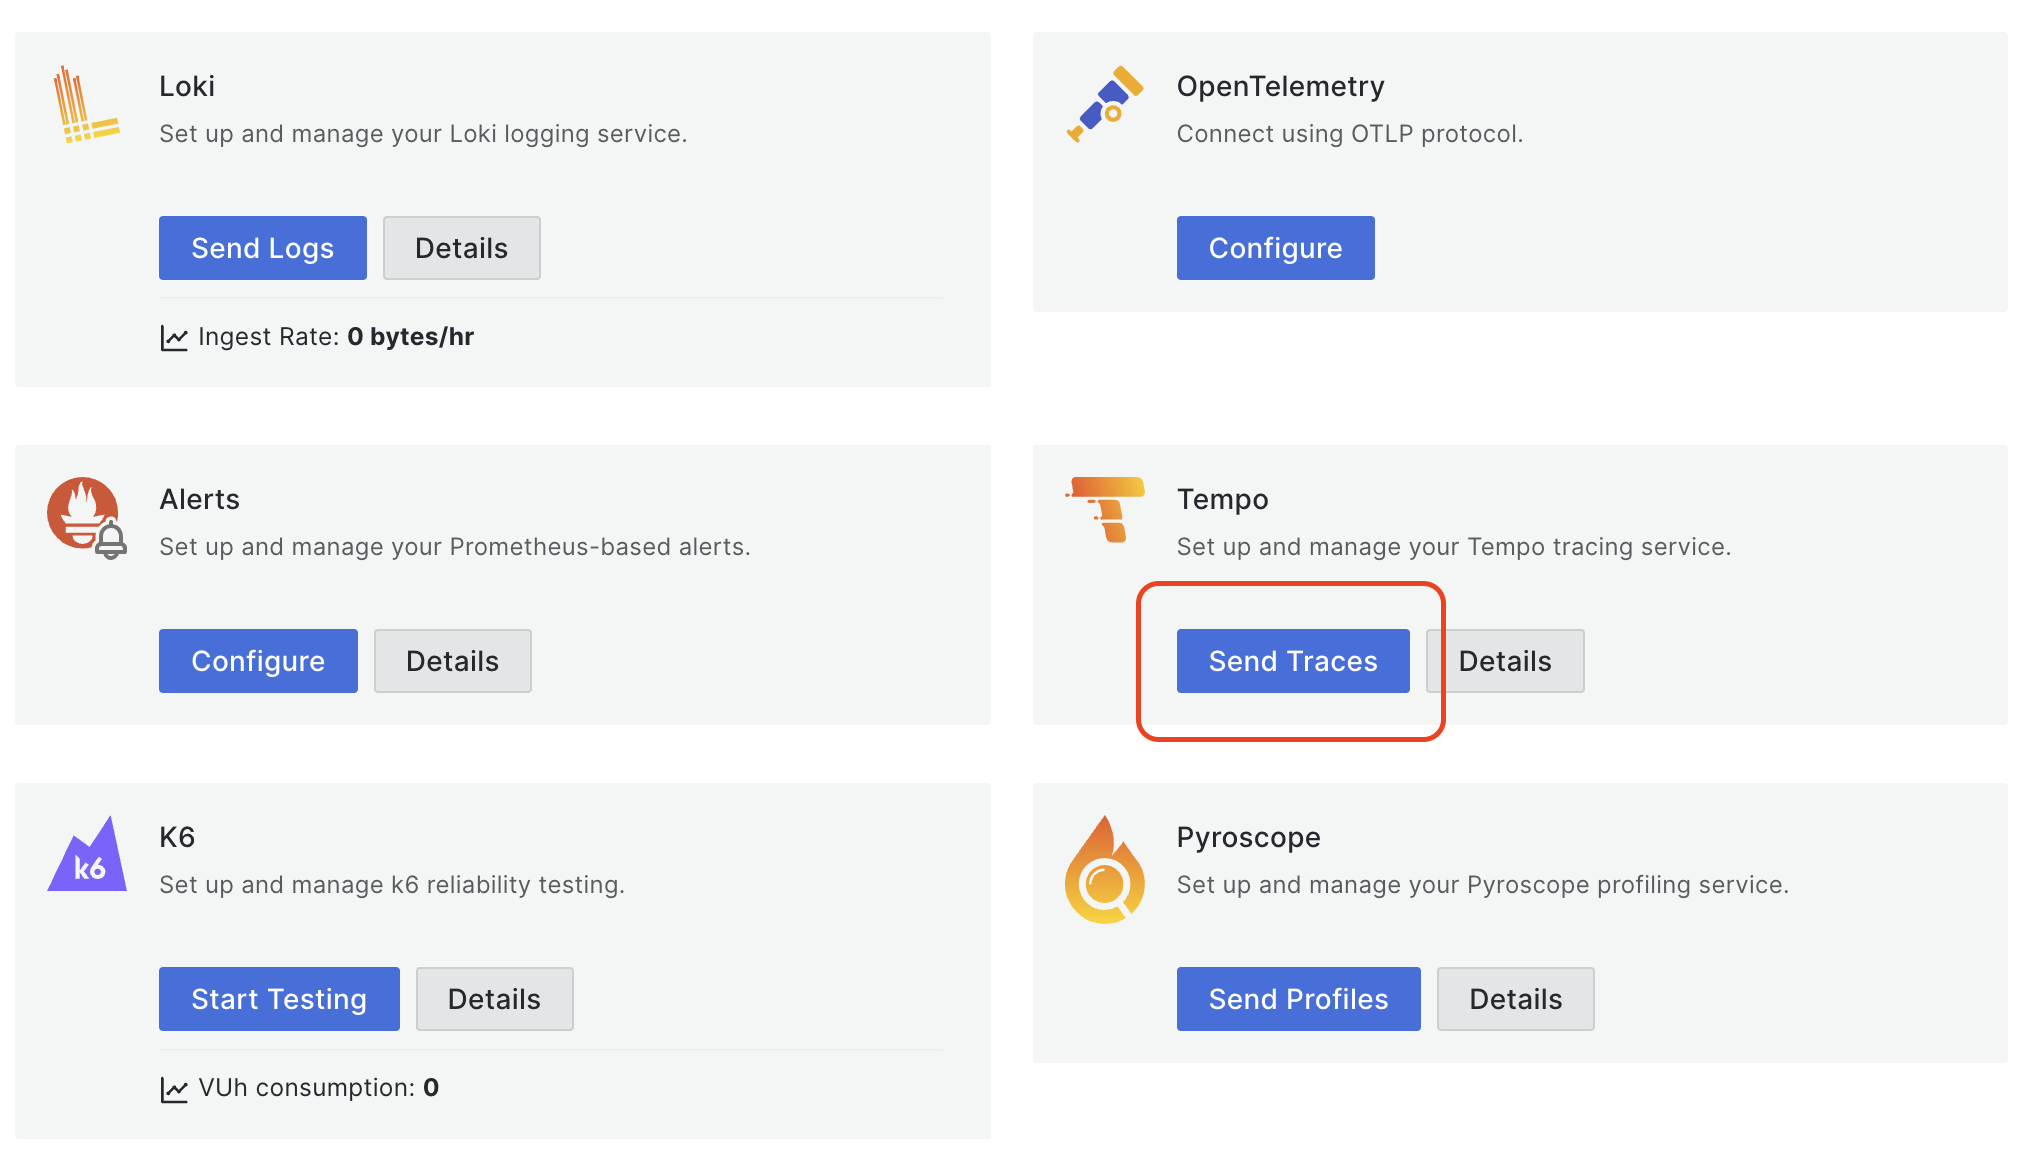
Get your Grafana Cloud URL and credentials for Tempo under the My Account page. Choose the stack, then **Send Traces** to view your username and URL.
Generate a new API Token. Make sure it has **write** access.
The `authorization: Basic <base64 encoded username:password>` from the OpenTelemetry Collector config file needs an HTTP Authorization header in Basic format. The Authorization header is configured with Basic scheme, which is a base64-encoded version of the text `<user>:<password>`.
Here's an easy way of base64 encoding the `<user>:<password>`.
```bash
echo -n "<your user id>:<your api key>" | base64
```
> Read [this blog post](https://grafana.com/blog/2021/04/13/how-to-send-traces-to-grafana-clouds-tempo-service-with-opentelemetry-collector/) for a more detailed explanation.
Next, explore the trace data in Grafana.
### Configuring Grafana Data Sources
To access your Grafana instance in Grafana Cloud, go back to your account and click **Launch**.
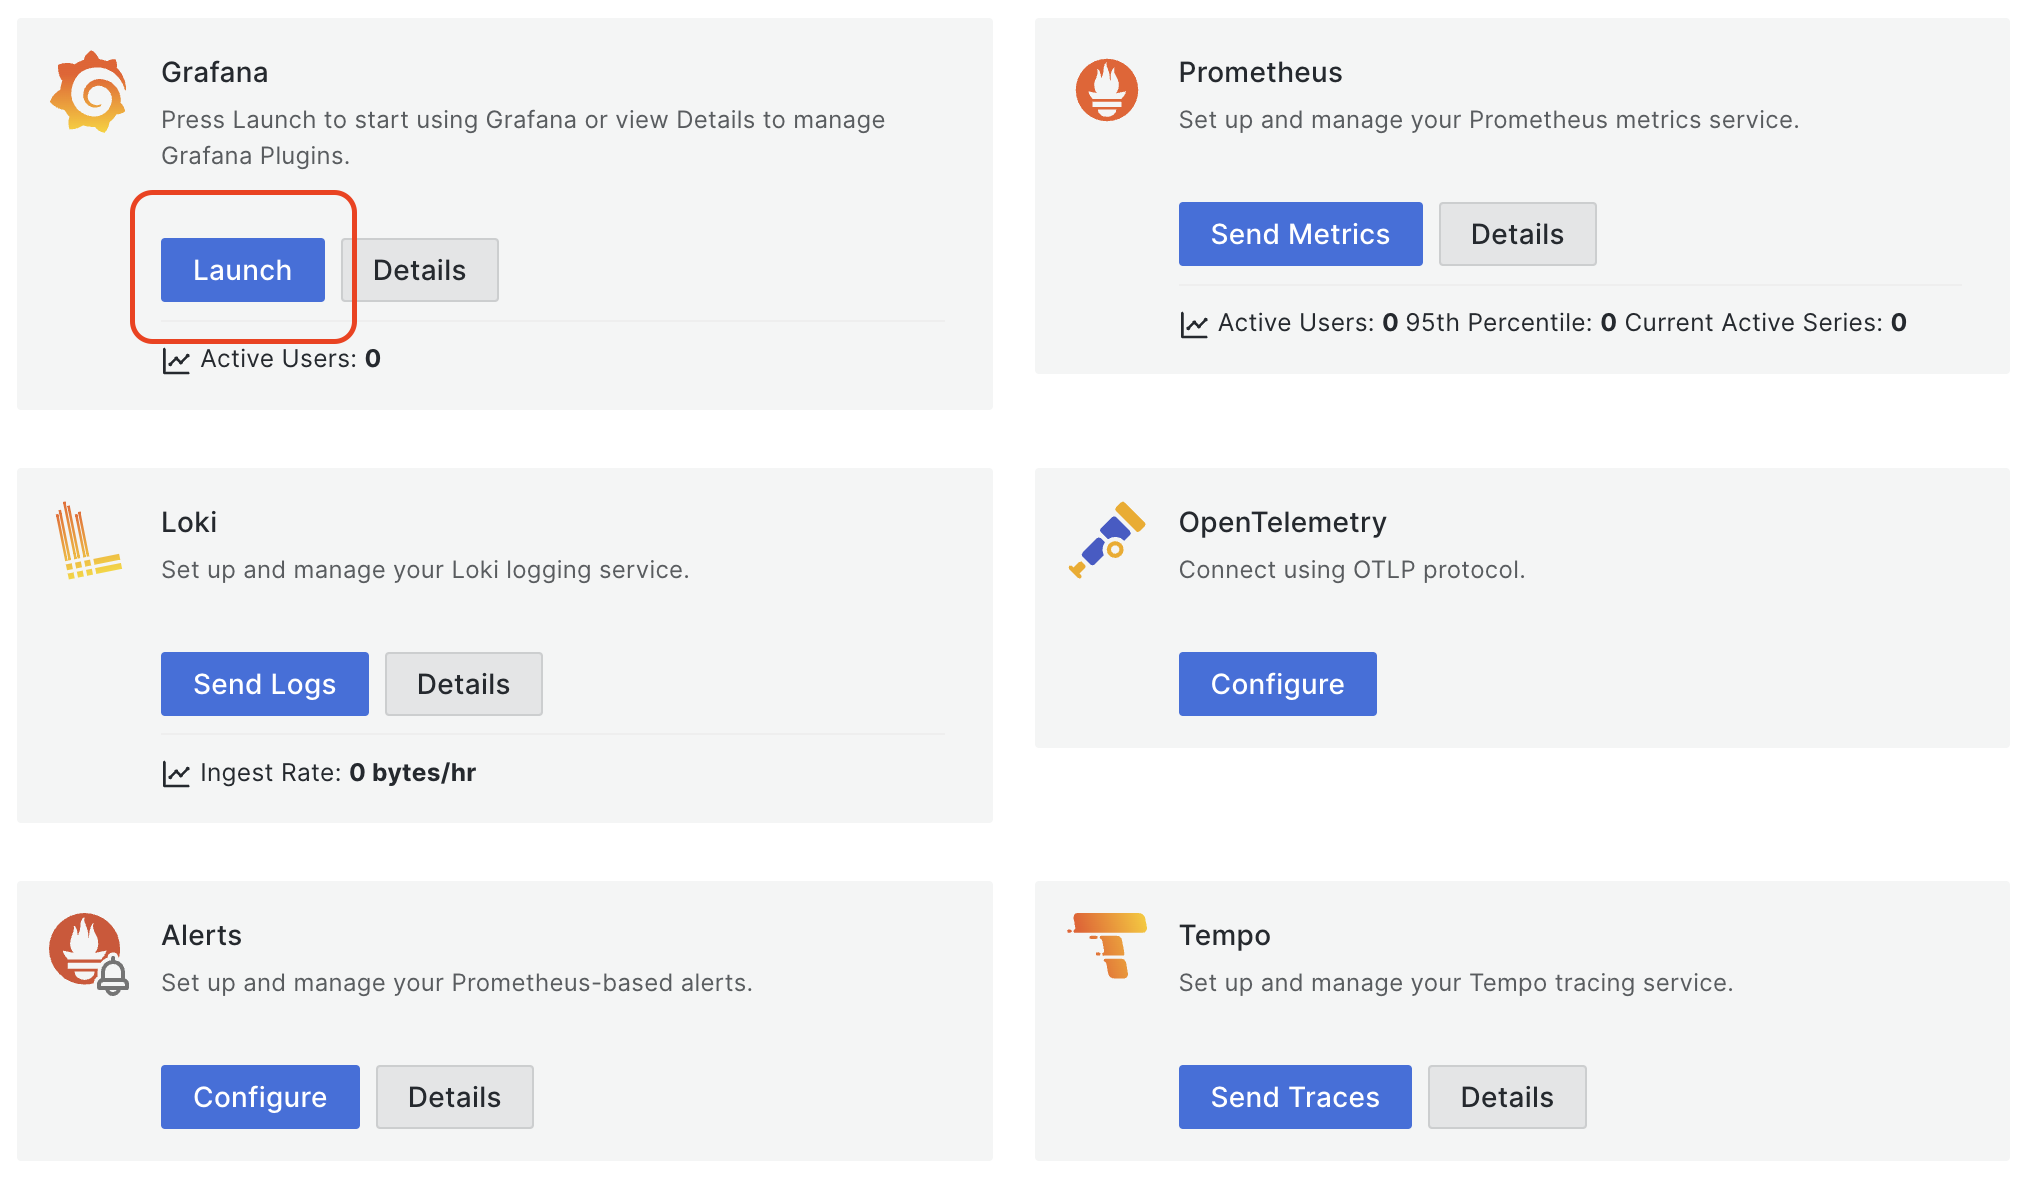
The Tempo instance is configured to show traces is Grafana by default.
### View Traces in Grafana
With OpenTelemetry Collector added, trace ingestion tokens added, and Grafana Cloud configured, start your Docker Compose.
```yaml
docker compose up --build
```
Trigger a simple cURL request to generate a few traces.
```bash
curl -d '{"id":6}' -H "Content-Type: application/json" -X POST http://localhost:8081/pokemon/import
```
Open your Grafana Cloud instance. Choose Tempo and the TraceQL tab.
Add and run the query below.
```yaml
{ name="POST /pokemon/import" }
```
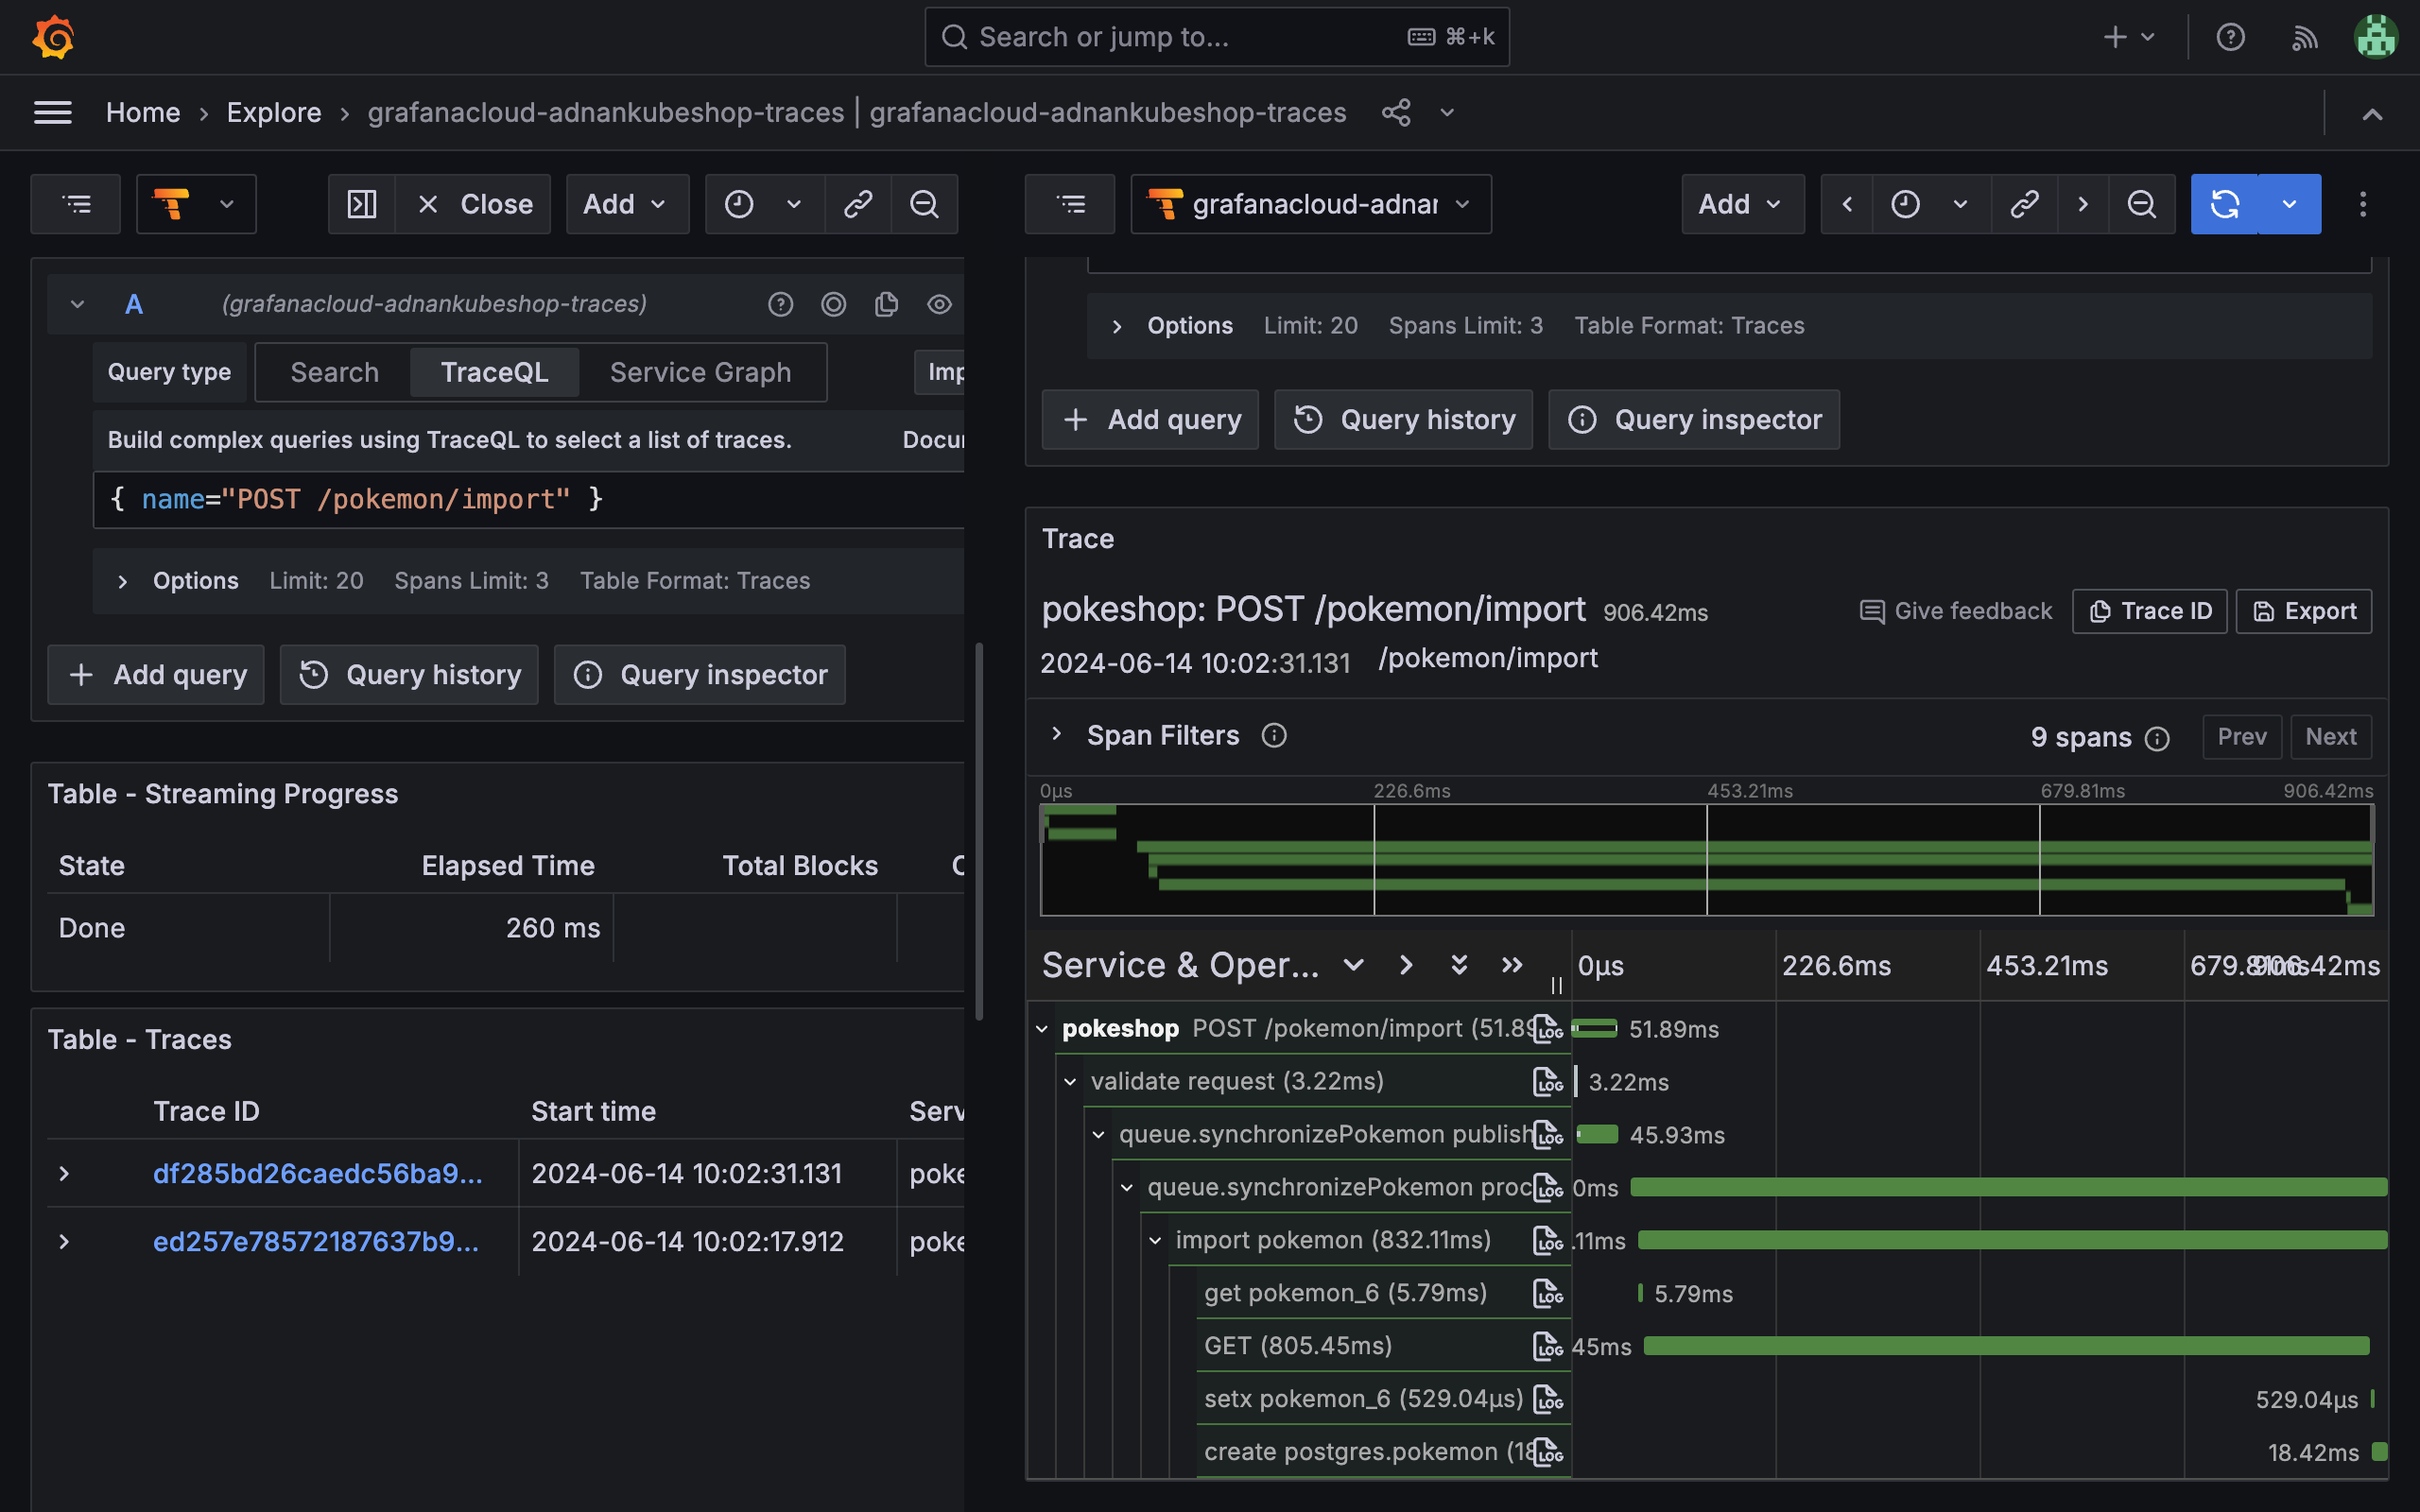
Choose a trace from here and it will open up in the panel on the right. With OpenTelemetry instrumentation and Grafana configuration, you can elevate your trace debugging and validation, as well as build integration tests to validate API behavior.
## Trace Validation and Integration Testing with Tracetest
[Tracetest](https://tracetest.io/) is a trace-based testing tool for building integration and end-to-end tests in minutes using [OpenTelemetry](https://opentelemetry.io/docs/getting-started/) traces. It’s also [part of the CNCF landscape](https://github.com/kubeshop/tracetest).
Tracetest uses your existing distributed traces to power trace-based testing with assertions against your trace data at every point of the request transaction.
You only need to point Tracetest to your Tempo instance, or send traces to Tracetest directly!
With Tracetest you can:
- Define tests and assertions against every single microservice that a trace goes through.
- Work with your existing distributed tracing solution, allowing you to build tests based on your already instrumented system.
- Define multiple transaction triggers, such as a GET against an API endpoint, a GRPC request, etc.
- Define assertions against both the response and trace data, ensuring both your response and the underlying processes worked correctly, quickly, and without errors.
- Save and run the tests manually or via CI build jobs with the Tracetest CLI.
### Install and Configure Tracetest
[Tracetest is a cloud-based managed platform](https://docs.tracetest.io/getting-started/overview), that connects to your apps with a tiny [private](https://docs.tracetest.io/concepts/agent) or [public](https://docs.tracetest.io/concepts/cloud-agent) agent.
[Tracetest Agent](https://docs.tracetest.io/configuration/agent) runs as a container in your Docker Compose stack, just like the OpenTelemetry Collector.
Start by signing in to the Tracetest app. Create a [API token](https://docs.tracetest.io/concepts/environment-tokens) and [Tracetst Agent API key](https://docs.tracetest.io/concepts/agent) in the **Settings**. Create an `.env` file with these values.
```bash
TRACETEST_API_KEY="<YOUR_TRACETEST_API_KEY>"
TRACETEST_API_TOKEN="<YOUR_TRACETEST_TOKEN>"
```
Add Tracetest Agent to the `docker-compose.yaml`.
```yaml
# [...]
# Cloud-based Managed Tracetest
tracetest-agent:
image: kubeshop/tracetest-agent:latest
command:
- "--mode=verbose"
environment:
# Find the Agent API Key here: https://docs.tracetest.io/configuration/agent
- TRACETEST_API_KEY=${TRACETEST_API_KEY}
# Tracetest End
```
Restart Docker Compose.
```yaml
docker compose down
docker compose up --build
```
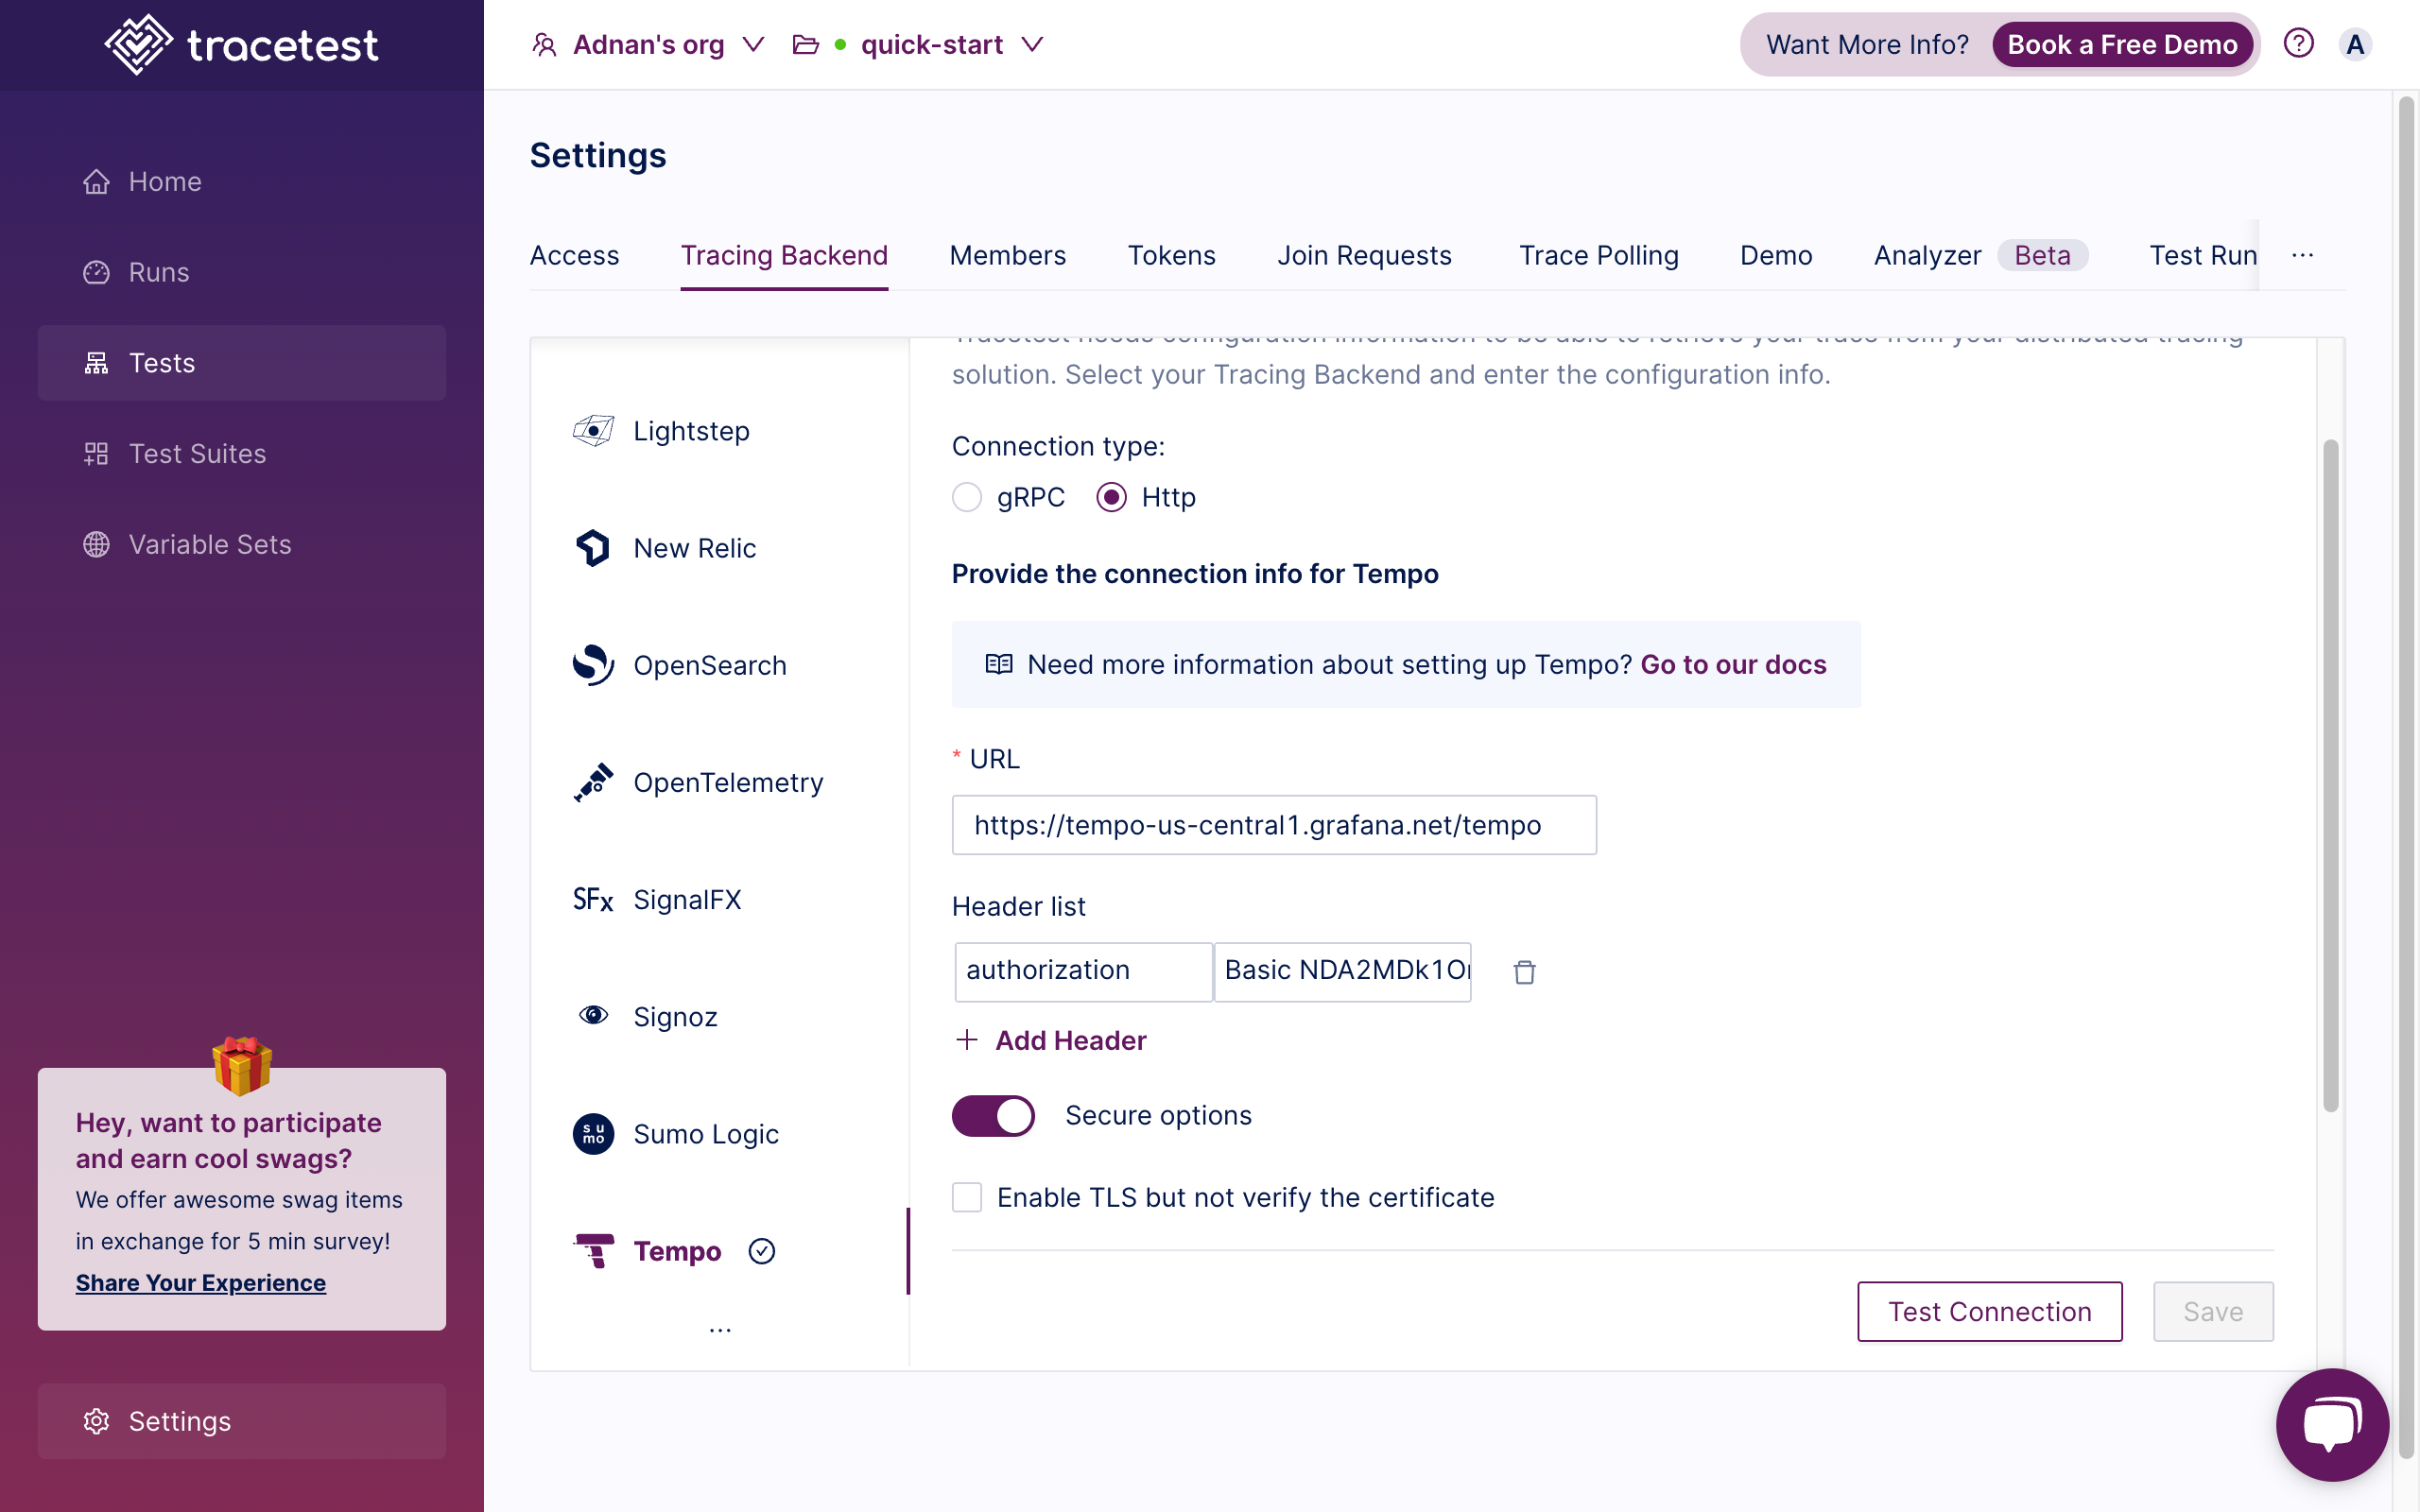
Connecting Tracetest to Grafana Tempo can be done in the Web UI. Navigate to `https://app.tracetest.io` and open the tracing backend settings. Select Tempo and set the endpoint to your Grafana Cloud Tempo instance `https://tempo-us-central1.grafana.net/tempo`. Generate a Grafana API Token for the `authorization` header, but this time make sure it has **read** access.
Optionally, you can also do it with a YAML file. Create a `tracetest-tracing-backend.yaml` file like this.
```yaml
# tracetest-tracing-backend.yaml
type: DataStore
spec:
id: tempo-cloud
name: Tempo
type: tempo
tempo:
type: http
http:
url: https://tempo-us-central1.grafana.net/tempo
headers:
authorization: Basic <base64 encoded username:password>
tls: {}
```
Apply the YAML file with the Tracetest CLI after you've added your base64 encoded `authorization` header.
```bash
tracetest config -t <YOUR_API_TOKEN>
tracetest apply datastore -f ./tracetest-tracing-backend.yaml
```
This is how Tracetest queries for traces from Tempo when running integration tests.
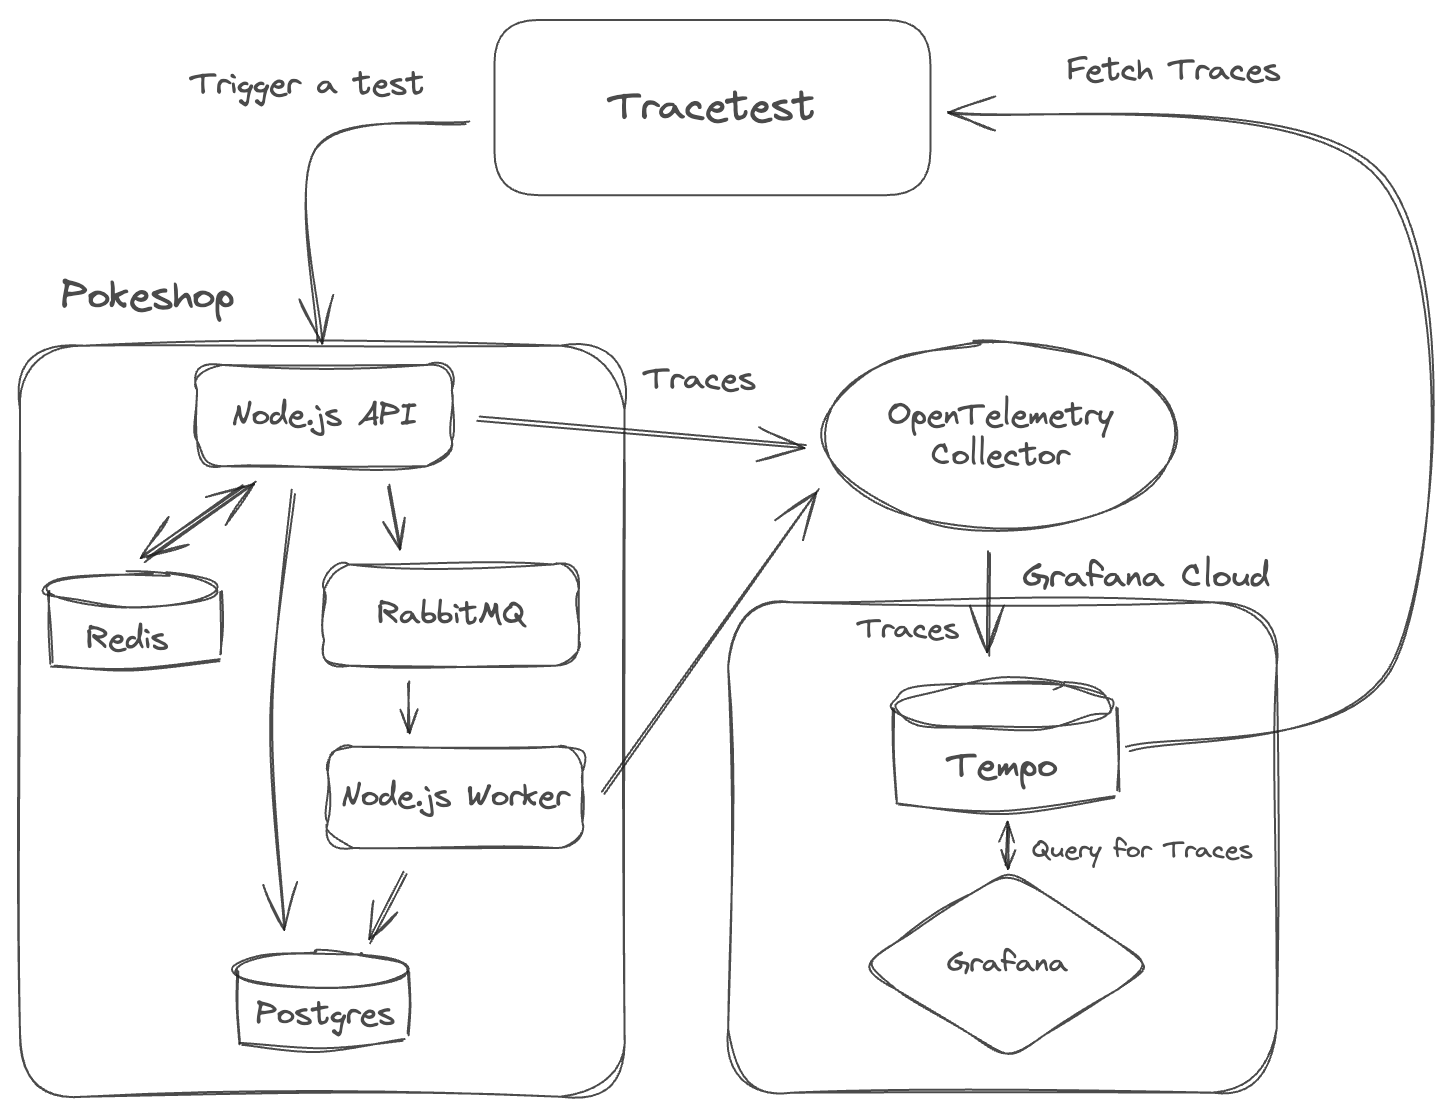
Let’s jump into validating the traces generated by the Pokeshop API.
### Validate API Traces Against OpenTelemetry Rules and Standards
The Tracetest Analyzer is the first-ever tool to analyze traces! It can validate traces, identify patterns, and fix issues with code instrumentation. It’s the easy way to adhere to OpenTelemetry rules and standards to ensure high-quality telemetry data.
Let’s create a new test in Tracetest and run the Analyzer.
To create a test in Tracetest, see the [docs](https://docs.tracetest.io/web-ui/creating-tests) or follow these instructions:
1. Click `Create`
2. Click `Create New Test`
3. Select `HTTP Request`
4. Add a name for your test
5. The URL field should be `POST` `http://demo-api:8081/pokemon/import`
6. The Header list should be `Content-Type: application/json`
7. The Request Body `json` with the content `{"id":6}`
8. Click `Create and Run`
This will trigger the test and display a distributed trace in the `Trace` tab and run validations against it.
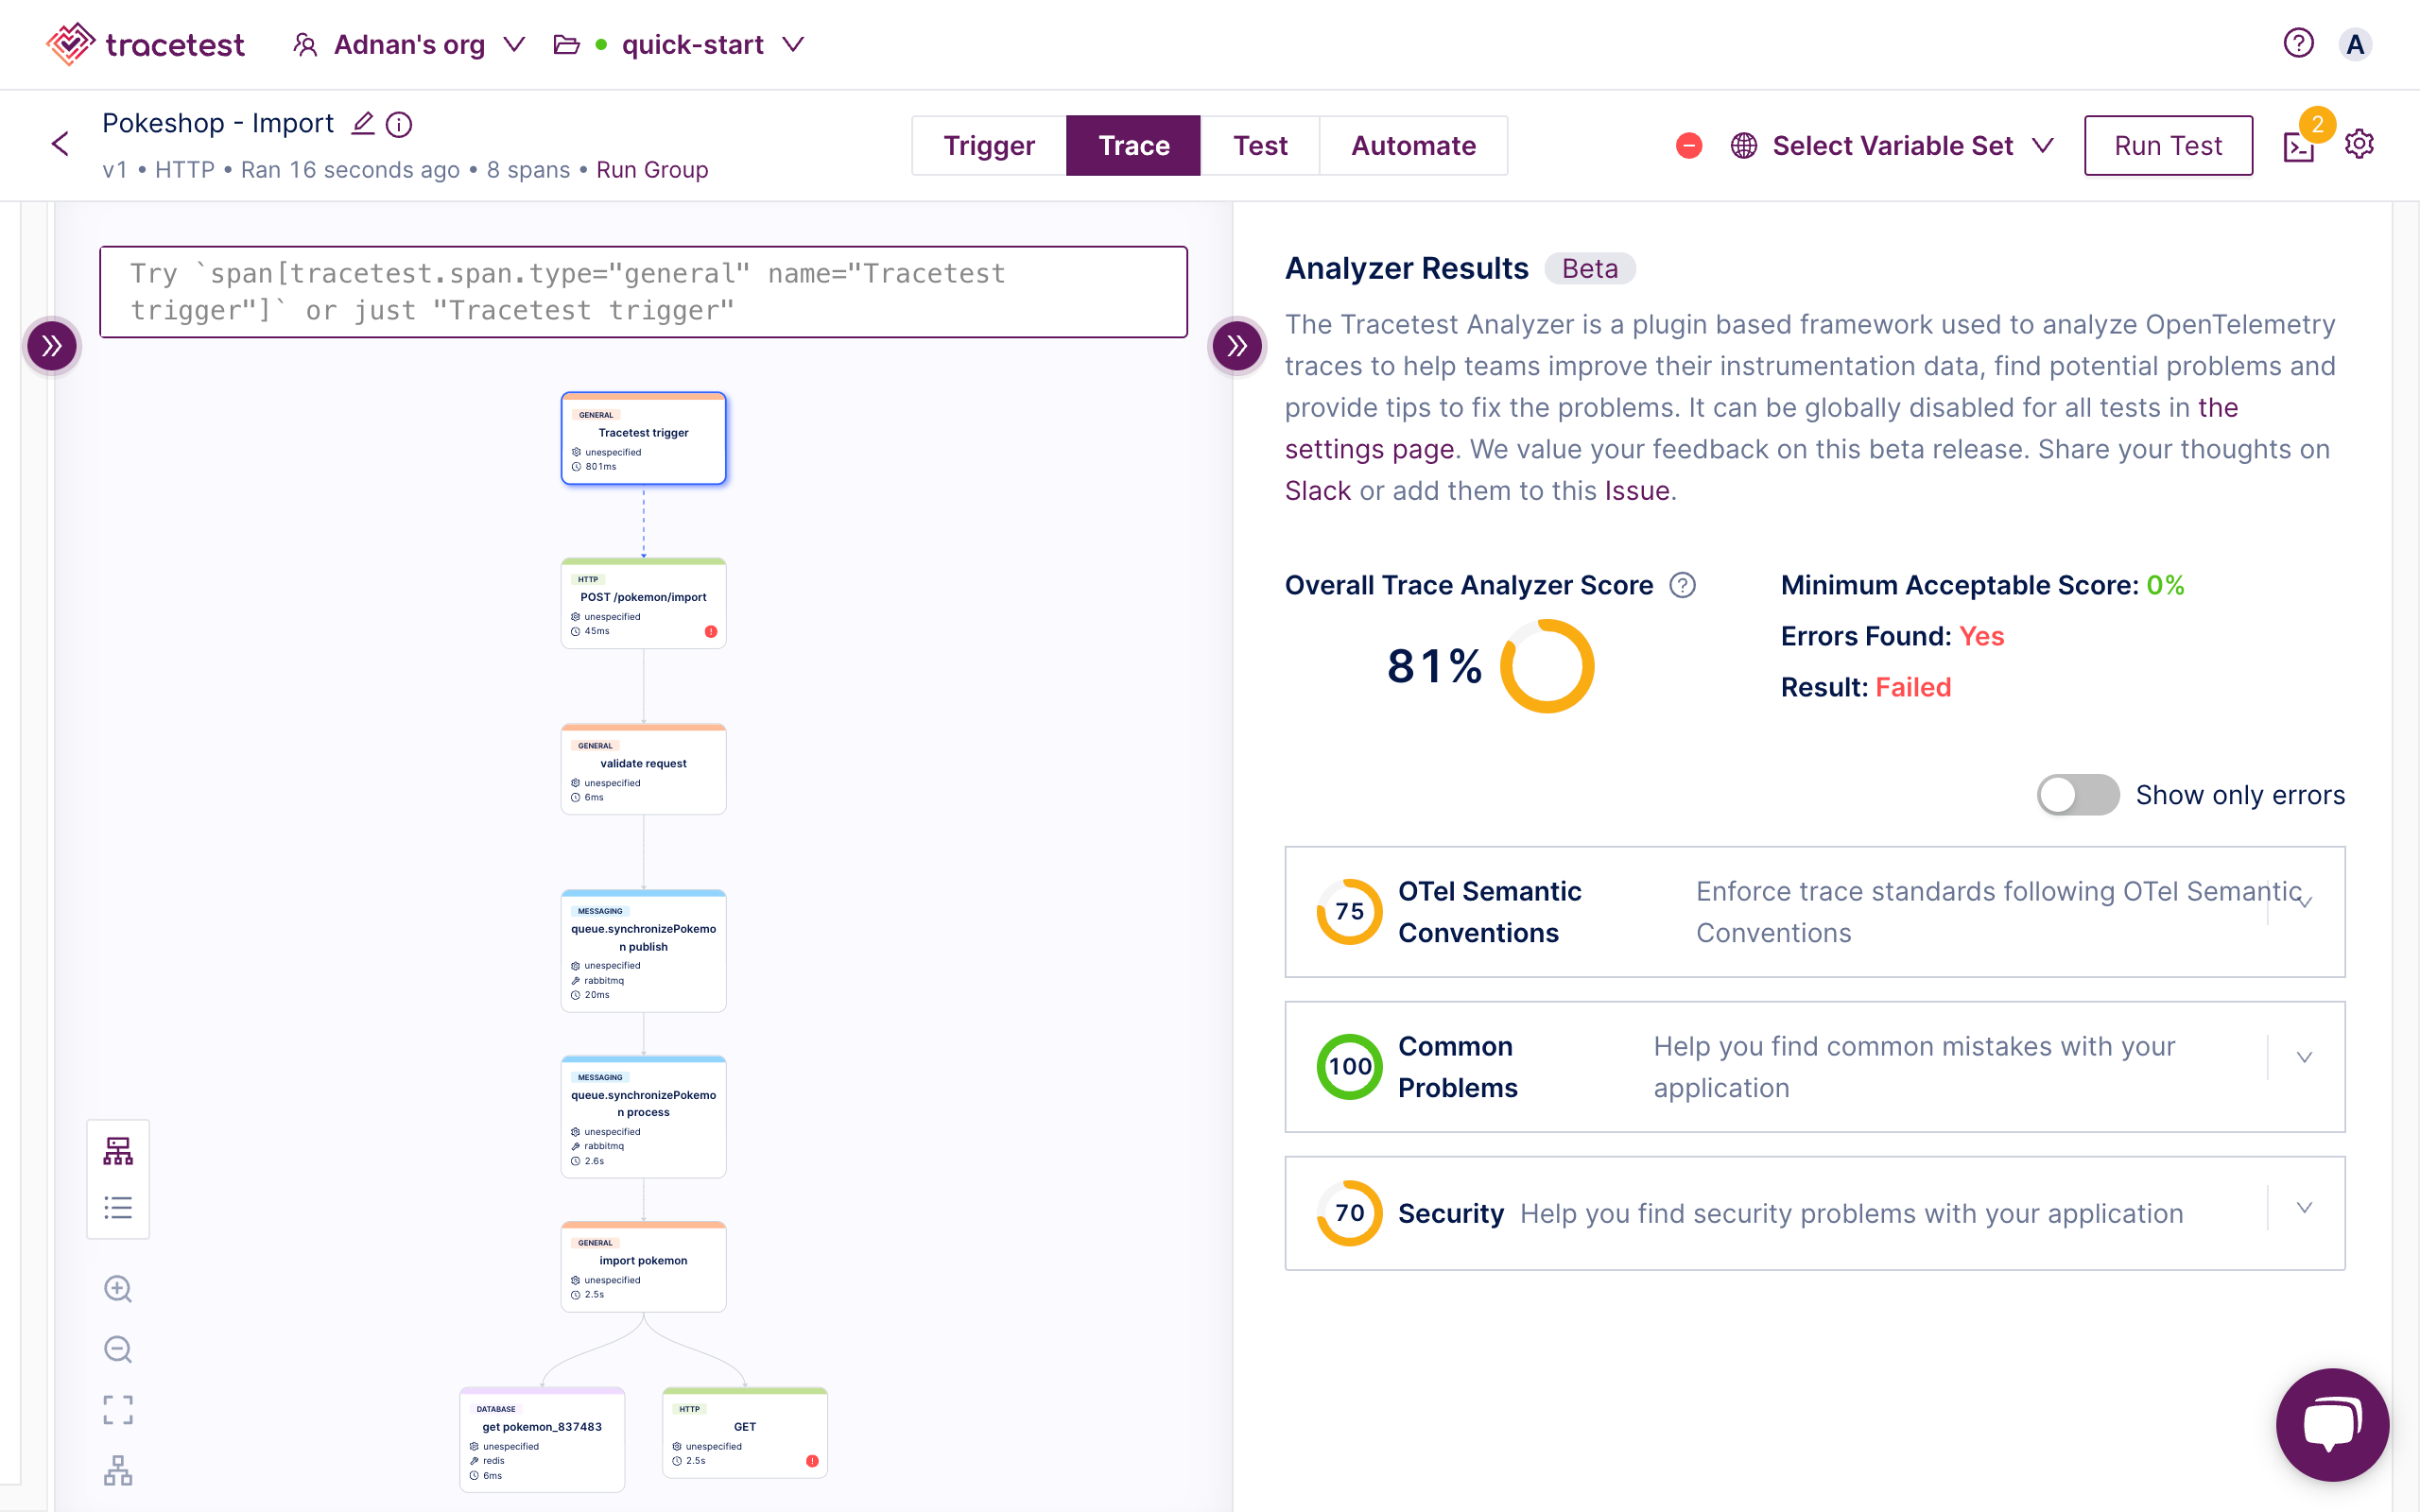
This allows you to validate your OpenTelemetry instrumentation before committing code. All rules and standards you need to adhere to will be displayed for you to see exactly what to improve!
Next, when you’re happy with the traces, move on to creating test specifications.
## Define Test Scenarios with Tracetest
This section will cover adding four different test scenarios.
1. Validate that all HTTP spans return a status code `200`.
2. Validate that a span exists after the RabbitMQ queue meaning a value has been picked up from it.
3. Validate that Redis is using the correct Pokemon id.
4. Validate that Postgres is inserting the correct Pokemon.
Opening the `Test` tab will let you create `Test Specs`.
### Adding Common Test Specs from Snippets
Once you land on the `Test` tab, you’ll be greeted with 6 test snippets for common test cases.
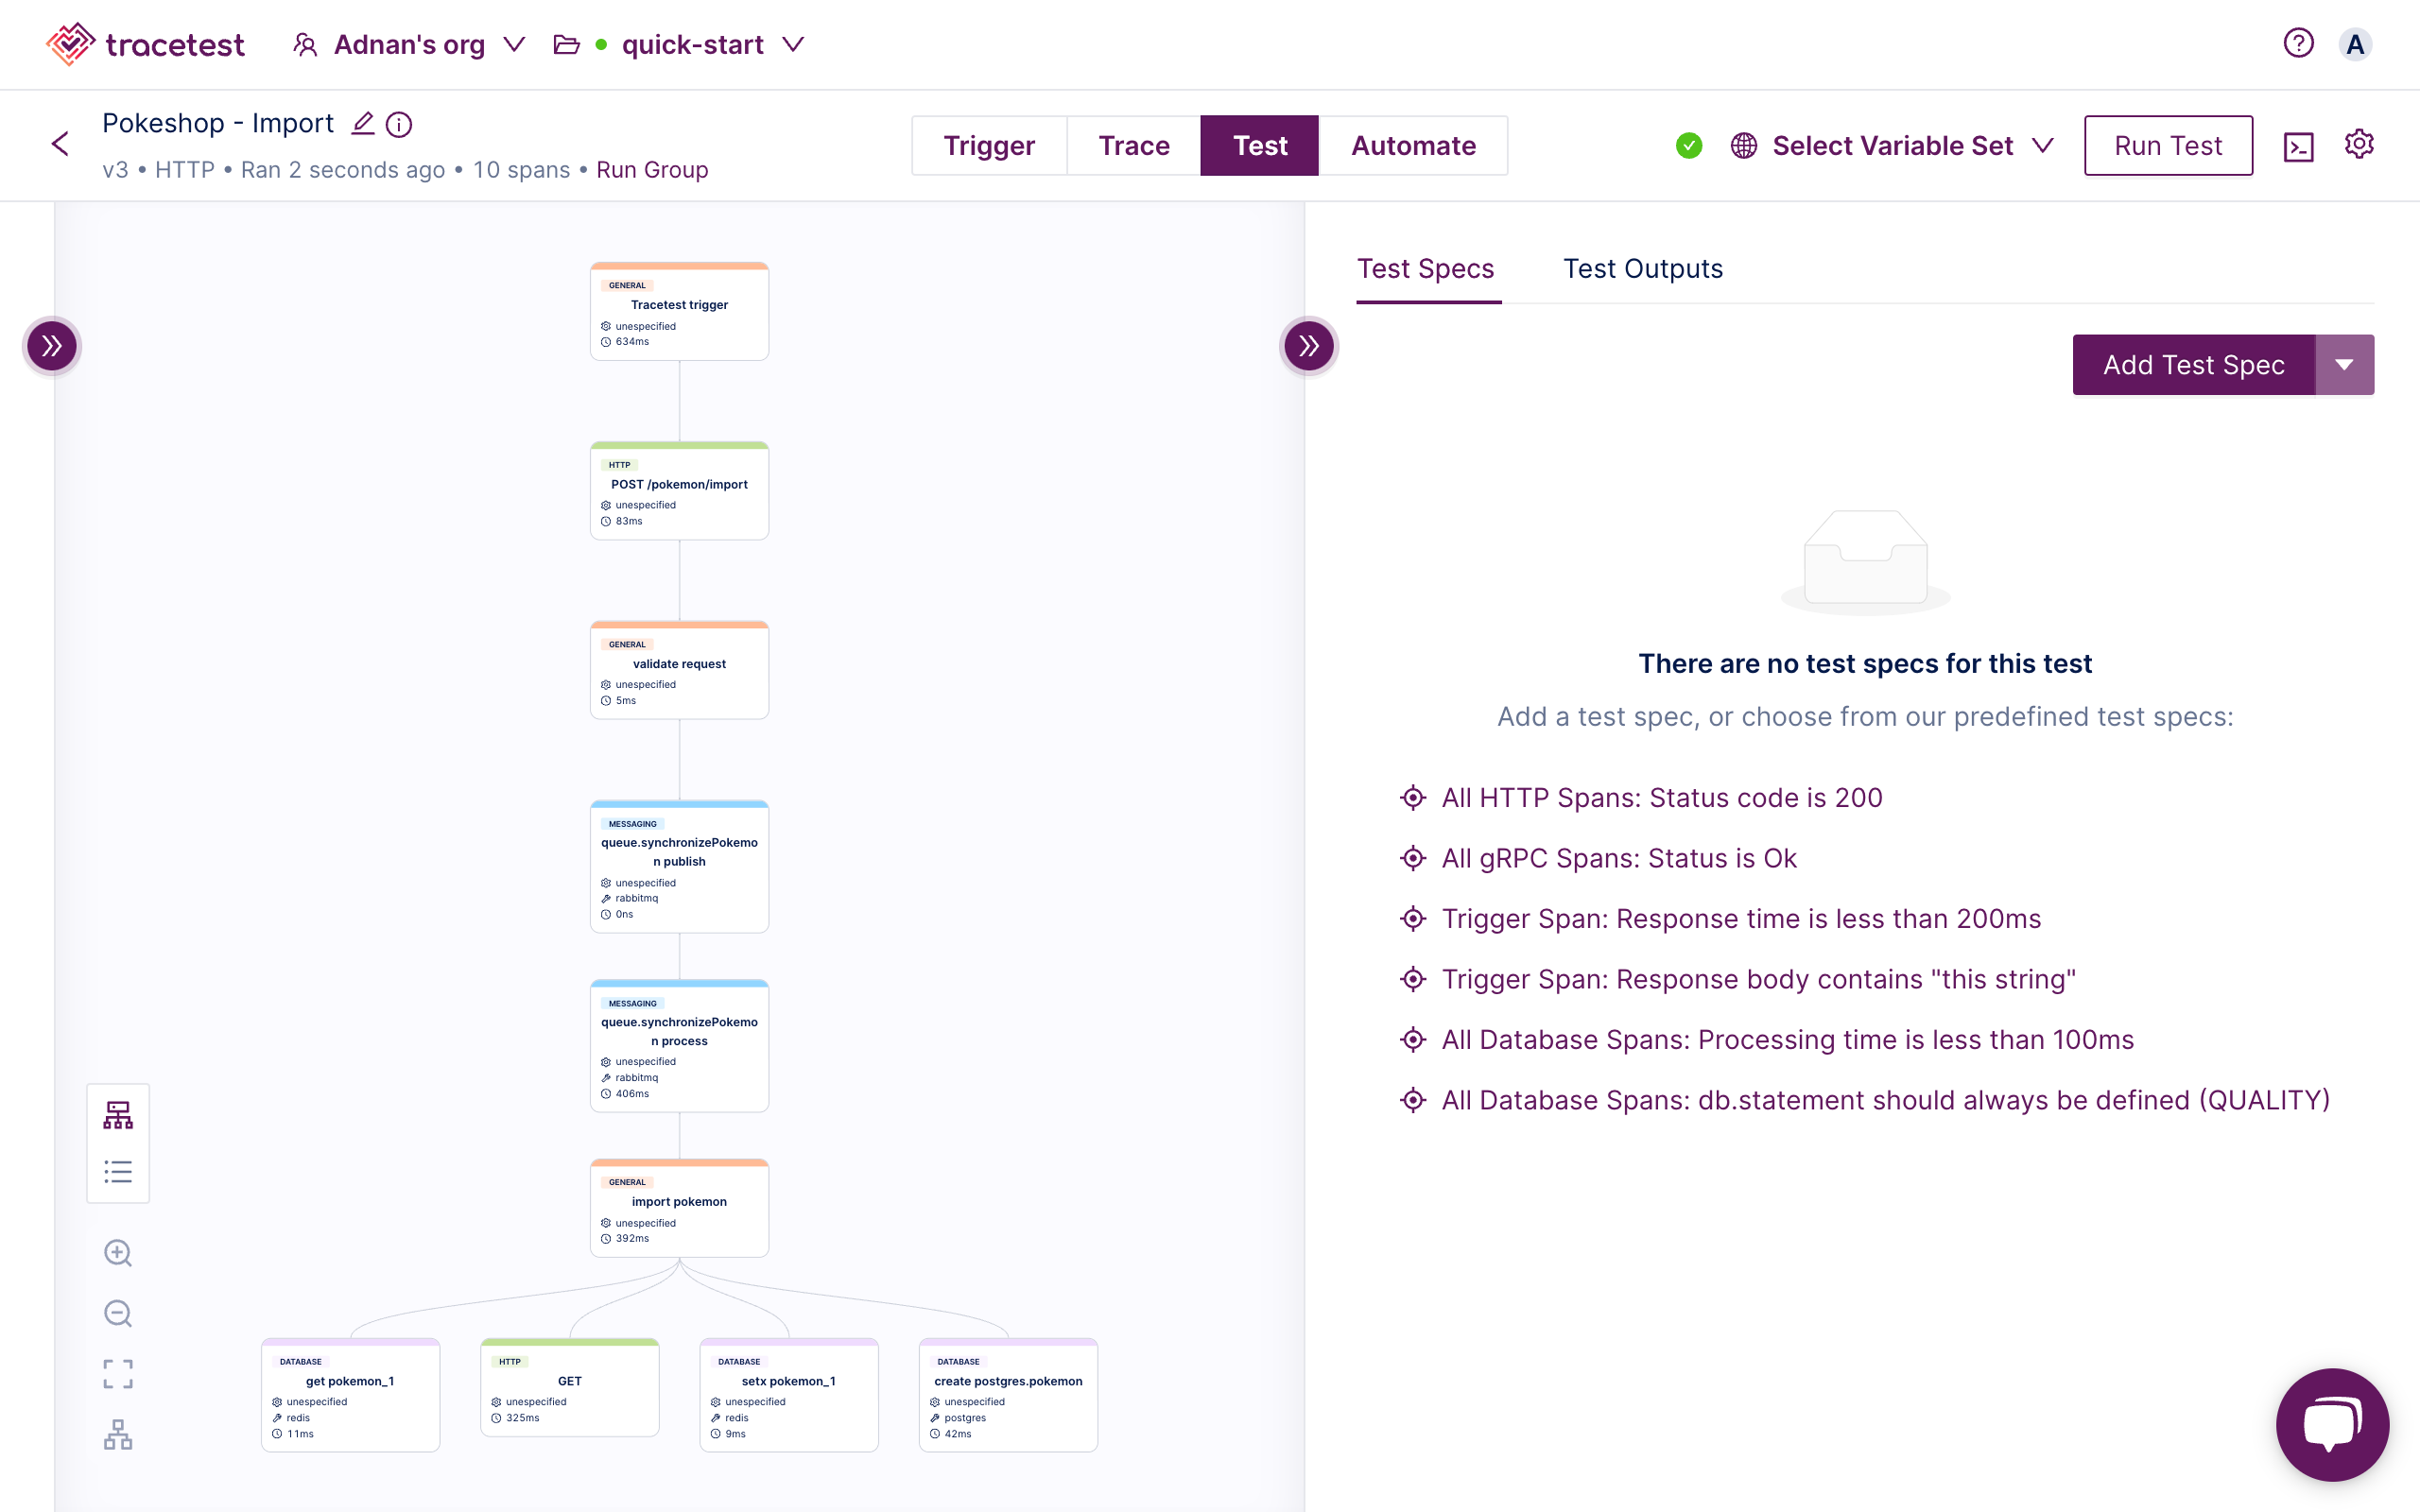
These assertions will validate the properties from the trace spans the Pokeshop API generates.
By default, Tracetest will give you snippets to add common assertions like:
- All HTTP spans return the status code `200`
- All database spans return in less than `100ms`
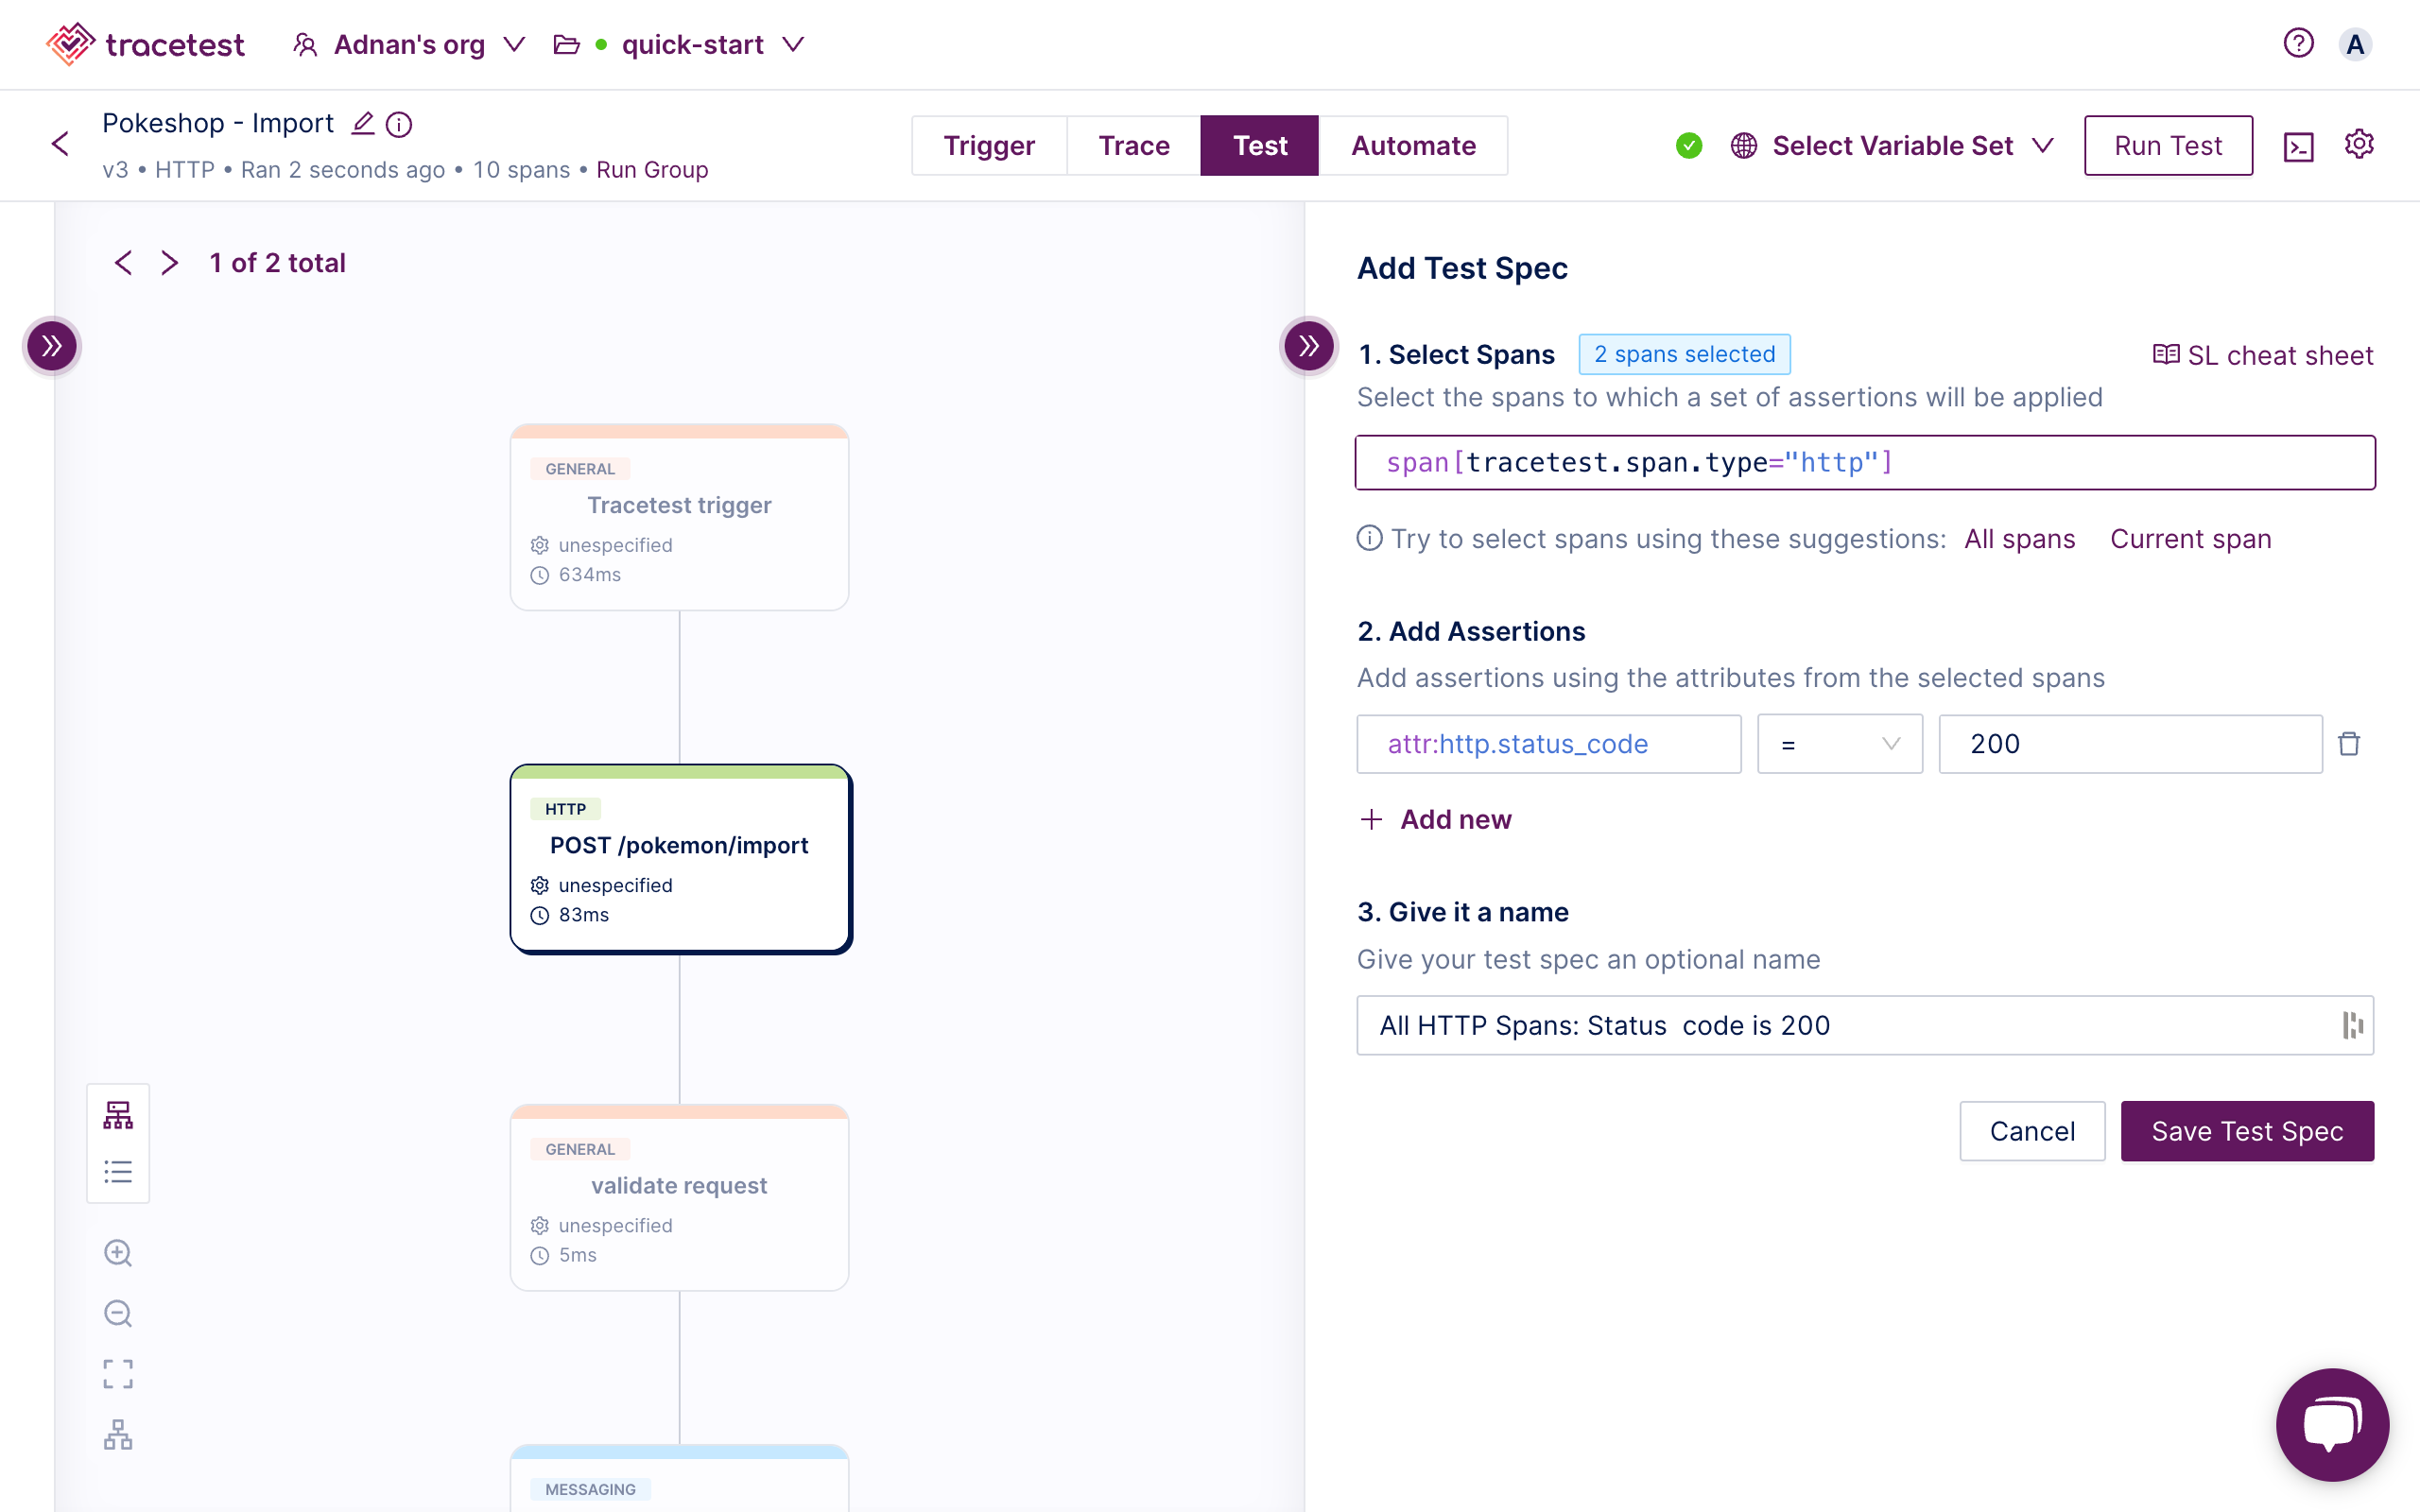
Start by adding a first test spec for validating all HTTP spans return status code `200`.
- Click `All HTTP Spans: Status code is 200`
- `Save Test Spec`
- `Save`
But this case is common and easy to test with traditional tools. However, running tests on message queues and caches is not. Let’s jump into that.
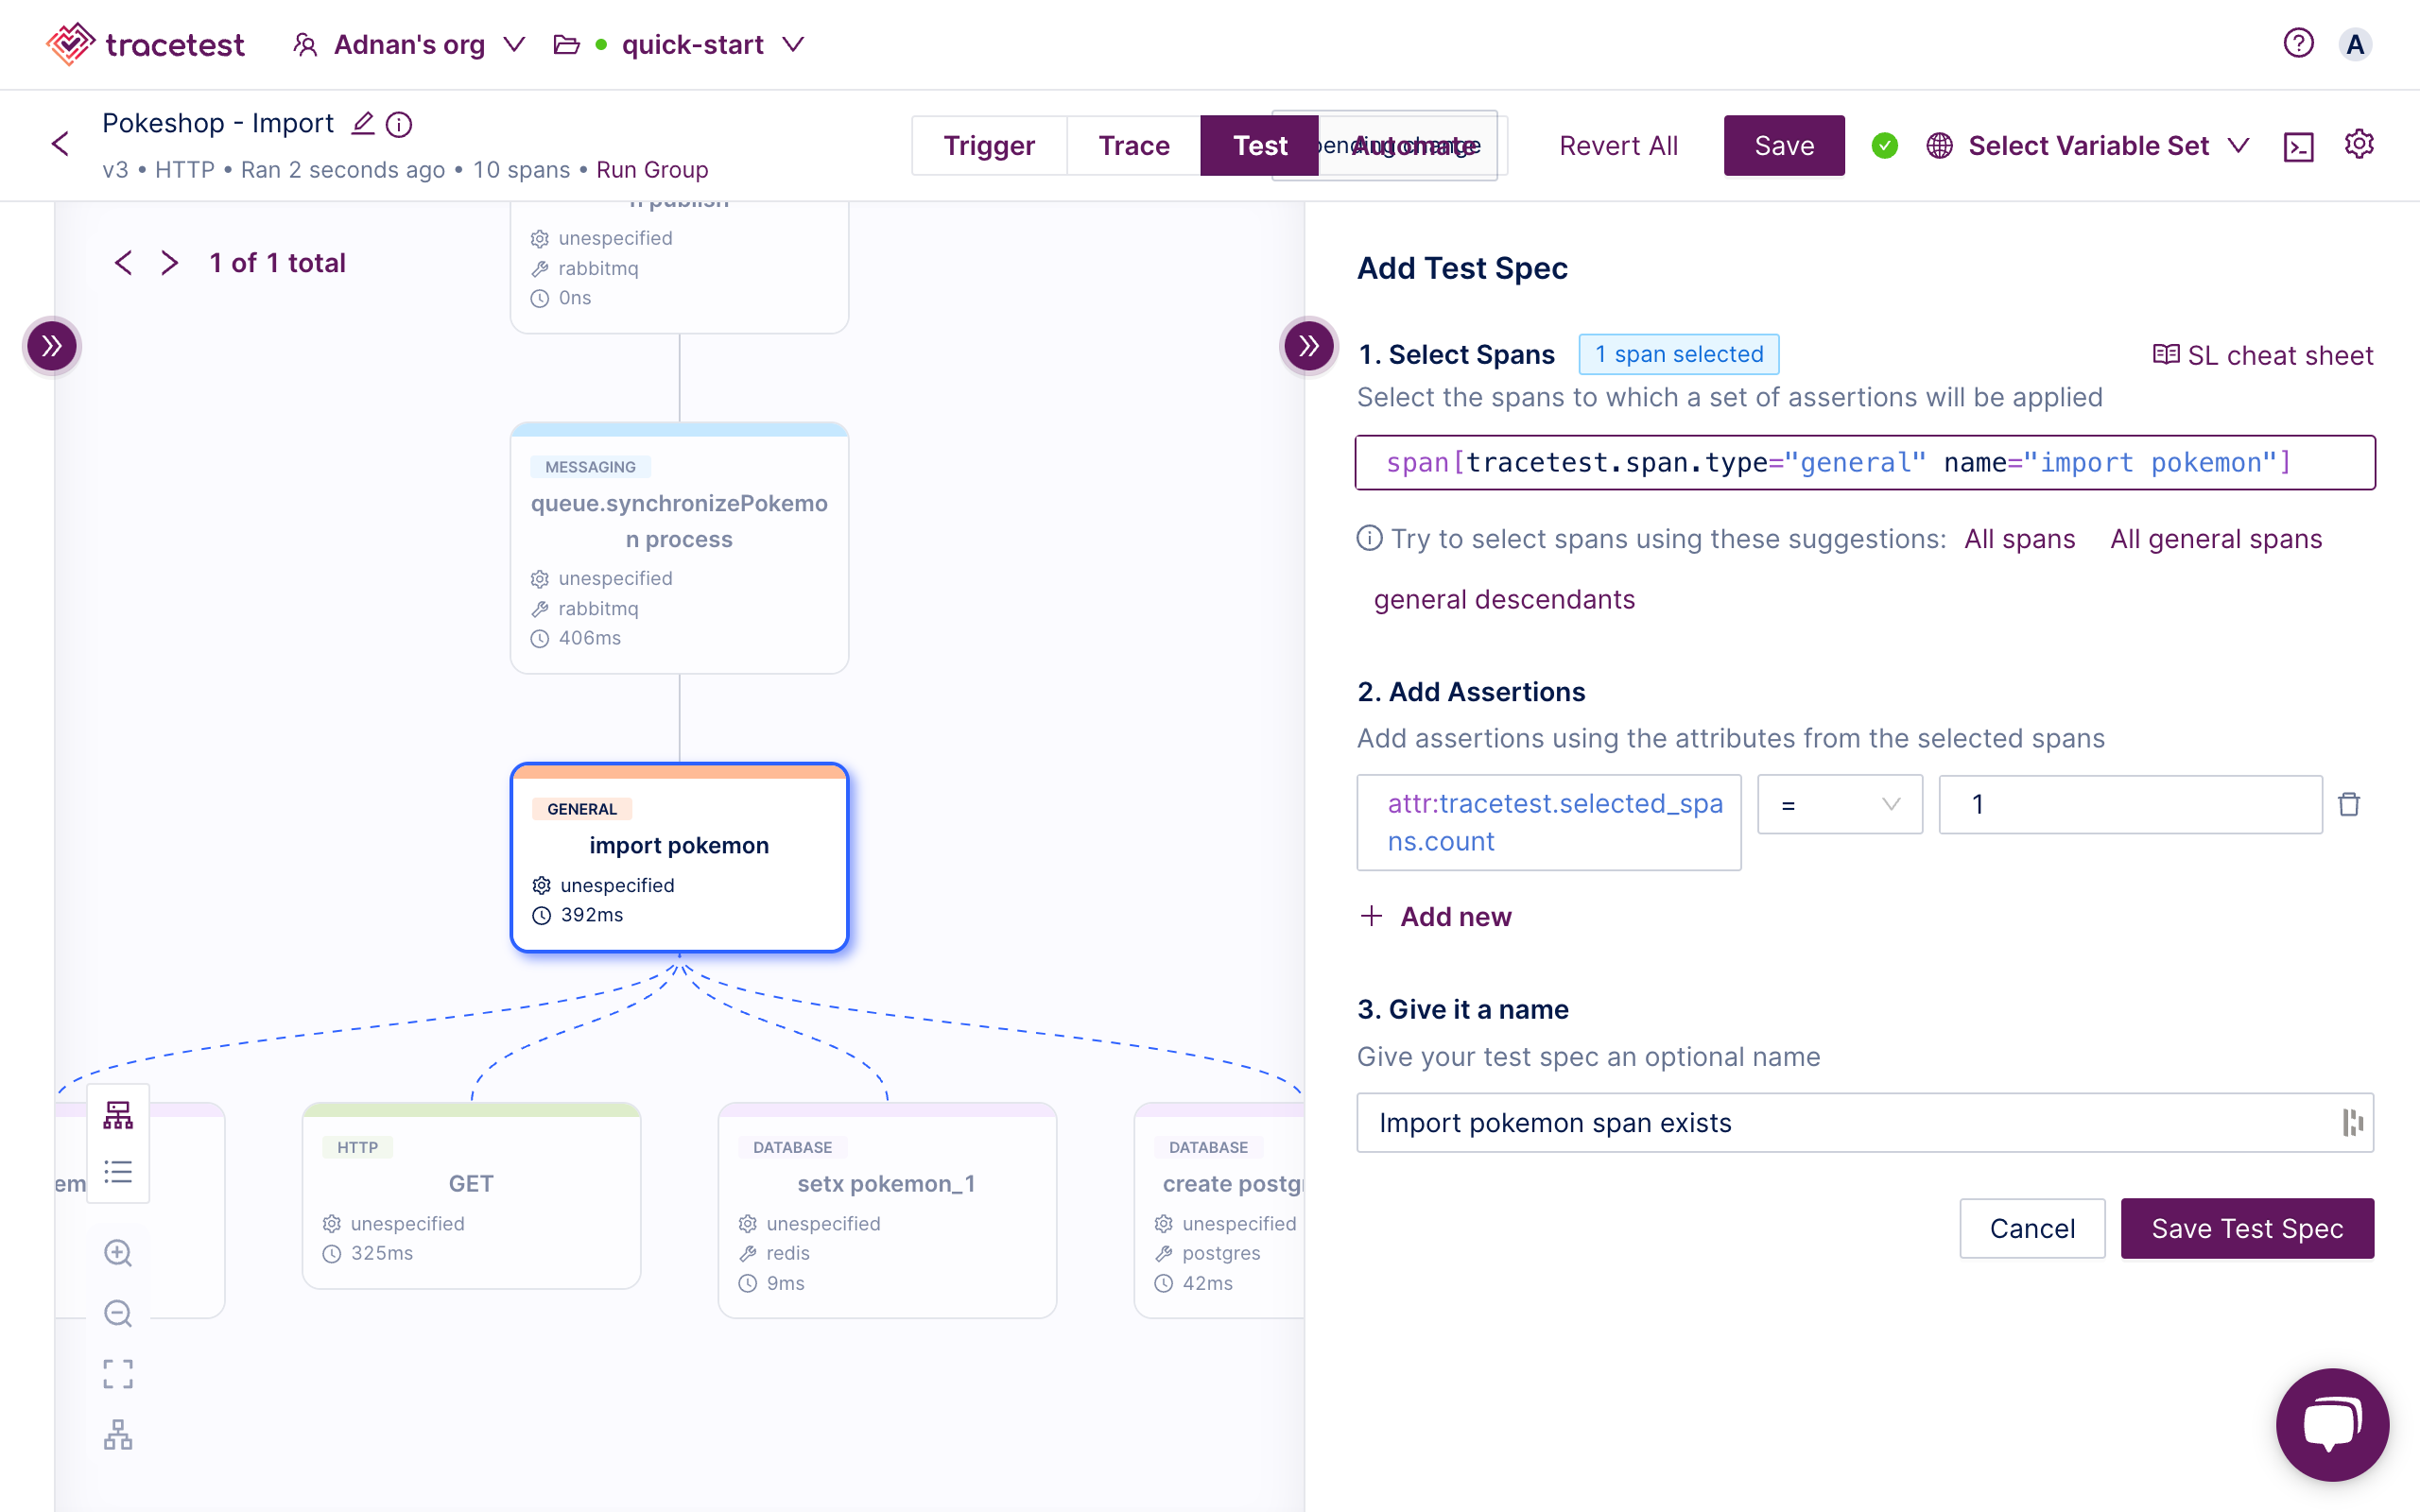
### Adding Test Cases for RabbitMQ, Redis and Postgres
Create another test spec by clicking on the `import pokemon` span and the `Add Test Spec` button.
> To learn more about [selectors](https://docs.tracetest.io/concepts/selectors) and [expressions](https://docs.tracetest.io/concepts/expressions) check the docs.
The selector you need is:
```yaml
span[tracetest.span.type="general" name="import pokemon"]
```
To validate that this span exists at all will validate the value has been picked up from the RabbitMQ queue.
```yaml
attr:tracetest.selected_spans.count = 1
```
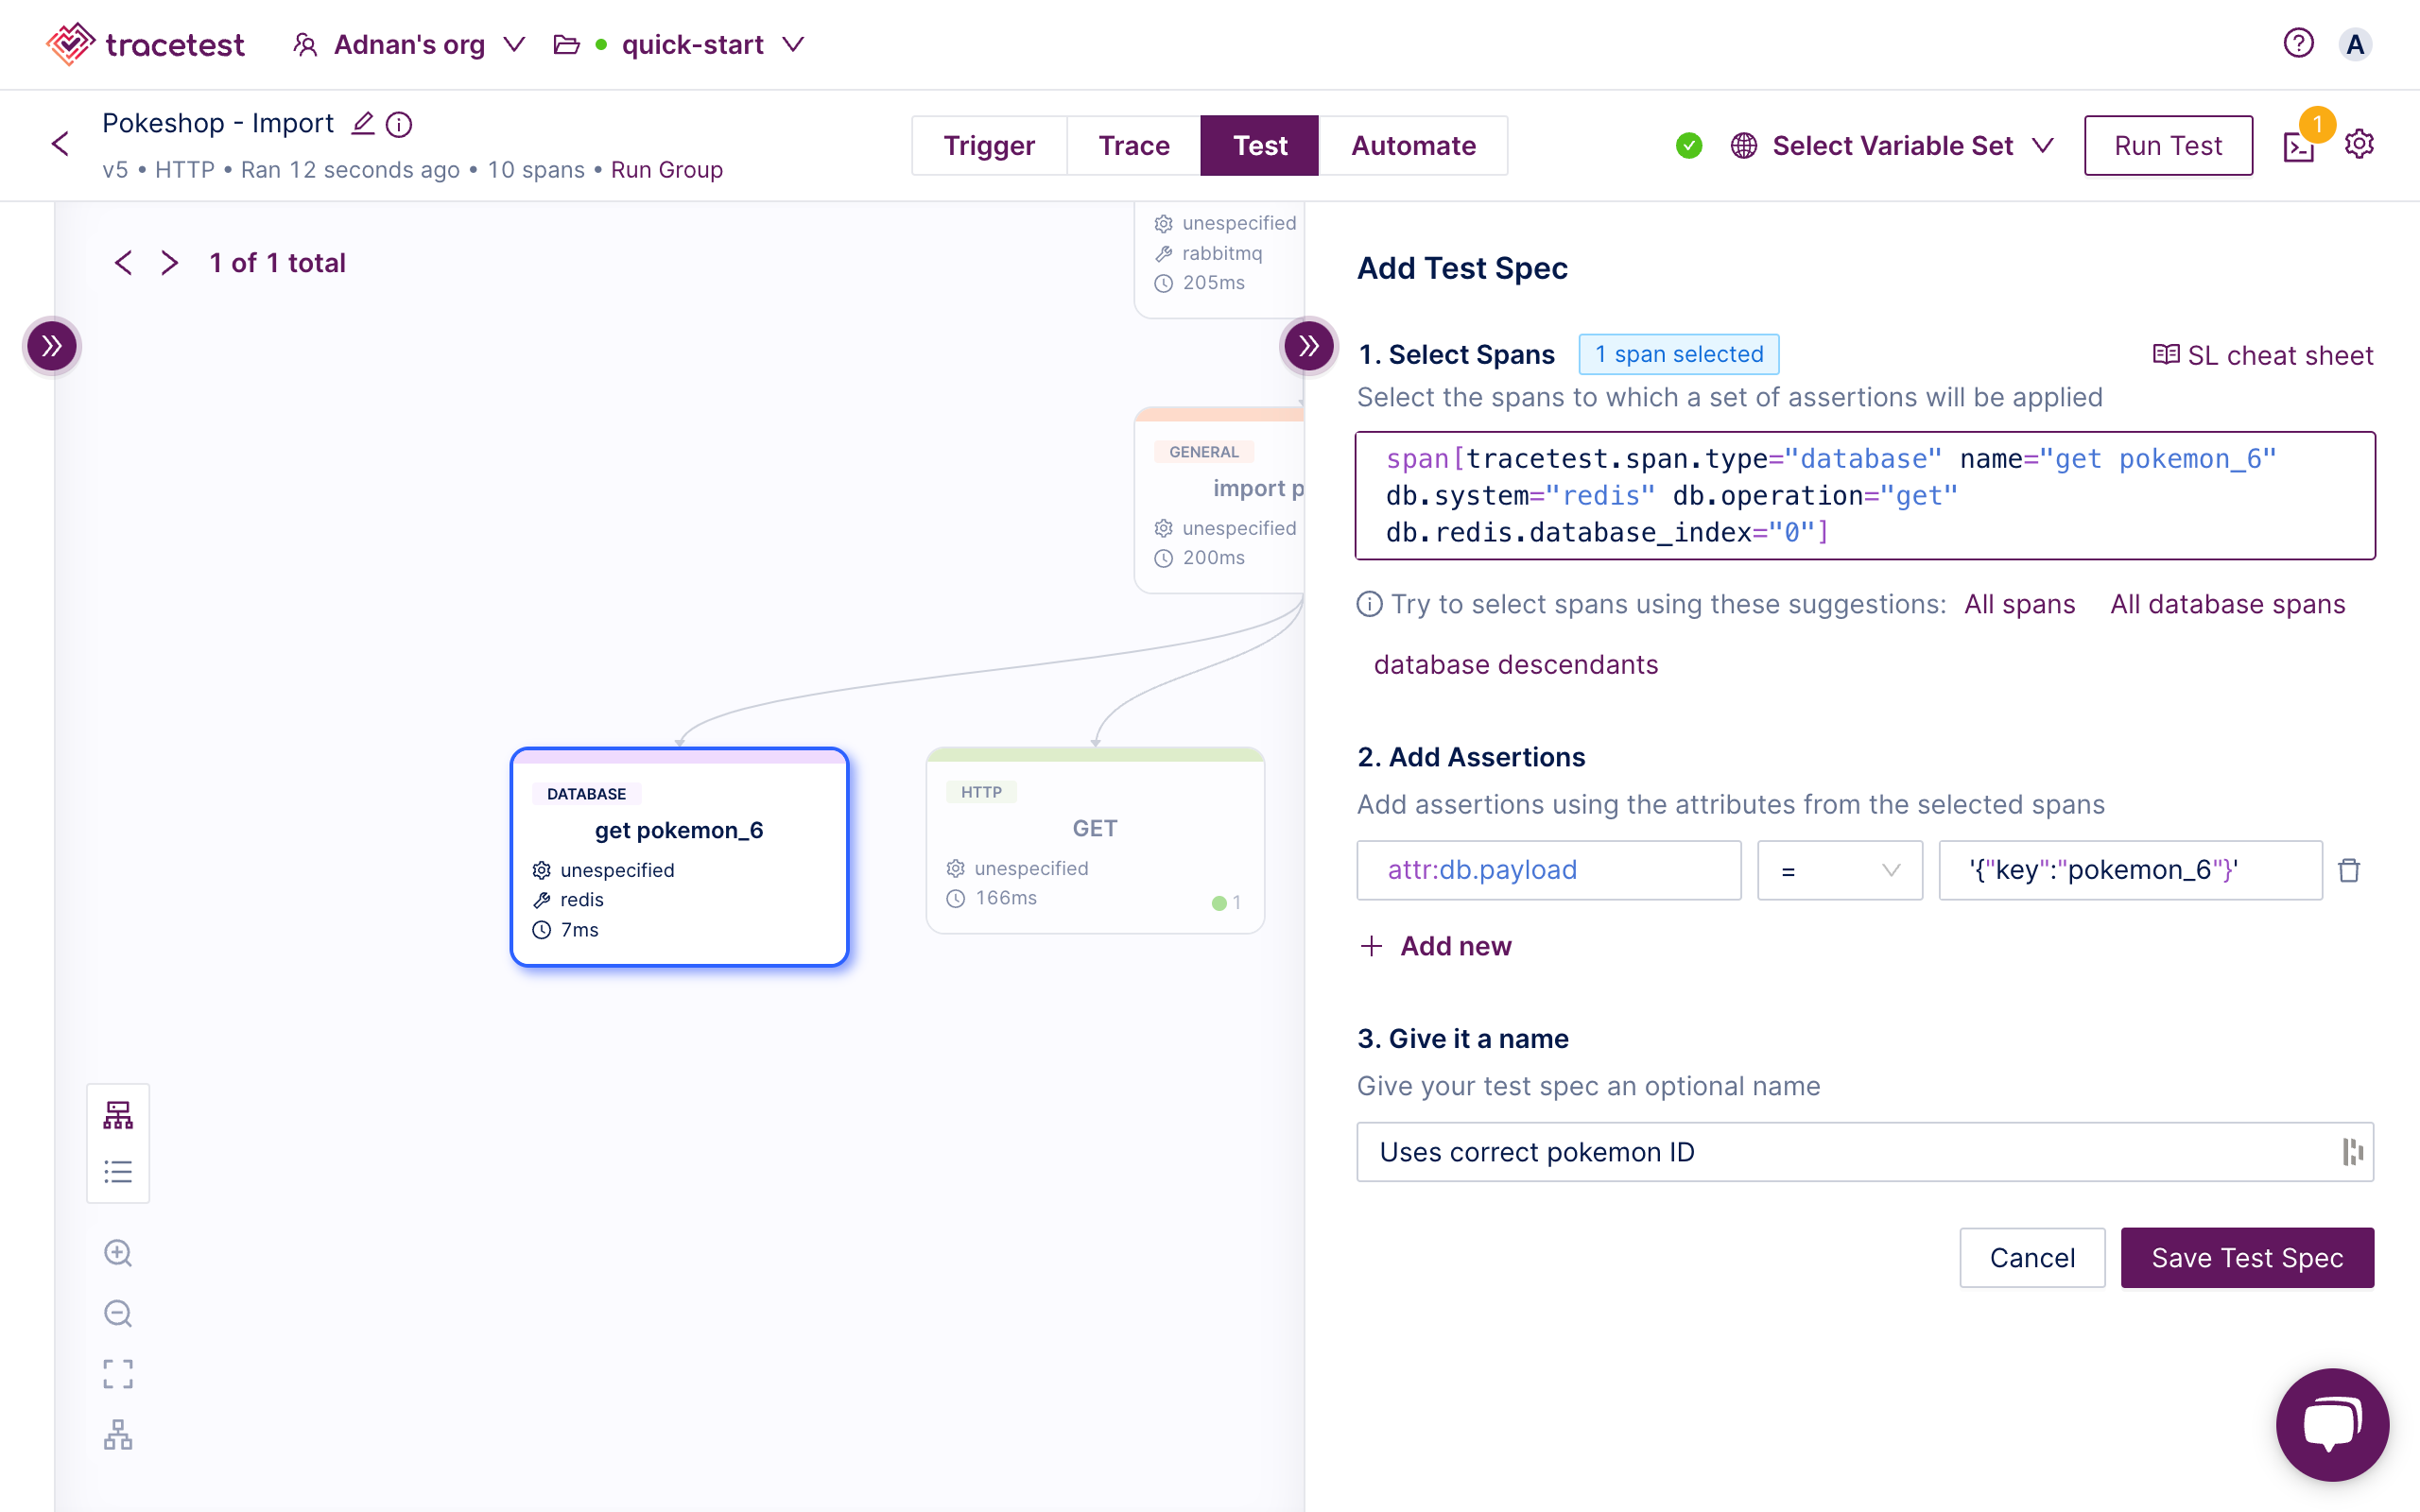
Save the test spec and move to add a test spec for Redis. To validate that Redis is using the correct Pokemon ID we are comparing it to the value returned from Redis.
Select the Redis span. You’ll use this selector:
```yaml
span[tracetest.span.type="database" name="get pokemon_6" db.system="redis" db.operation="get" db.redis.database_index="0"]
```
And this assertion:
```yaml
attr:db.payload = '{"key":"pokemon_6"}'
```
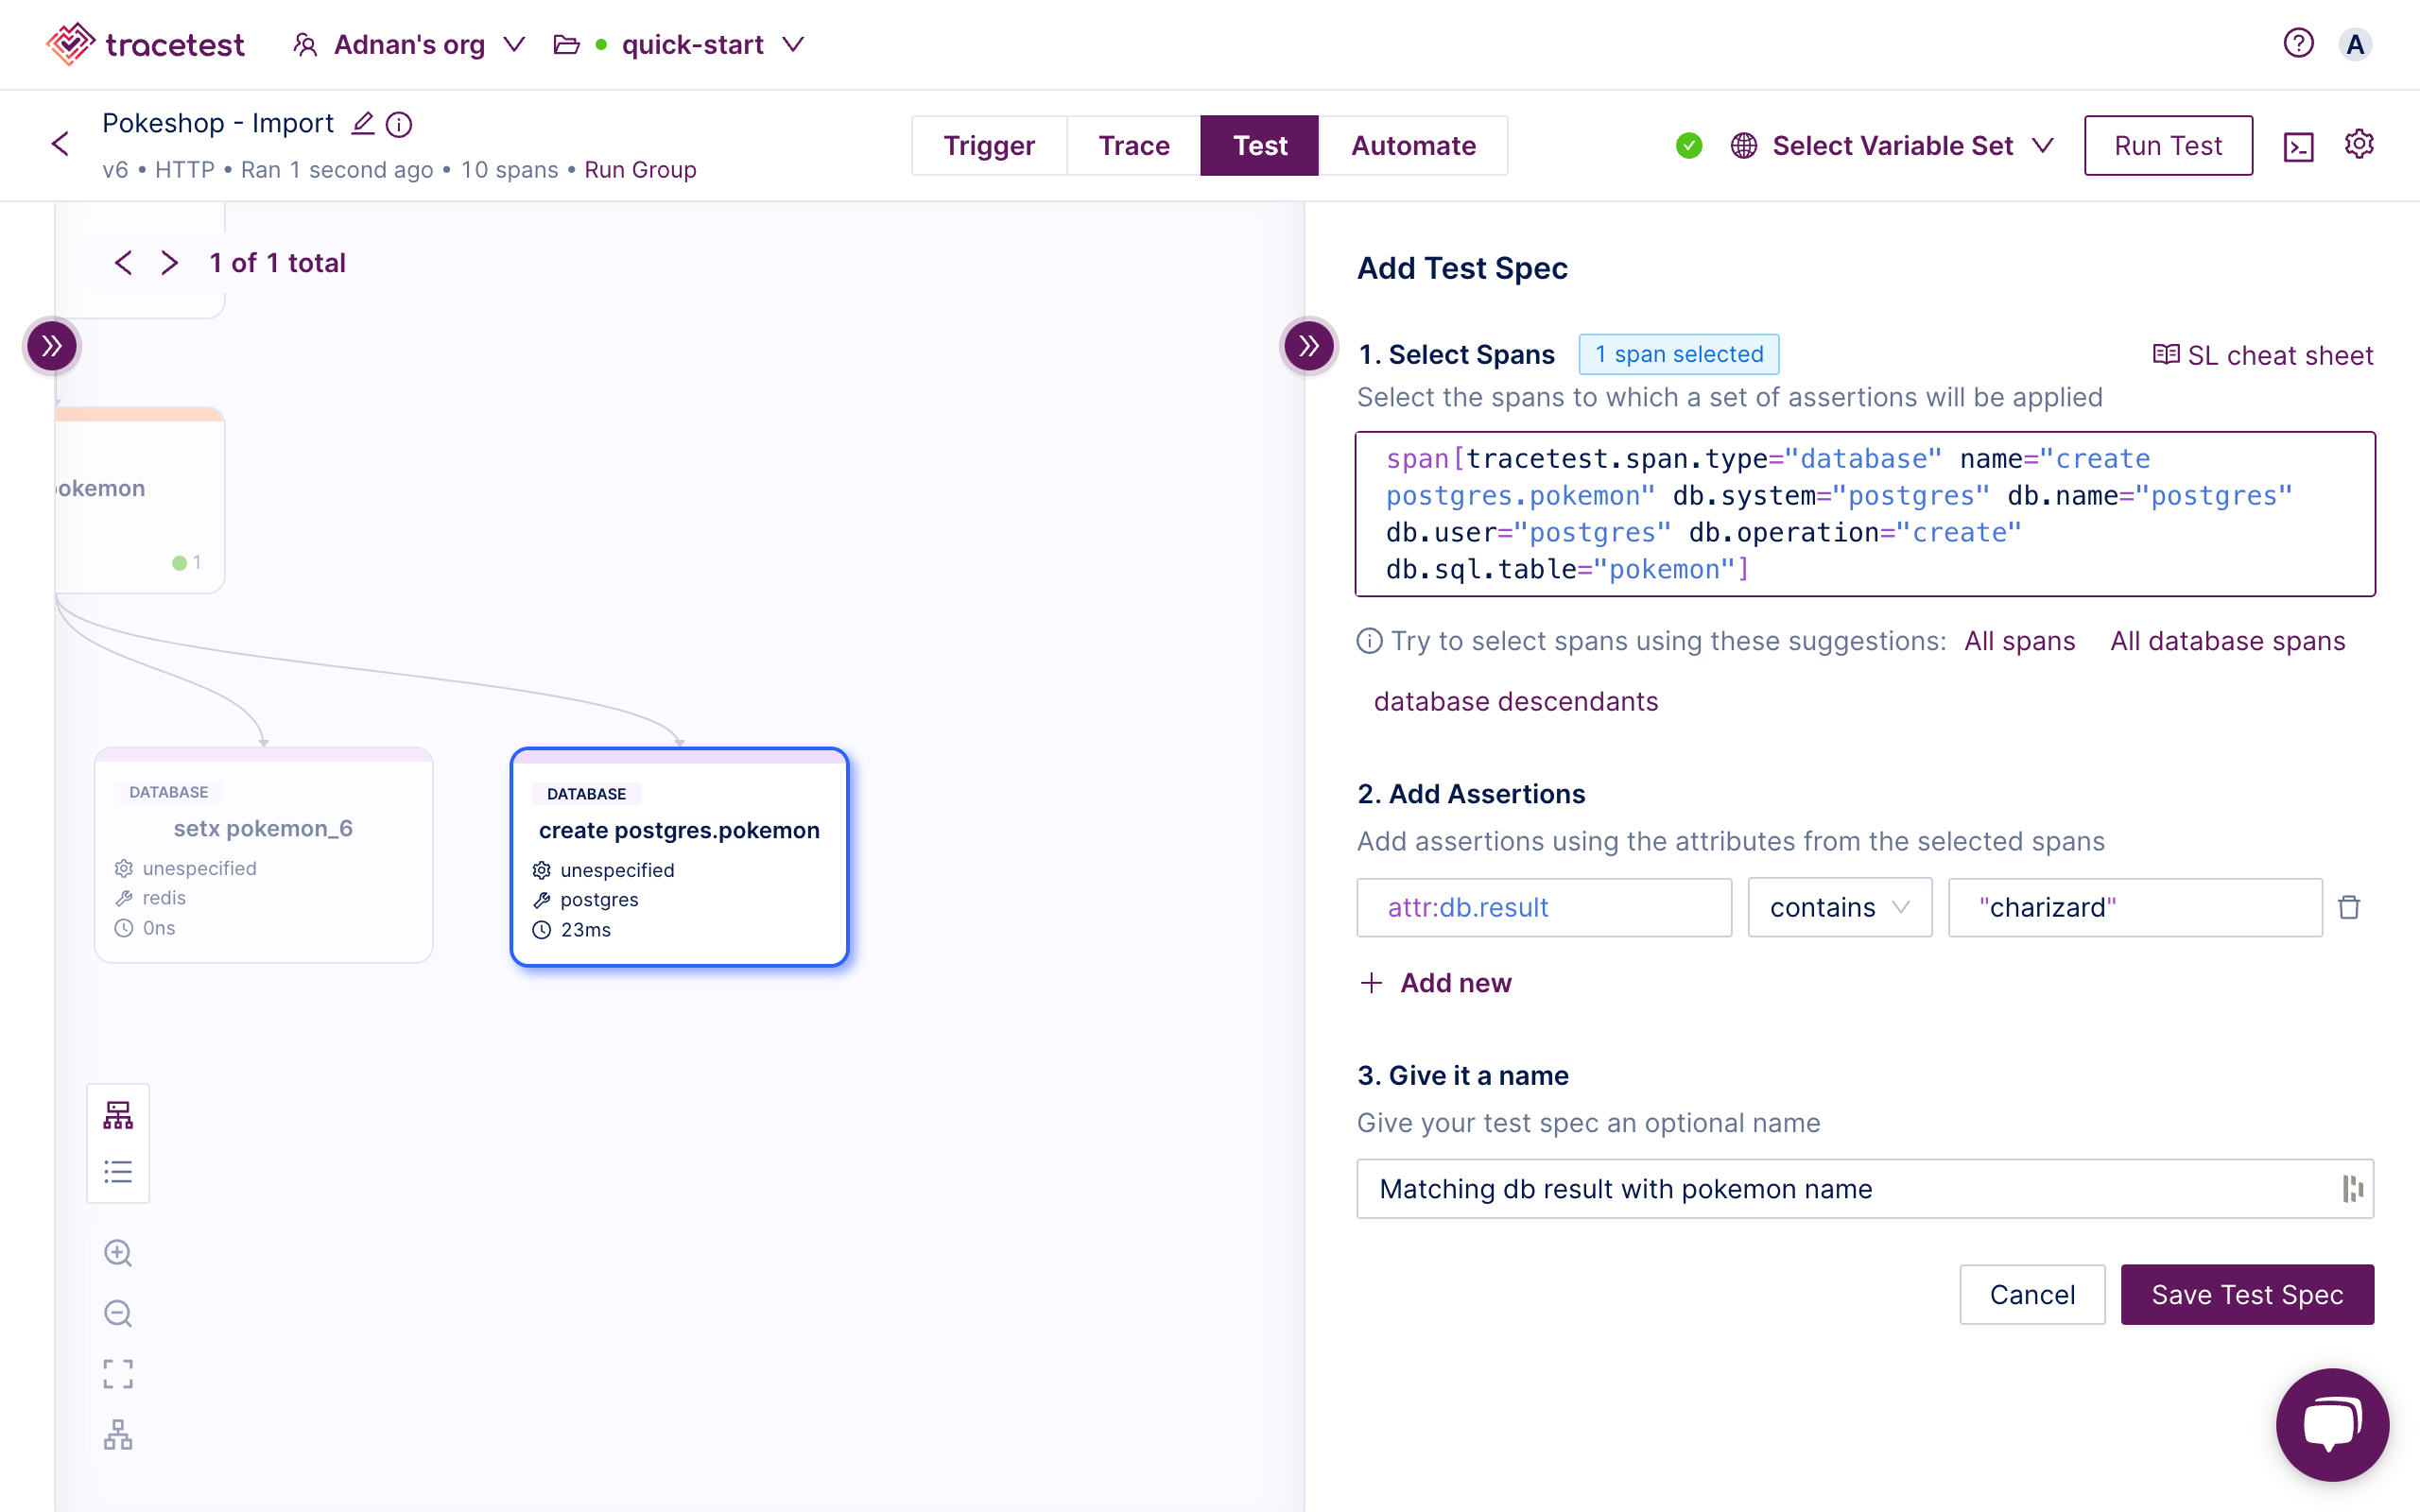
Lastly, select the Postgres span. Here you’re validating that the value inserted into the Postgres database contains the correct Pokemon name.
Create another test spec. Use this selector:
```yaml
span[tracetest.span.type="database" name="create postgres.pokemon" db.system="postgres" db.name="postgres" db.user="postgres" db.operation="create" db.sql.table="pokemon"]
```
And this assertion:
```yaml
attr:db.result contains "charizard"
```
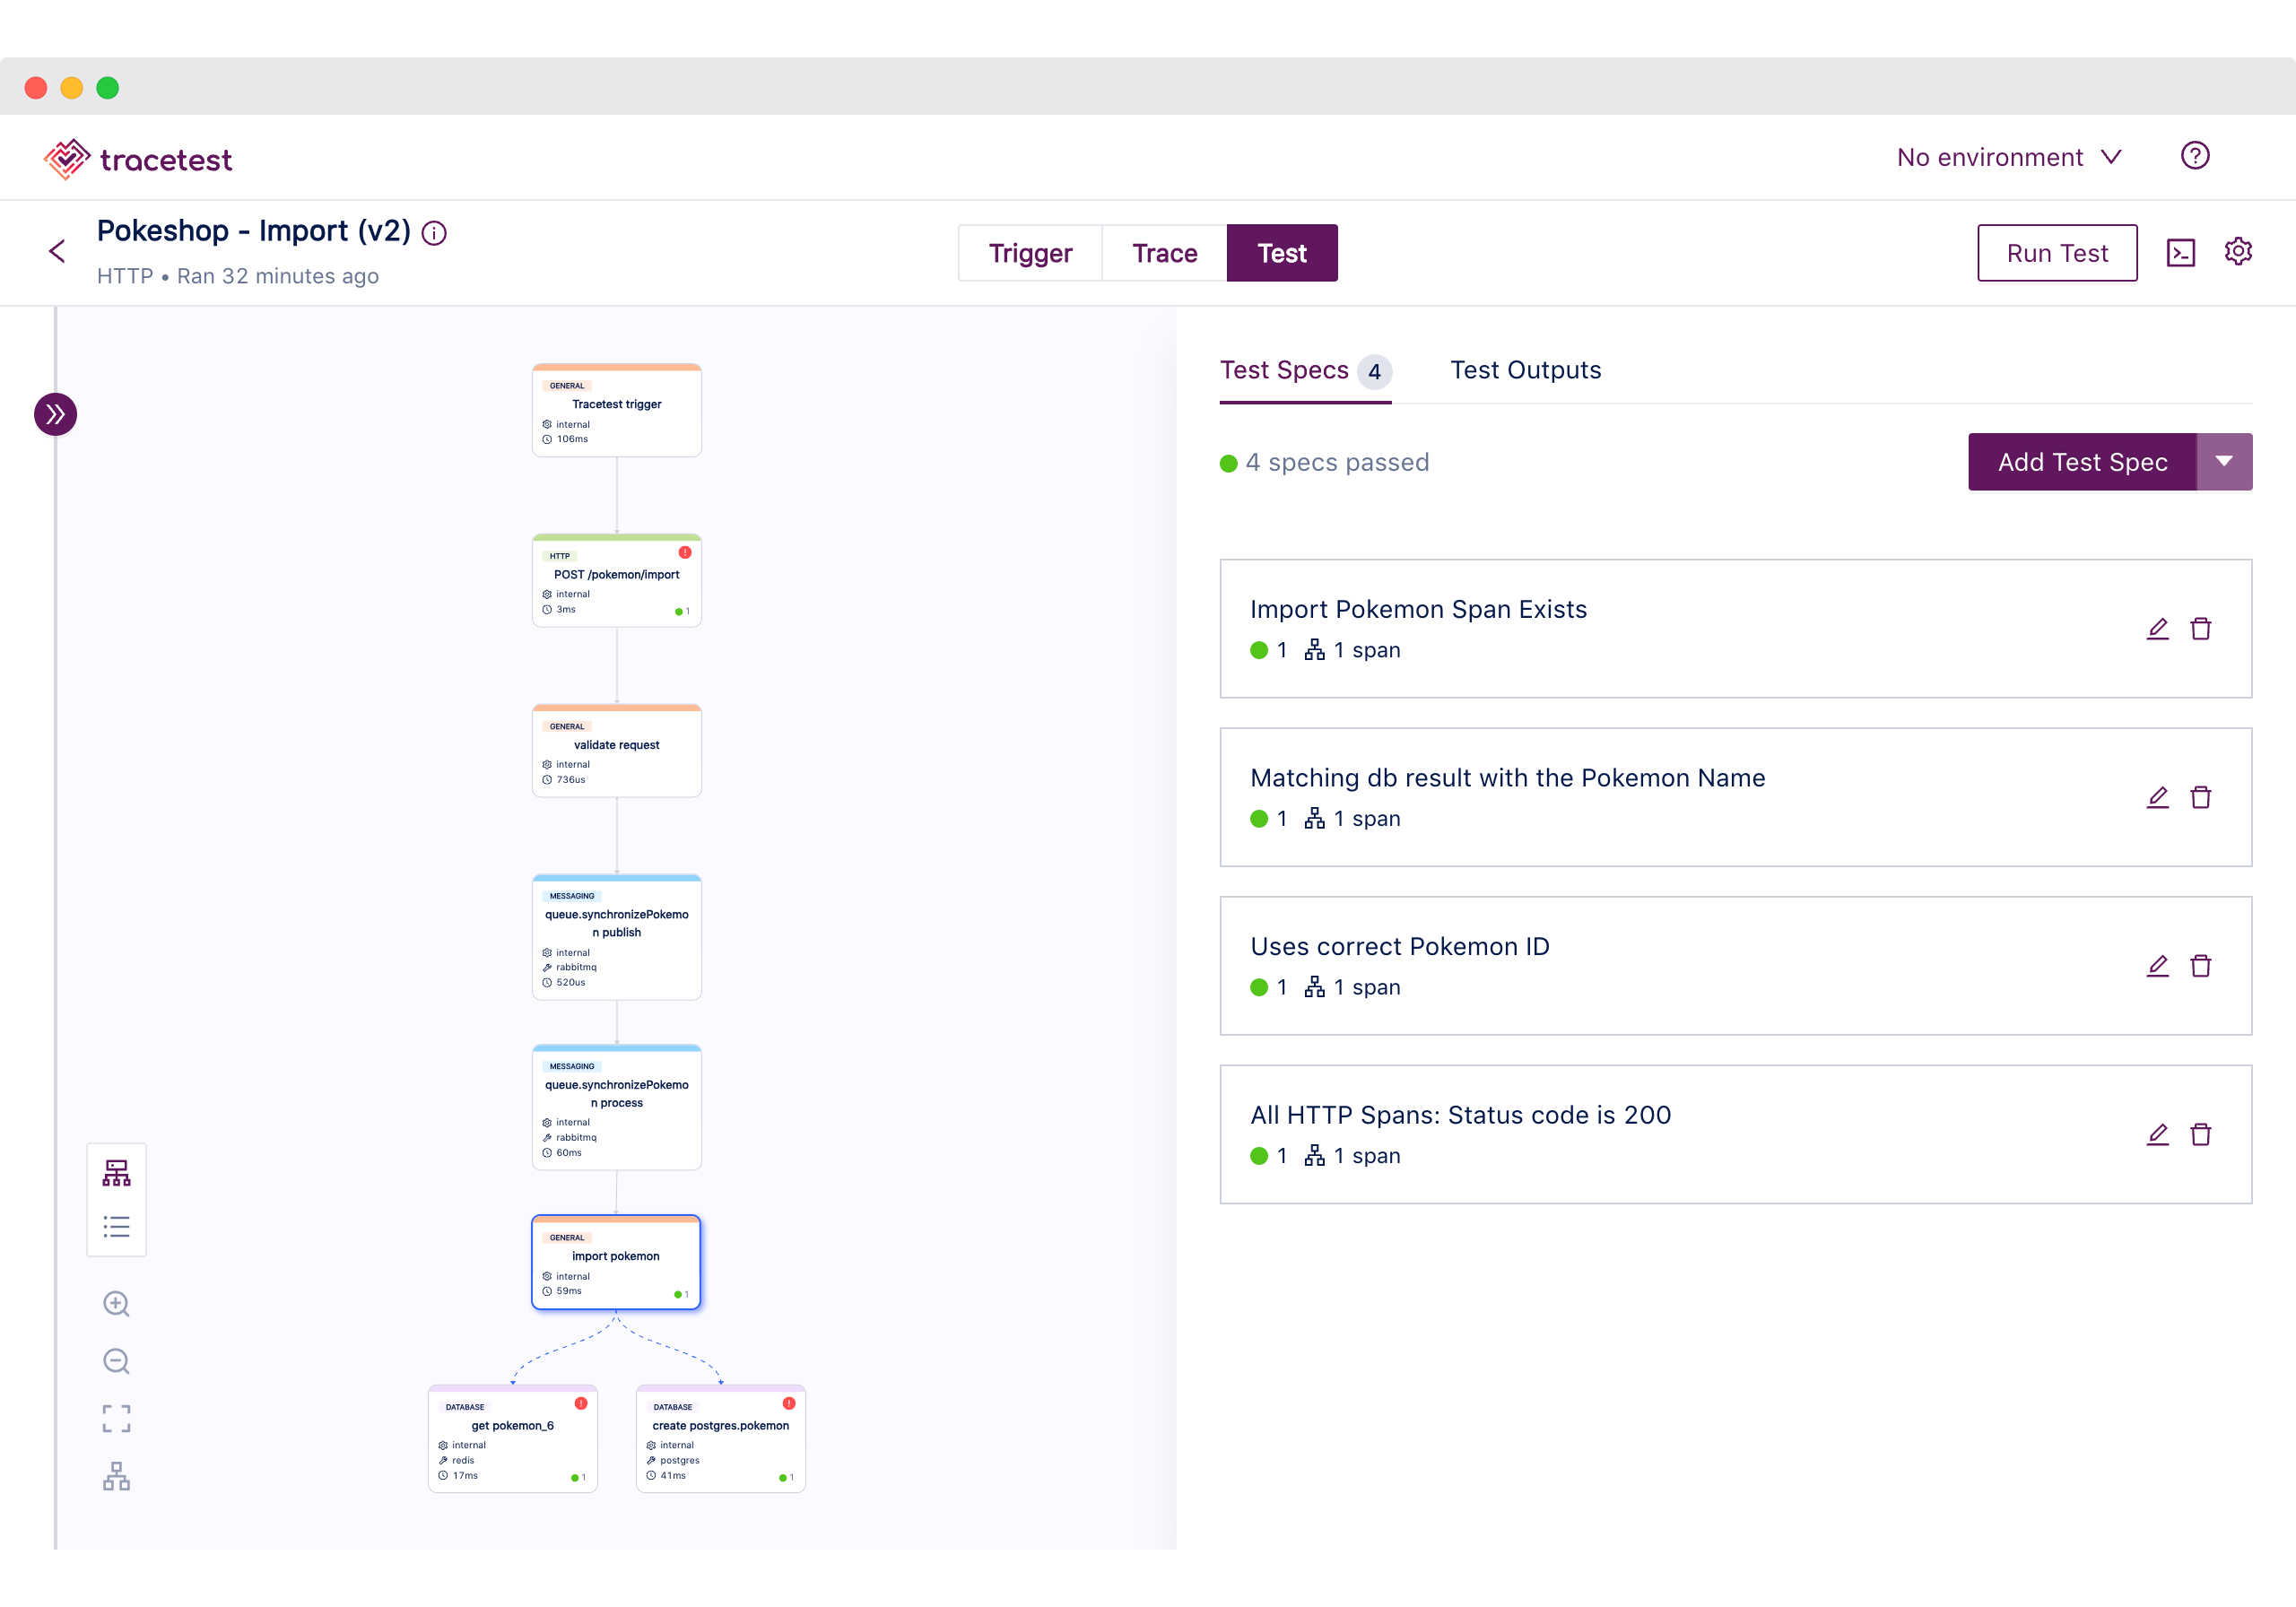
After all this work, you’ll end up with 4 test specs.
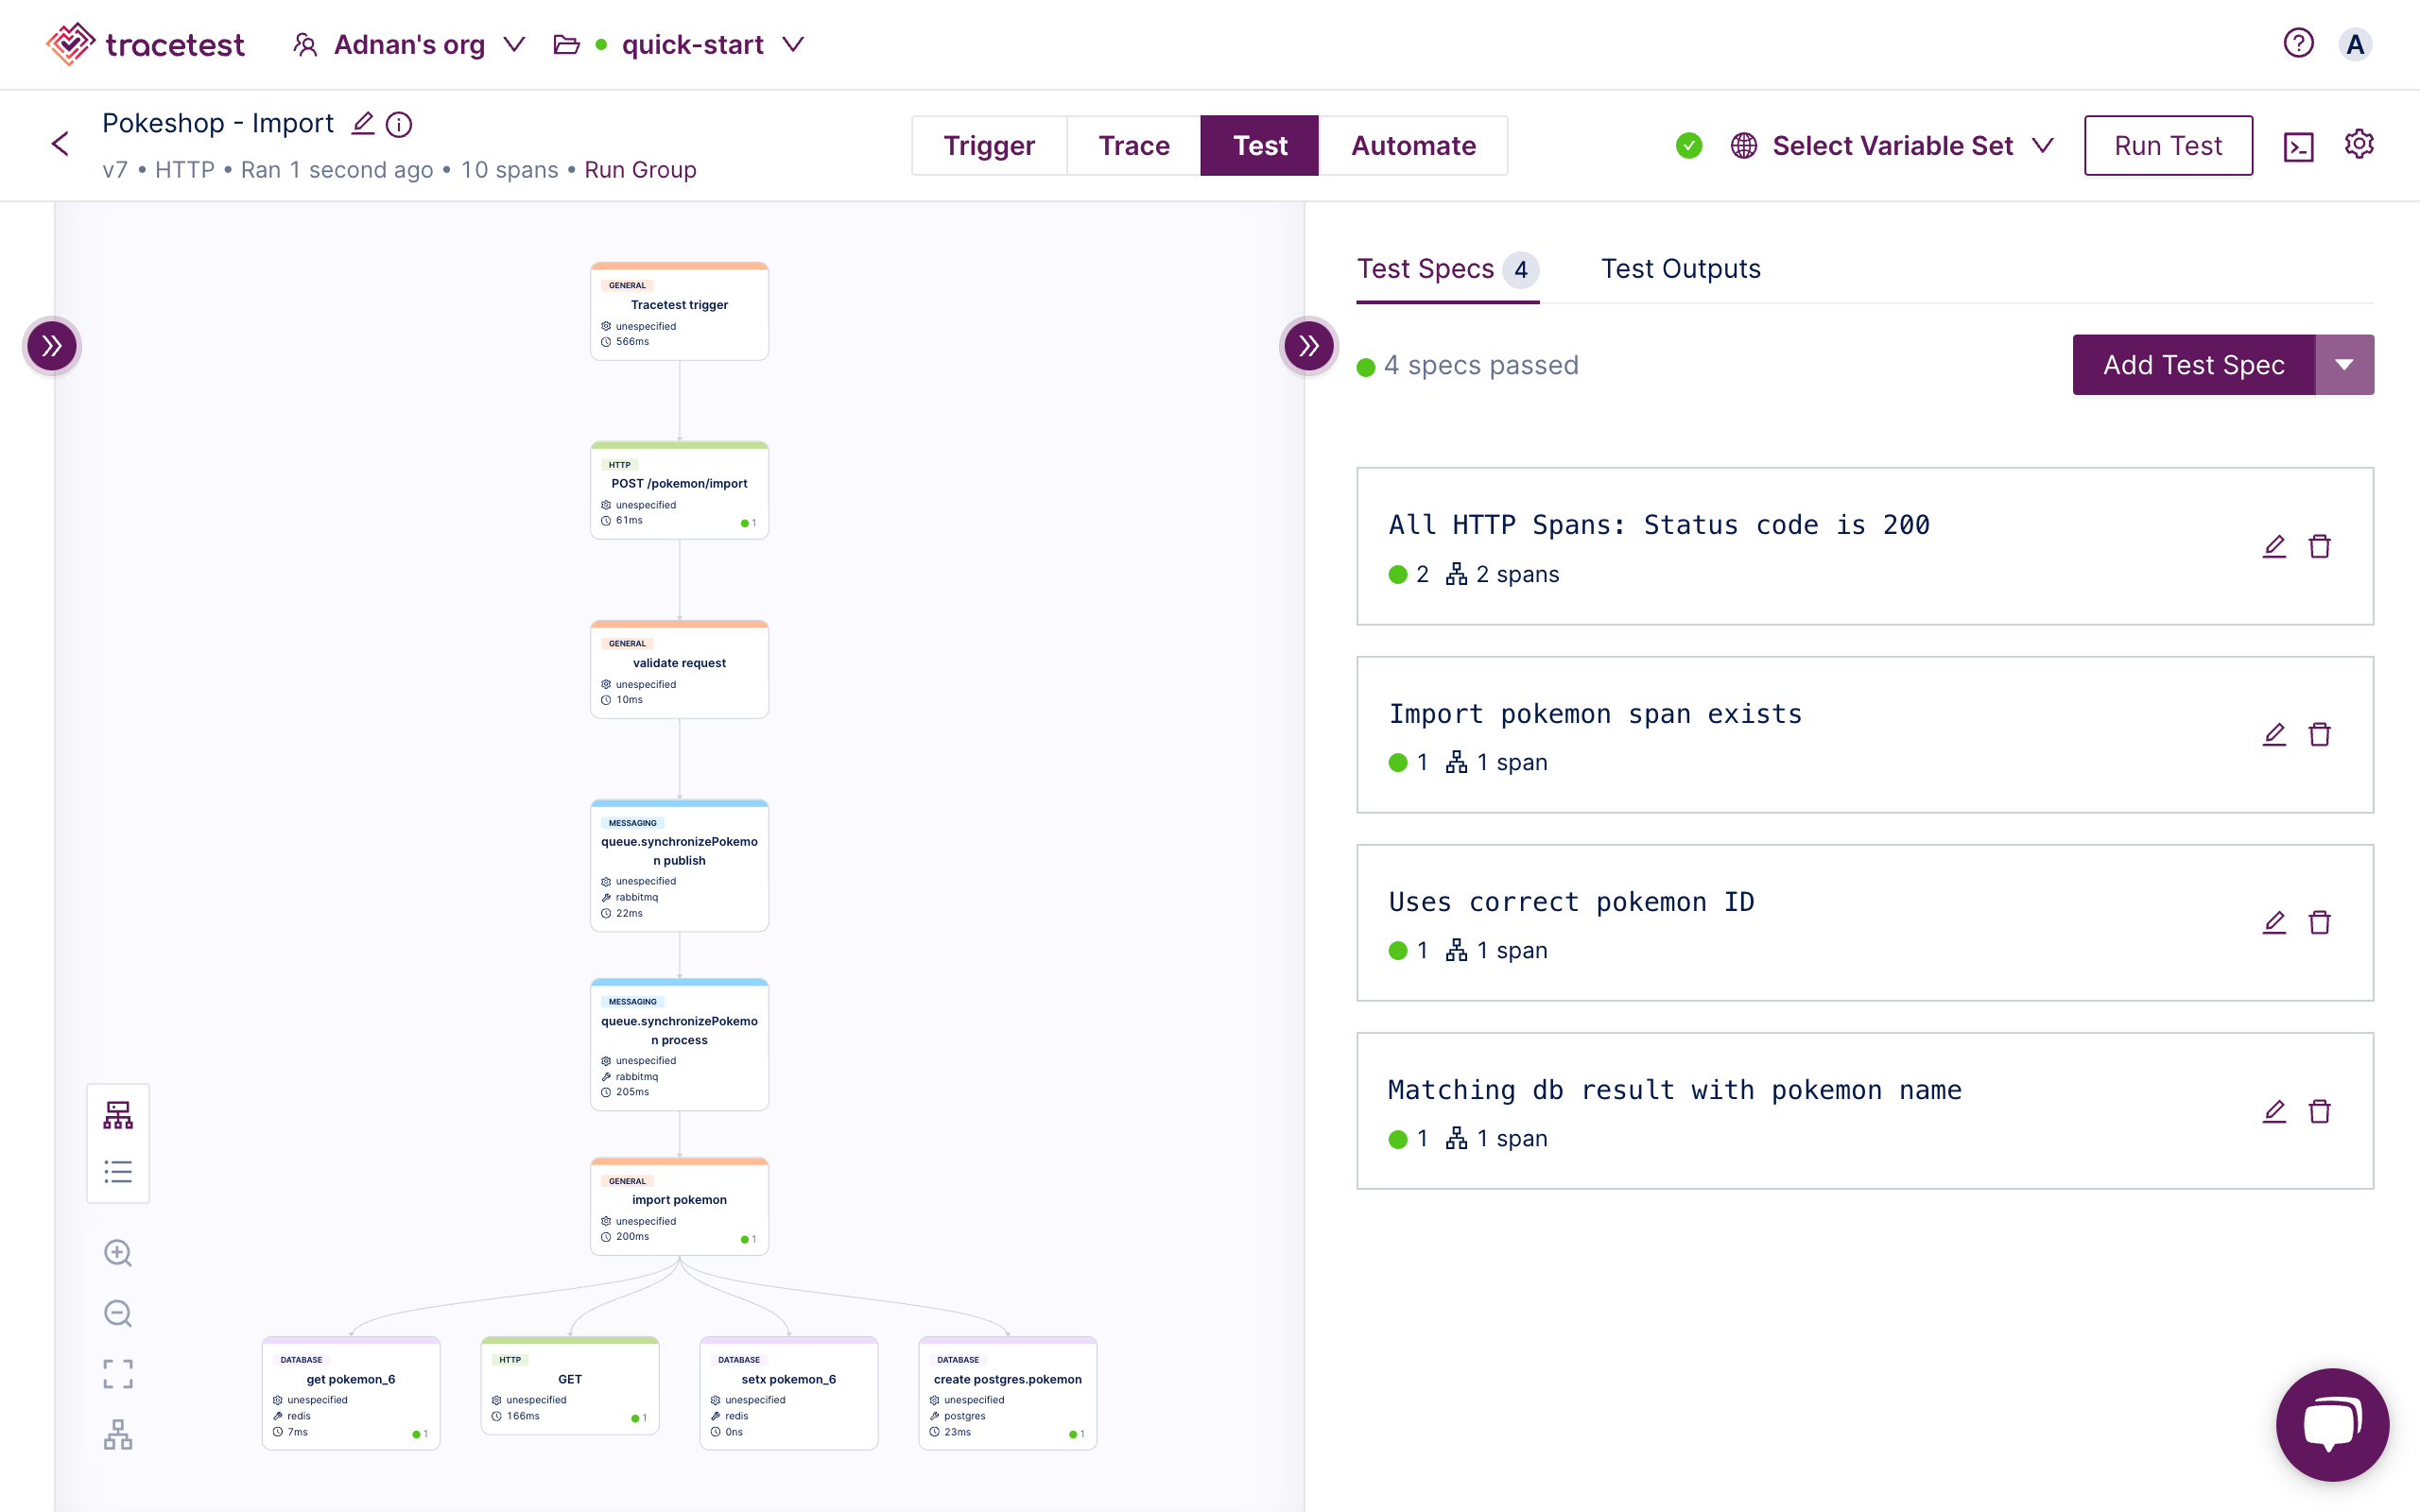
This complex test scenario will run an API test with specs against trace data and give you deep assertion capabilities for microservices and async processes that are incredibly difficult to test with legacy testing tools.
With the test scenarios laid out, let’s automate!
## Run Automated Tests with Tracetest
Tracetest is designed to work with all CI/CD platforms and automation tools. To enable Tracetest to run in CI/CD environments, make sure to [install the Tracetest CLI](https://docs.tracetest.io/getting-started/installation) and configure it to access your [Tracetest account](https://docs.tracetest.io/cli/reference/tracetest_configure#tracetest-configure).
Installing the CLI is a single command.
```bash
brew install kubeshop/tracetest/tracetest
```
Move back to the Tracetest Web UI in the test you created, click the `Automate` tab. Next, configure your CLI to connect to your Tracetest account.
```bash
tracetest configure --organization <YOUR_TRACETEST_ORG> --environment <YOUR_TRACETEST_ENV>
```
You can also configure the CLI with an API token.
```bash
tracetest configure -t <YOUR_TRACETEST_API_TOKEN>
```
The `-t` flag uses `<YOUR_TRACETEST_API_TOKEN>`. It represents the environment in your Tracetest account's organization.
Let's run automated tests!
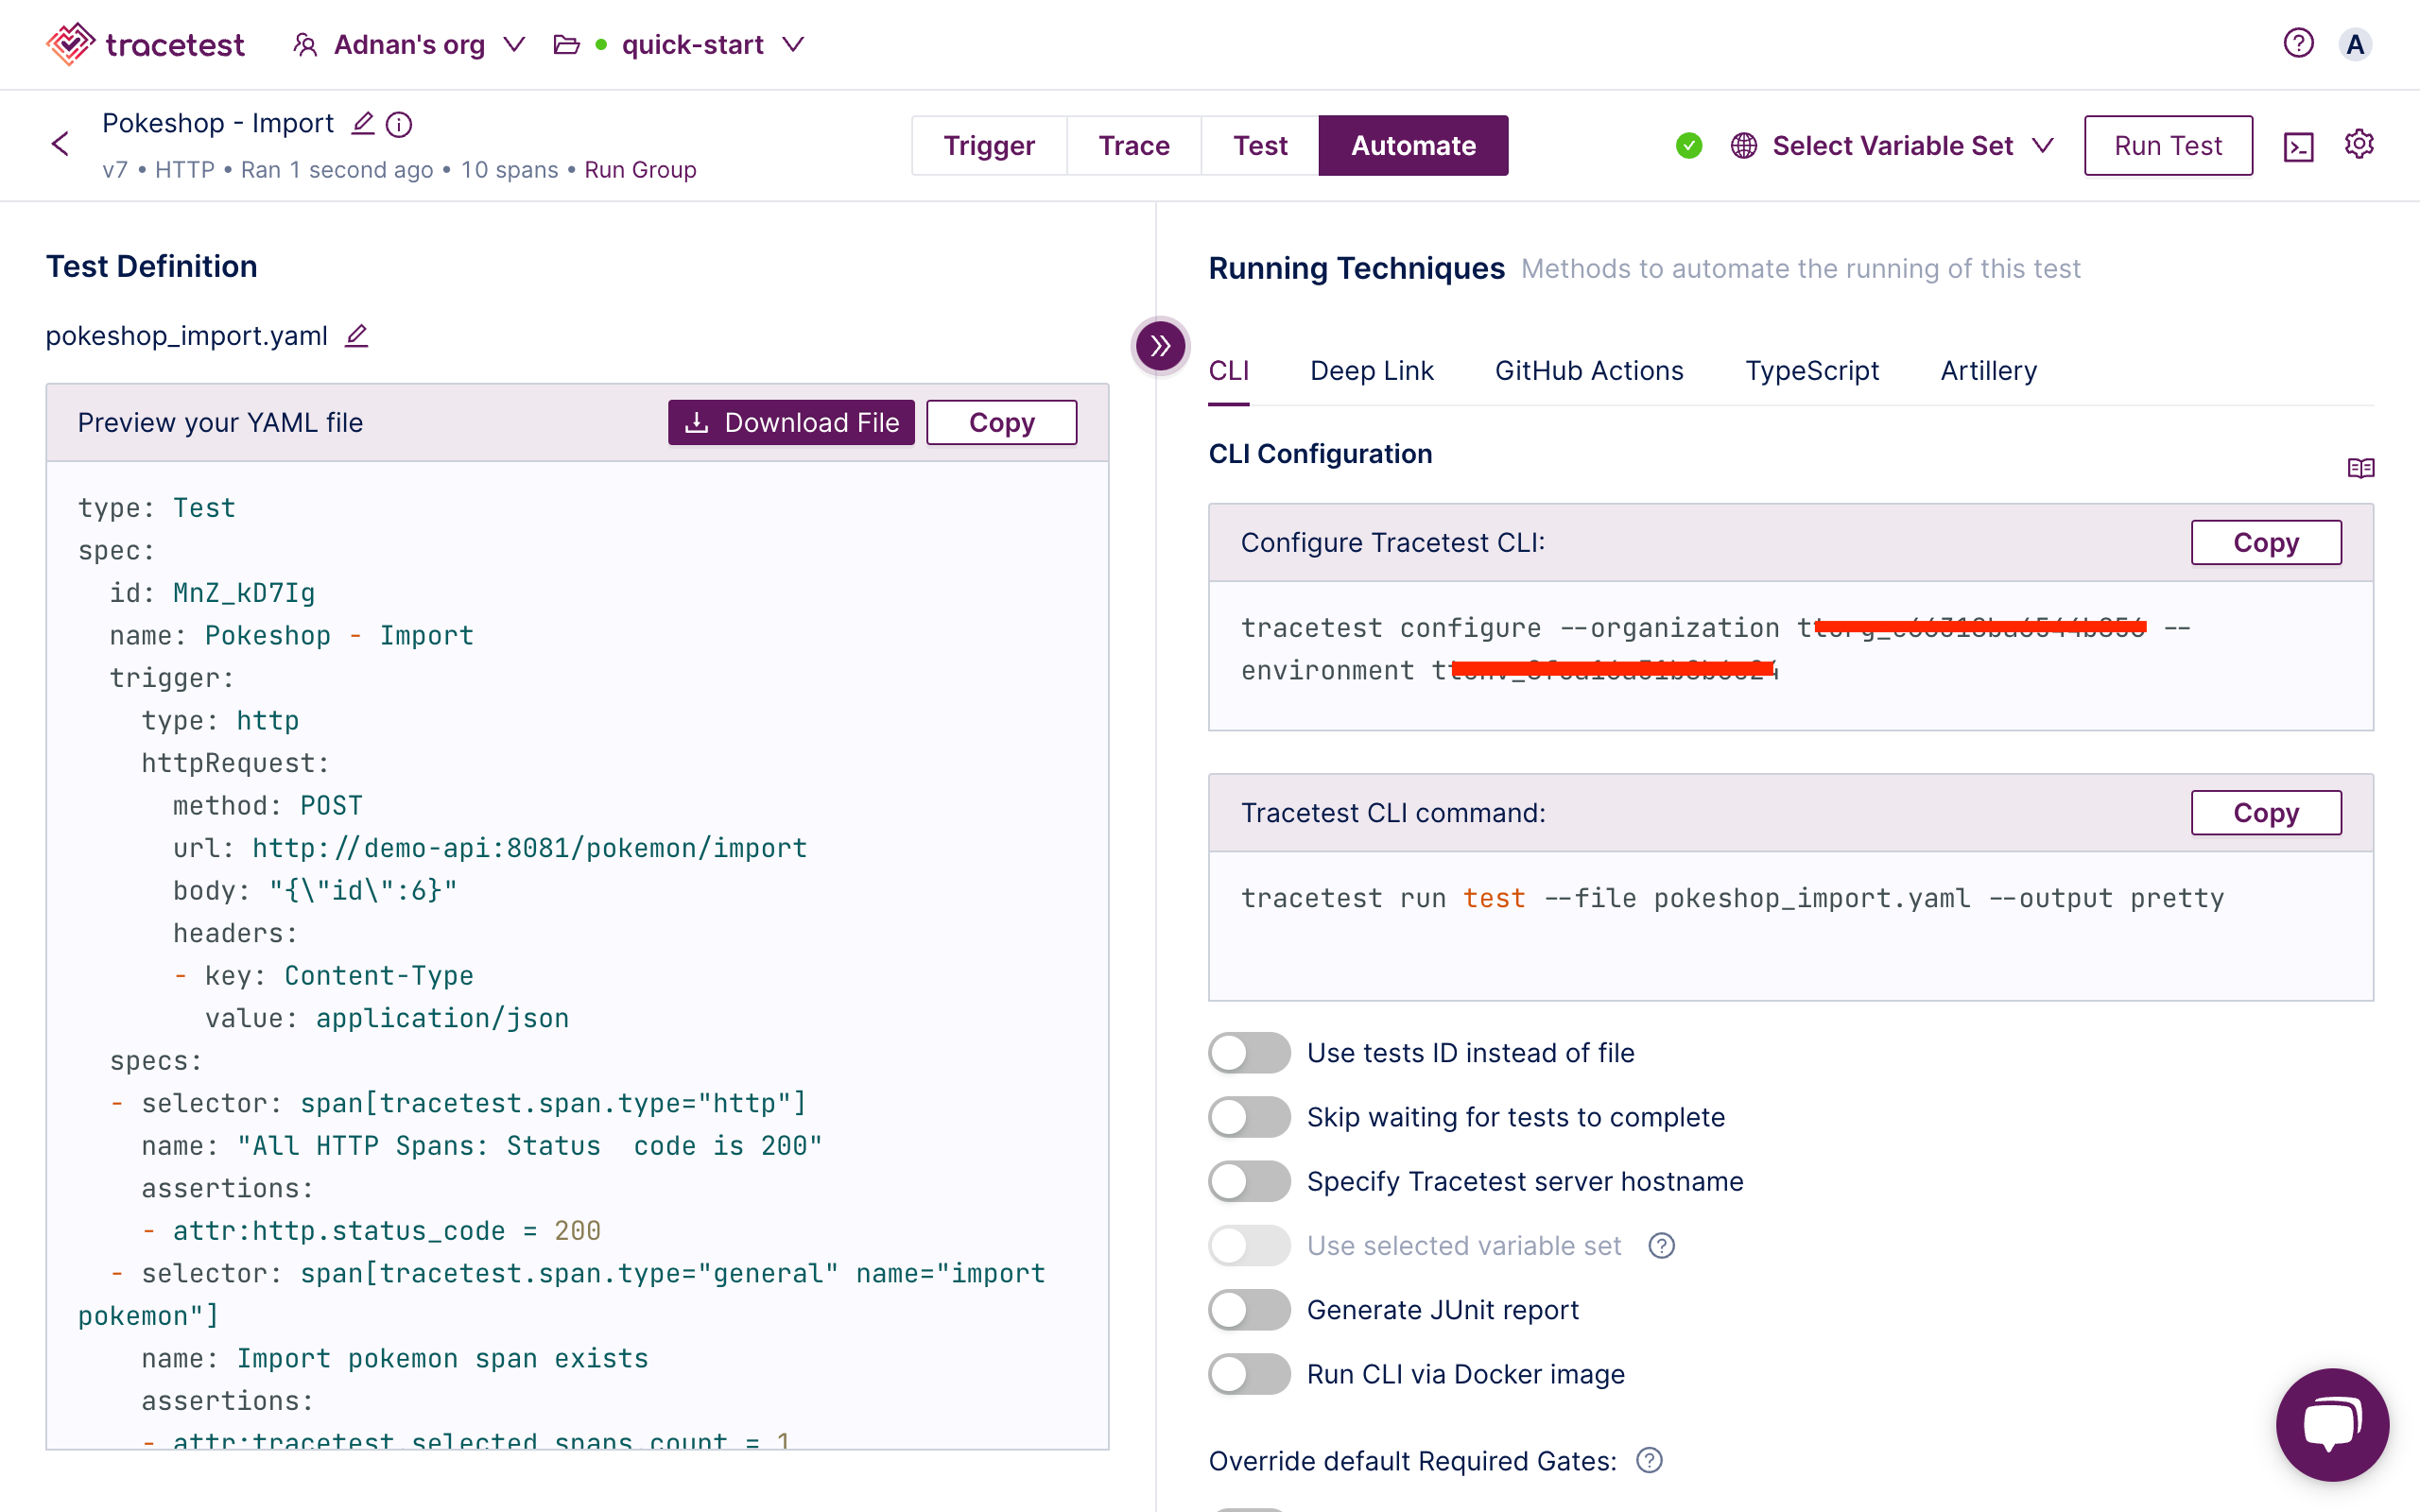
### Create a Tracetest Test Definition
But, first, you need a test definition. In the Tracetest Web UI go back to the `Automate` tab and download the test definition.
Give it a name. I’ll call it `test.yaml` because reasons. 😁
```yaml
# test.yaml
type: Test
spec:
id: MnZ_kD7Ig
name: Pokeshop - Import
trigger:
type: http
httpRequest:
method: POST
url: http://demo-api:8081/pokemon/import
body: "{\"id\":6}"
headers:
- key: Content-Type
value: application/json
specs:
- selector: span[tracetest.span.type="http"]
name: "All HTTP Spans: Status code is 200"
assertions:
- attr:http.status_code = 200
- selector: span[tracetest.span.type="general" name="import pokemon"]
name: Import pokemon span exists
assertions:
- attr:tracetest.selected_spans.count = 1
- selector: span[tracetest.span.type="database" name="get pokemon_6" db.system="redis" db.operation="get" db.redis.database_index="0"]
name: Uses correct pokemon ID
assertions:
- attr:db.payload = '{"key":"pokemon_6"}'
- selector: span[tracetest.span.type="database" name="create postgres.pokemon" db.system="postgres" db.name="postgres" db.user="postgres" db.operation="create" db.sql.table="pokemon"]
name: Matching db result with pokemon name
assertions:
- attr:db.result contains "charizard"
```
This test definition contains the HTTP trigger and test specs for the API test.
```yaml
# Trigger
trigger:
type: http
httpRequest:
method: POST
url: http://demo-api:8081/pokemon/import
body: "{\"id\":6}"
headers:
- key: Content-Type
value: application/json
# Test Specs
specs:
- selector: span[tracetest.span.type="http"]
name: "All HTTP Spans: Status code is 200"
assertions:
- attr:http.status_code = 200
- selector: span[tracetest.span.type="general" name="import pokemon"]
name: Import pokemon span exists
assertions:
- attr:tracetest.selected_spans.count = 1
- selector: span[tracetest.span.type="database" name="get pokemon_6" db.system="redis" db.operation="get" db.redis.database_index="0"]
name: Uses correct pokemon ID
assertions:
- attr:db.payload = '{"key":"pokemon_6"}'
- selector: span[tracetest.span.type="database" name="create postgres.pokemon" db.system="postgres" db.name="postgres" db.user="postgres" db.operation="create" db.sql.table="pokemon"]
name: Matching db result with pokemon name
assertions:
- attr:db.result contains "charizard"
```
If you wanted to, you could have written this entire test in YAML right away!
### Run a Tracetest Test with the CLI
Once you’ve saved the file, triggering the test with the CLI is done like this.
```bash
tracetest run test --file test.yaml --output pretty
[Output]
✔ RunGroup: #Jr0-0K8IR (https://app.tracetest.io/organizations/ttorg_xxx/environments/ttenv_xxx/run/Jr0-0K8IR)
Summary: 1 passed, 0 failed, 0 pending
✔ Pokeshop - Import (https://app.tracetest.io/organizations/ttorg_xxx/environments/ttenv_xxx/test/MnZ_kD7Ig/run/13/test) - trace id: 9c08904ad2e09dd1d5b6040cf98aac21
✔ All HTTP Spans: Status code is 200
✔ Import pokemon span exists
✔ Uses correct pokemon ID
✔ Matching db result with pokemon name
```
You can access the test run by following the URL in the test response.
To automate this behavior, you’ll specify a list of test definitions and run them with the CLI in your preferred CI/CD platform.
Alternatively, you do not need to download the CLI in your CI/CD platform. Instead, use the official [Tracetest Agent Docker image](https://hub.docker.com/r/kubeshop/tracetest-agent).
Here’s a [list of guides](https://docs.tracetest.io/ci-cd-automation/overview) we’ve compiled for you in the docs.
- [GitHub Actions](https://docs.tracetest.io/ci-cd-automation/github-actions-pipeline)
- [GitHub Actions with Secrets](https://docs.tracetest.io/ci-cd-automation/github-actions-pipeline-with-secrets)
- [Testkube](https://docs.tracetest.io/ci-cd-automation/testkube-pipeline)
- [Tekton](https://docs.tracetest.io/ci-cd-automation/tekton-pipeline)
## Analyze Test Results
You have successfully configured both Grafana and Tracetest. By enabling distributed tracing and trace-based testing, you can now monitor test executions and analyze the captured traces to gain insights into your API's performance and identify any issues.
Use Grafana Tempo's querying capabilities to filter and search for specific traces based on attributes like service name, operation name, or tags. This will help you pinpoint the root cause of any performance degradation or errors.
Leverage Grafana's rich visualization capabilities to create dashboards and charts to track the performance and health of your APIs over time.
Use Tracetest to leverage existing distributed traces to power trace-based testing. You can define tests and assertions against every single microservice that a trace goes through. With Tracetest, you can work with Grafana Tempo to define assertions against both the response and trace data. This ensures both your response and the underlying processes work as expected. Finally, save and run the tests in CI pipelines with the Tracetest CLI to enable automation.
## How Grafana Works with Tracetest to Enhance Observability
In conclusion, by combining Grafana Tempo with Tracetest, you can effectively monitor and test your APIs using distributed tracing. This tutorial has provided a step-by-step guide to setting up and using these powerful tools, enabling you to ensure the reliability, performance, and scalability of your APIs in complex distributed systems.
Do you want to learn more about Tracetest and what it brings to the table? Check the [docs](https://docs.tracetest.io/examples-tutorials/recipes/running-tracetest-with-grafana-cloud-tempo-pokeshop) and try it out by [signing up](https://app.tracetest.io/) it today!
Also, please feel free to join our [Slack community](https://dub.sh/tracetest-community), give [Tracetest a star on GitHub](https://github.com/kubeshop/tracetest), or schedule a [time to chat 1:1](https://calendly.com/ken-kubeshop).
.jpg)
.avif)
.avif)