
Level Up Node.js E2E + Integration Testing with OpenTelemetry
.avif)

Learn how to set up a Node.js app with OpenTelemetry instrumentation and integrate Tracetest for enhanced E2E and integration tests using trace-based testing.
Table of Contents
In this guide, I'll walk you through setting up a Node.js application with OpenTelemetry instrumentation and integrating Tracetest to enhance your end-to-end (E2E) and integration tests using trace-based testing.
## What is OpenTelemetry
[OpenTelemetry](https://opentelemetry.io/) is an observability framework that enables developers to collect, generate, and manage telemetry data from their applications. It provides a set of APIs, SDKs, and instrumentation libraries that allow developers to instrument their code and capture metrics, traces, and logs.
It’s a powerful tool for understanding the behavior of complex distributed systems and improving the observability and reliability of applications.
## What is Tracetest
[Tracetest](https://tracetest.io/) is a trace-based testing tool based on OpenTelemetry. It is designed to assist in effectively testing distributed applications. By using data from distributed traces generated by OpenTelemetry, Tracetest lets you easily validate and assert that Node.js apps work as intended, according to predefined test definitions.
## Prerequisites
Before we start, ensure you have the following prerequisites in place:
- [Docker](https://docs.docker.com/get-docker/) (optional)
- Node.js and npm installed on your machine
## Project Structure
The project contains a Node.js app with OpenTelemetry instrumentation. The Node.js app, a simple Express application, is contained in the `app.js` file. The OpenTelemetry tracing functionality is encapsulated in either `tracing.otel.grpc.js` or `tracing.otel.http.js` files, allowing traces to be sent to Tracetest Agent.
You install the Tracetest Agent and run it locally in your development environment.
Let's dive into the setup.
## Tracetest Agent for Local Development with OpenTelemetry
[Install the Tracetest CLI](https://docs.tracetest.io/getting-started/installation#install-the-tracetest-cli) to start the Tracetest Agent.
To start the Tracetest Agent locally, execute the following command in your terminal:
```bash
tracetest start
```
Once initiated, the Tracetest Agent will:
- Expose OTLP ports `4317` (gRPC) and `4318` (HTTP) for trace ingestion.
- Enable triggering test runs within its environment.
- Facilitate connection to a trace data store inaccessible outside your environment, such as a Jaeger instance running within the cluster without an Ingress controller.
## Node.js App with OpenTelemetry Instrumentation
The Node.js app is a straightforward Express application contained in the `app.js` file.
Here’s the simple `app.js` file:
```jsx
const express = require("express")
const app = express()
app.get("/", (req, res) => {
setTimeout(() => {
res.send("Hello World")
}, 1000);
})
app.listen(8080, () => {
console.log(`Listening for requests on http://localhost:8080`)
})
```
Depending on your choice, traces will be sent to Tracetest Agent's `gRPC` or `HTTP` endpoint. Configure this using the `OTEL_EXPORTER_OTLP_TRACES_ENDPOINT` environment variable.
Here's a snippet from the `tracing.otel.grpc.js` file:
```jsx
const opentelemetry = require('@opentelemetry/sdk-node');
const { getNodeAutoInstrumentations } = require('@opentelemetry/auto-instrumentations-node');
const { OTLPTraceExporter } = require('@opentelemetry/exporter-trace-otlp-grpc');
const sdk = new opentelemetry.NodeSDK({
traceExporter: new OTLPTraceExporter(),
instrumentations: [getNodeAutoInstrumentations()],
});
sdk.start();
```
To enable the tracer, preload the trace file using the following command:
```bash
node -r ./tracing.otel.grpc.js app.js
```
In the `package.json`, you'll find npm scripts to run the respective tracers alongside the `app.js`:
```json
"scripts": {
"with-grpc-tracer": "node -r ./tracing.otel.grpc.js app.js",
"with-http-tracer": "node -r ./tracing.otel.http.js app.js"
}
```
To start the server, run one of the following commands:
```bash
npm run with-grpc-tracer
# or
npm run with-http-tracer
```
## Running the Node.js App with Docker Compose
To run the Node.js app using Docker Compose, we have provided a `docker-compose.yaml` file and `Dockerfile`. The `Dockerfile` employs the specified command for running the application:
```text
FROM node:slim
WORKDIR /usr/src/app
COPY package*.json ./
RUN npm install
COPY . .
EXPOSE 8080
CMD [ "npm", "run", "with-grpc-tracer" ]
```
The `docker-compose.yaml` file defines a service for the Node.js app:
```yaml
version: '3'
services:
app:
image: quick-start-nodejs
extra_hosts:
- "host.docker.internal:host-gateway"
build: .
ports:
- "8080:8080"
environment:
- OTEL_EXPORTER_OTLP_TRACES_ENDPOINT=http://host.docker.internal:4317
```
To initiate, execute the following commands:
```bash
docker compose build # optional if you haven't already built the image
docker compose up
```
This will start the Node.js app and direct the traces to the Tracetest Agent.
## Running the Node.js App Locally
For running the Node.js app locally, follow these steps:
1. Install Node.js and npm in your local development environment.
2. Install the npm modules, export the OTLP endpoint, and run the Node.js app:
```bash
npm i
export OTEL_EXPORTER_OTLP_TRACES_ENDPOINT=http://localhost:4317
npm run with-grpc-tracer
```
This will start the Node.js app and send the traces to Tracetest Agent.
## Create your First Trace-based Test
Navigate to [Tracetest](https://app.tracetest.io/) and start creating tests. Make sure you use the `http://localhost:8080/` URL in your test creation to effectively utilize the trace-based testing provided by Tracetest.
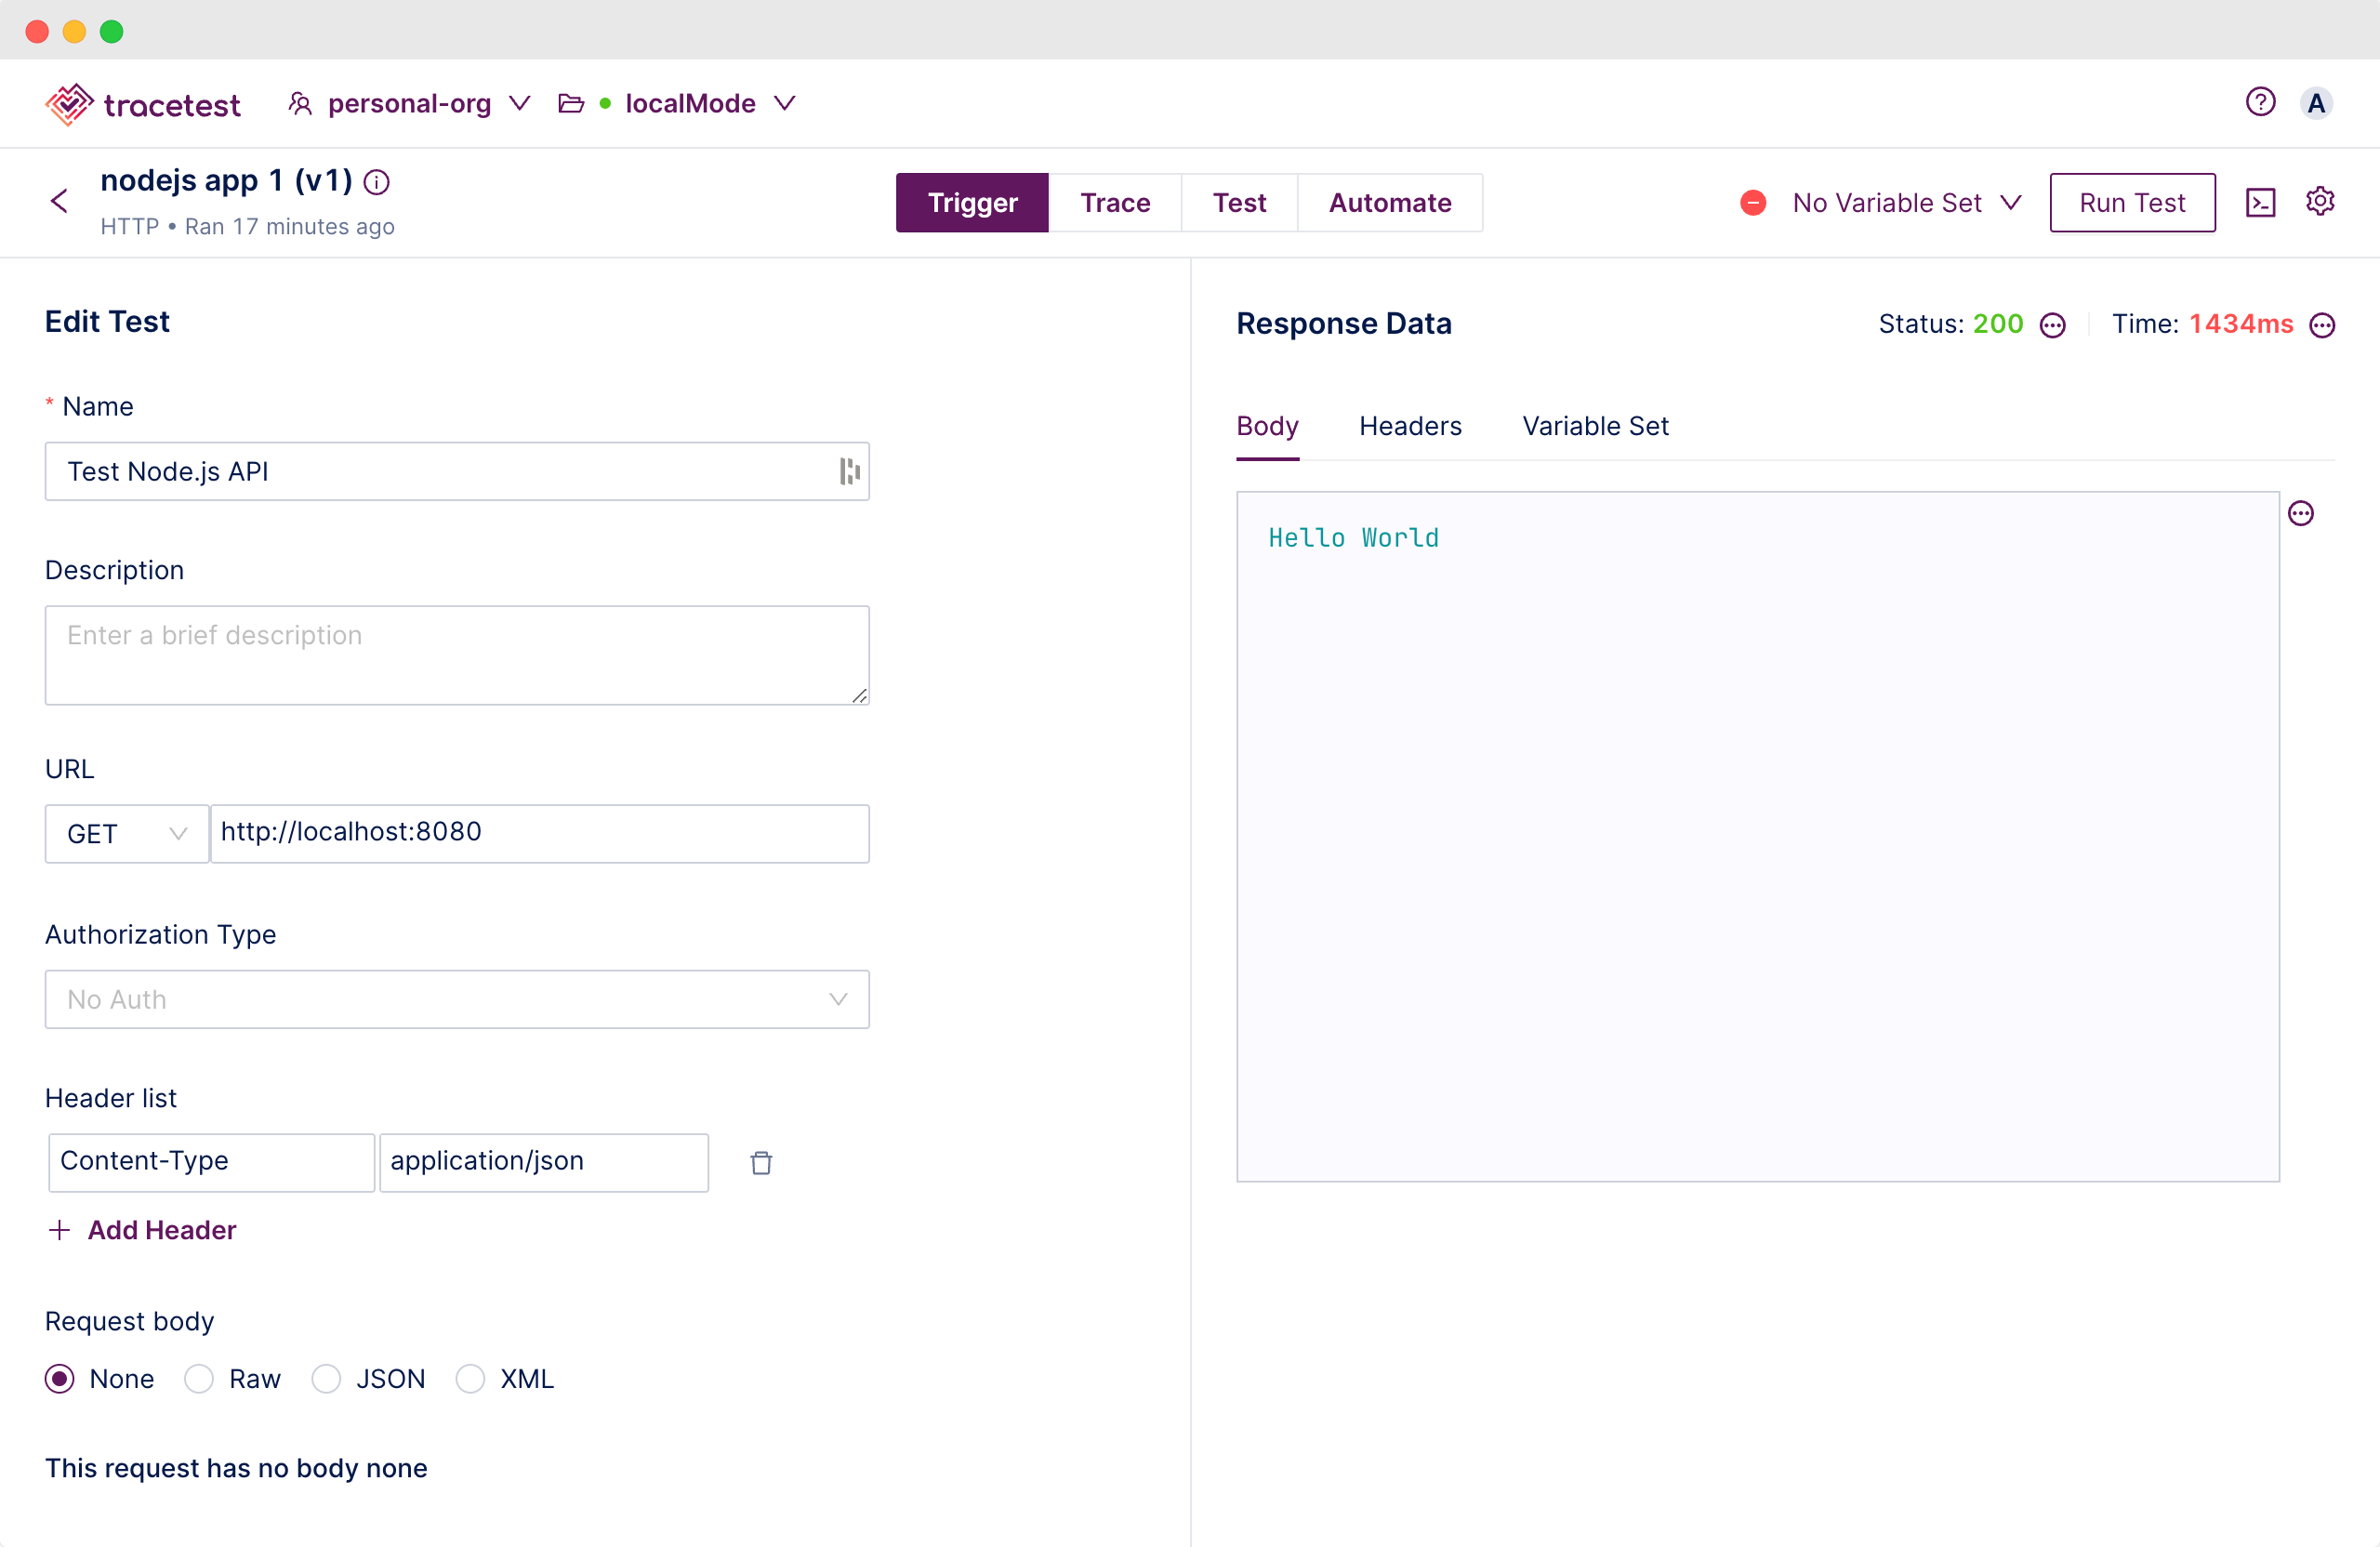
Now you can improve your E2E and integration tests in your Node.js applications using Tracetest and OpenTelemetry.
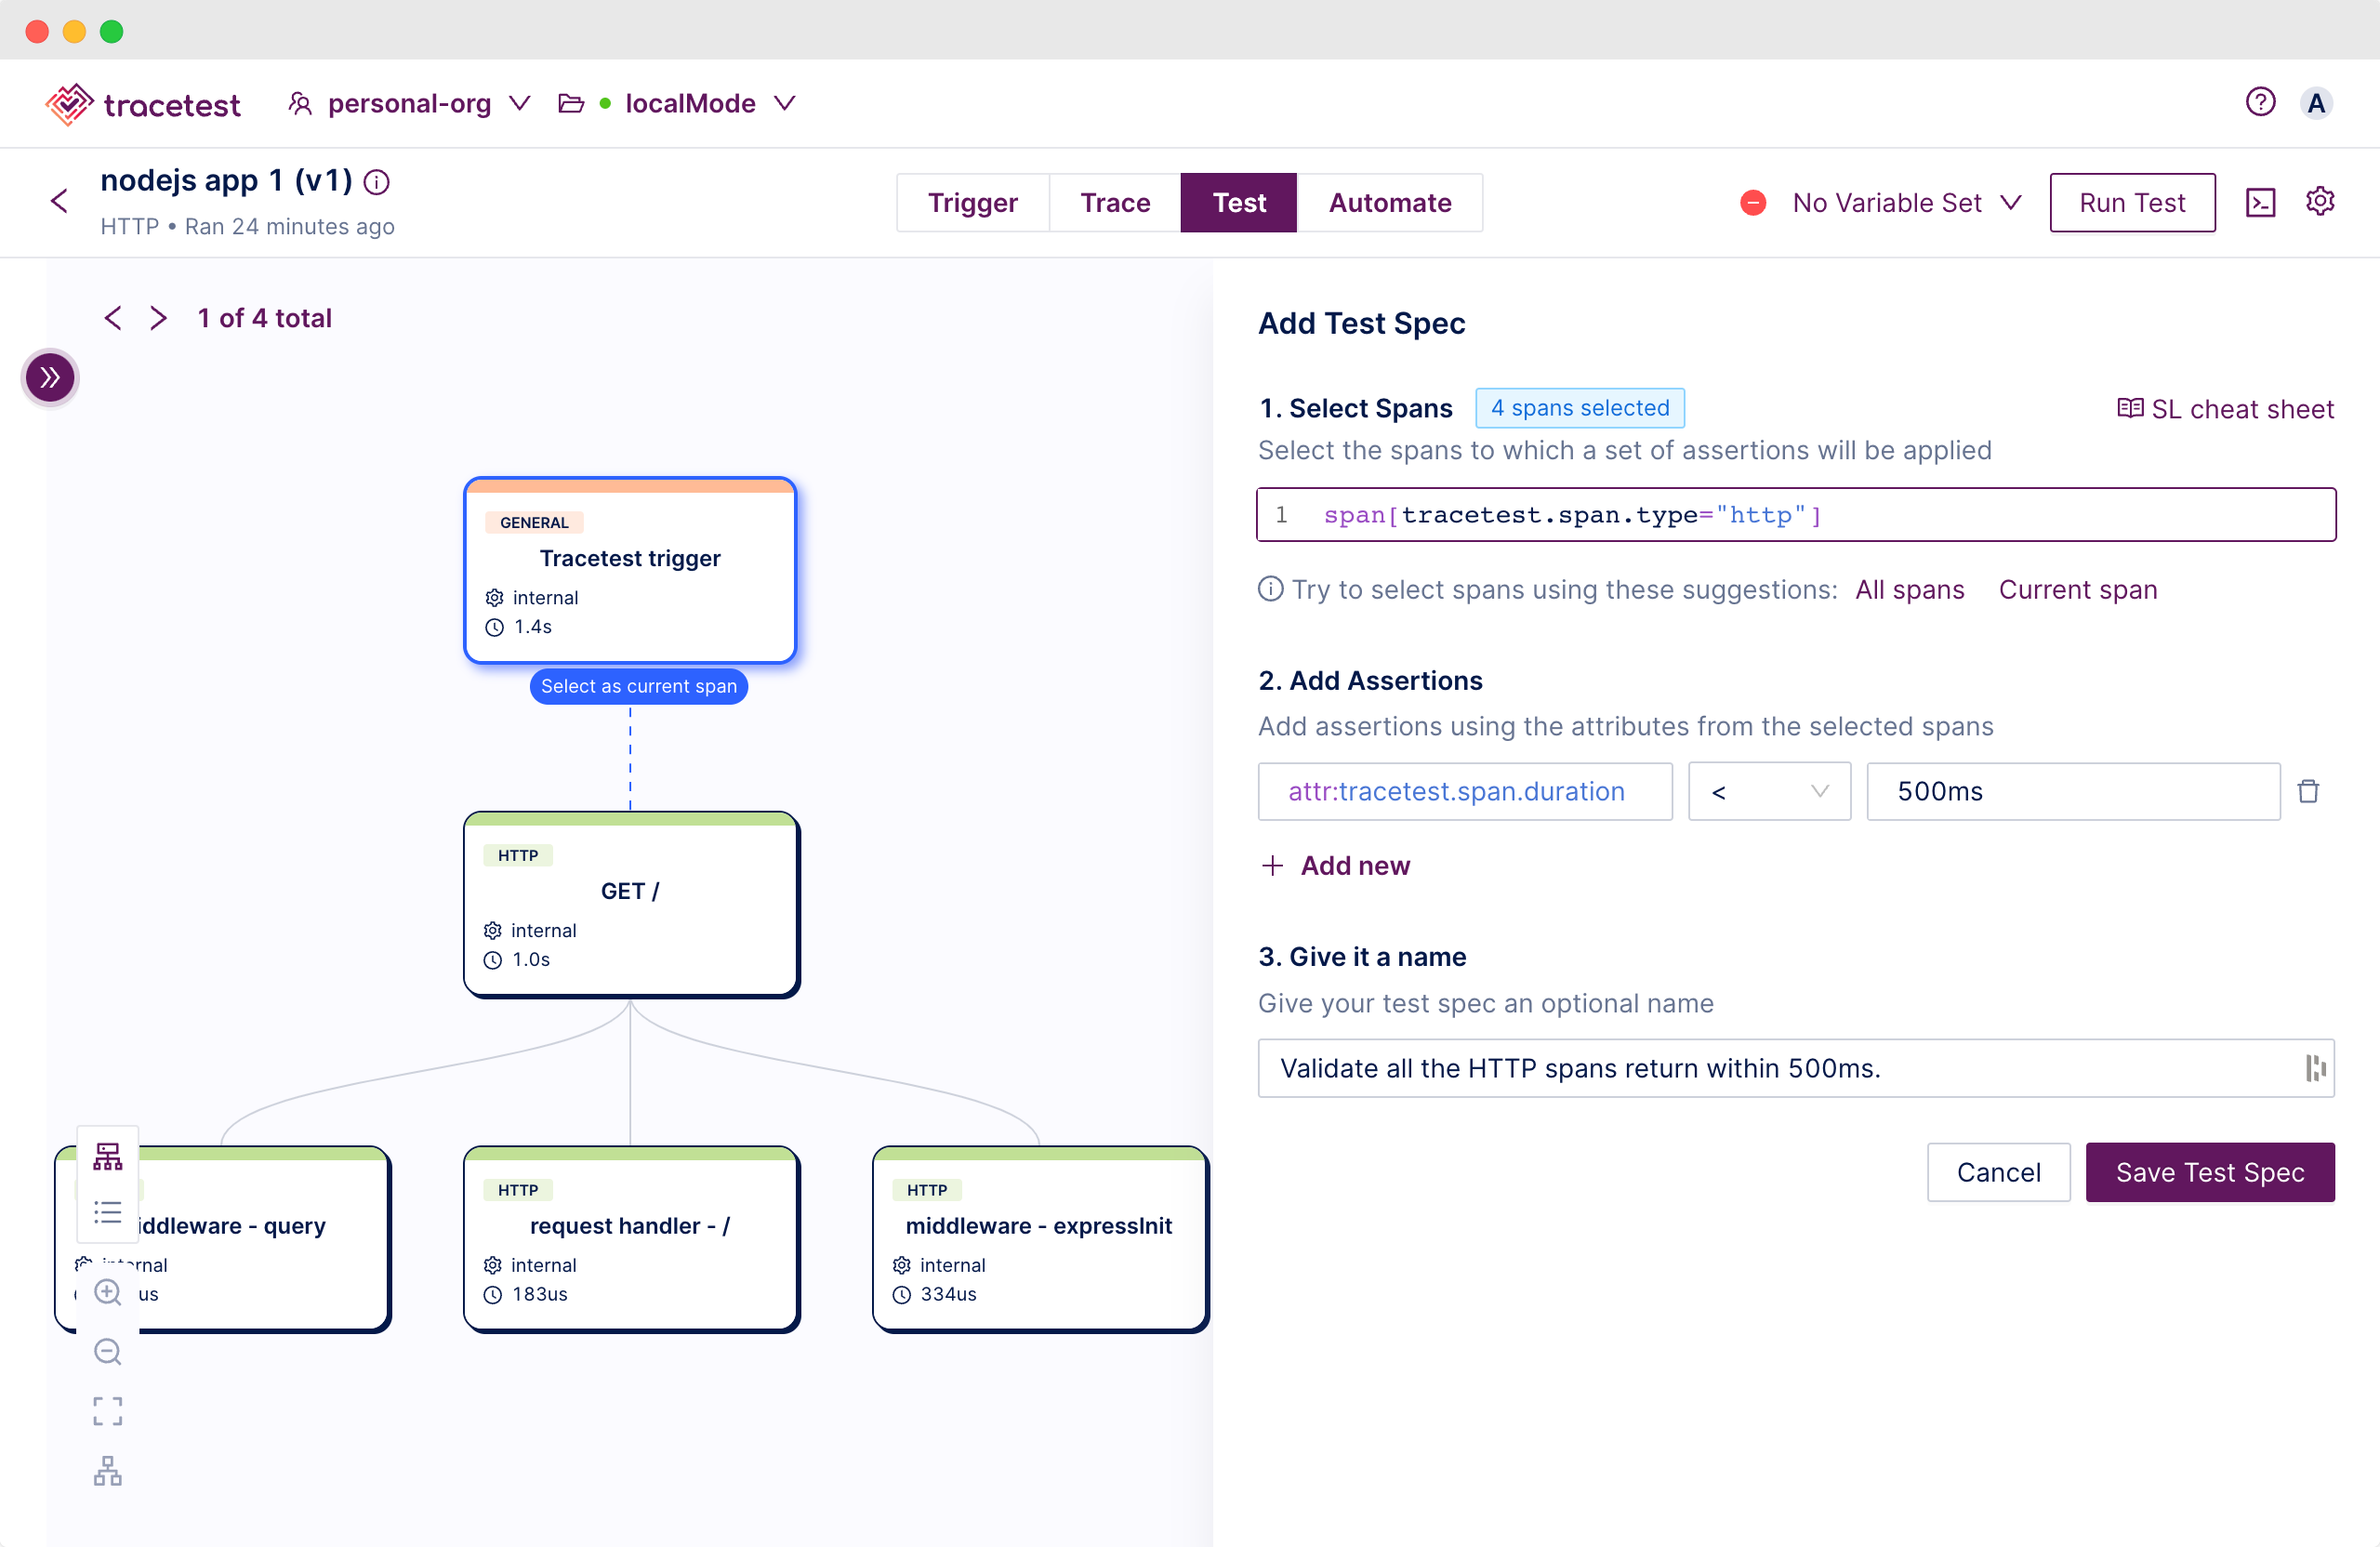
Move to the `Test` tab and start adding assertions.
Proceed to add a test spec to assert that all HTTP requests return within `500ms`. Click the `Add Test Spec` button.
In the span selector, make sure to add this selector:
```css
span[tracetest.span.type="http"]
```
It will select the HTTP spans.
In the assertion field, add:
```css
attr:tracetest.span.duration < 500ms
```
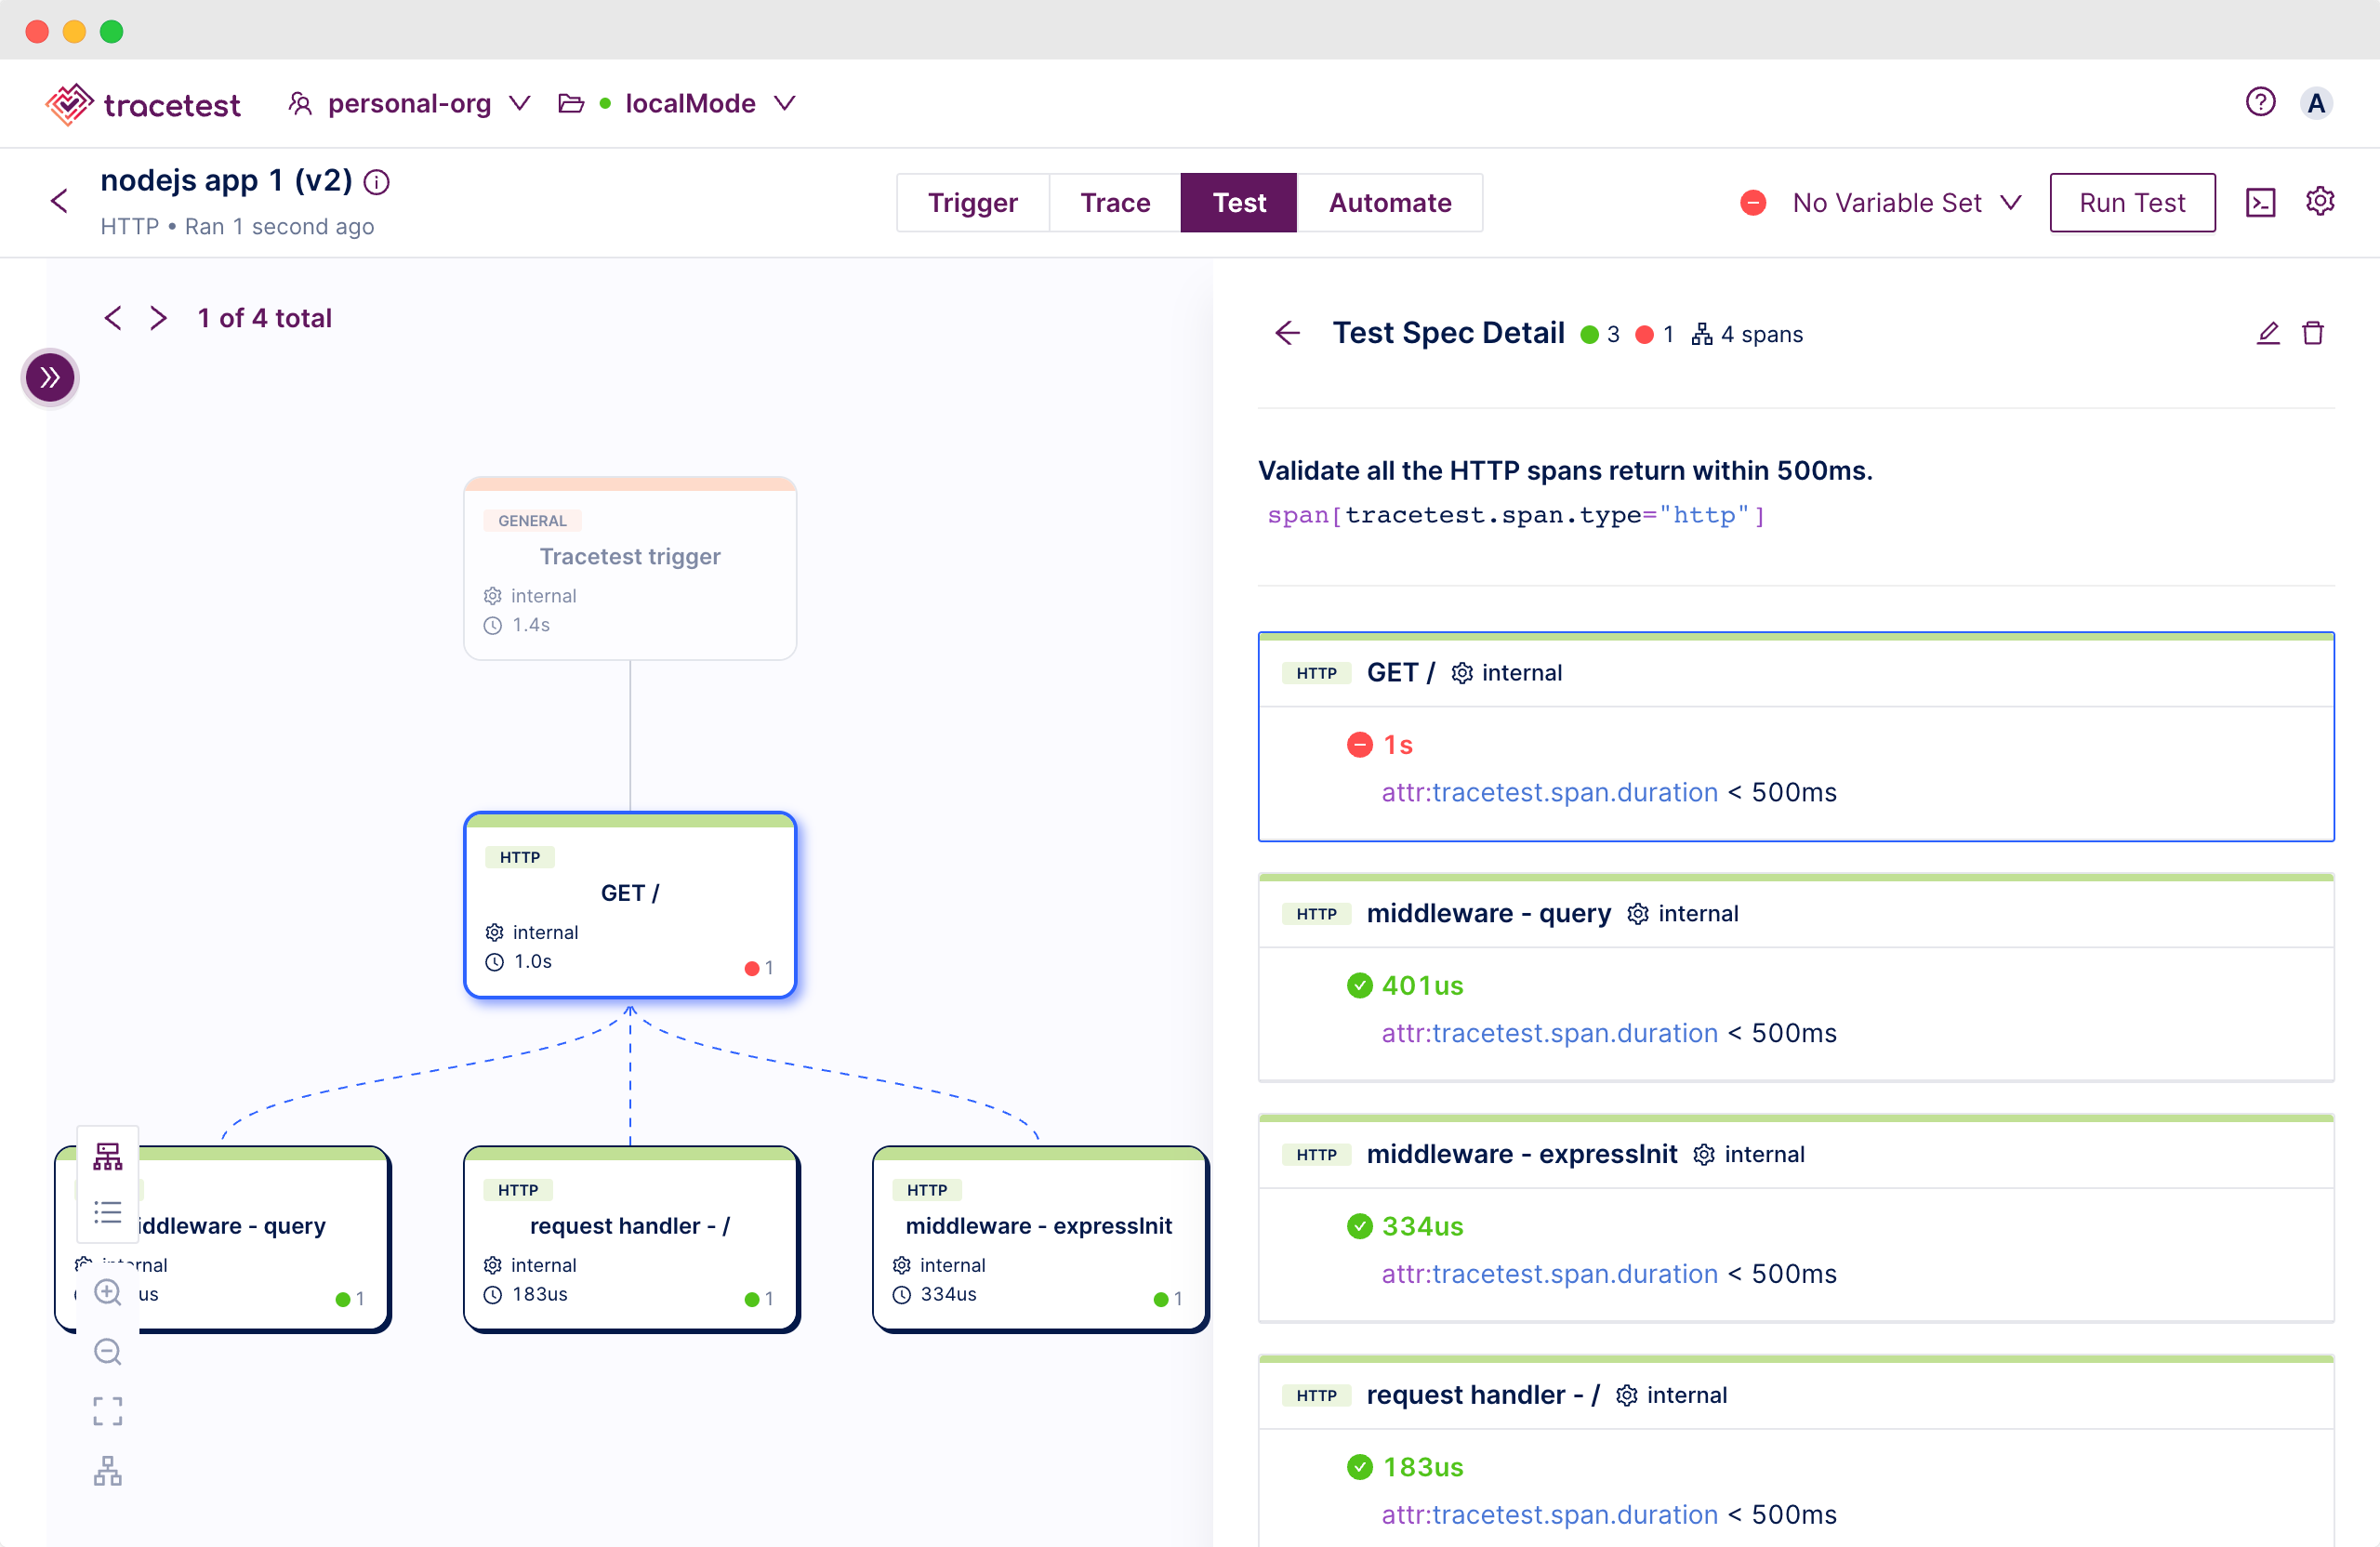
Save the test spec and publish the test.
This test spec will validate all HTTP spans making sure their duration is less than `500ms`.
If you’re wondering what else you can do with Tracetest. Let me tell you.
You can:
- **Assert** against both the **response and trace data** at every point of a request transaction.
- **Assert** on the **timing of trace spans**.
- Eg. A database span executes within `100ms`.
- **Wildcard assertions** across common activities.
- Eg. All gRPC return codes should be `0`.
- Eg. All database calls should happen in less than `100ms`.
- **Assert** against **side-effects**.
- Eg. Message queues, async API calls, external APIs, etc.
- **Integrate** with your **existing distributed tracing solution**.
- Define multiple test triggers:
- HTTP requests
- gRPC requests
- Trace IDs
- and many more...
- Save and run tests manually and via CI build jobs.
- Verify and analyze the quality of your OpenTelemetry instrumentation to enforce rules and standards.
- Test long-running processes.
**Build tests in minutes instead of days!**
What about [test suites](https://docs.tracetest.io/concepts/test-suites)? You can do that too. Create multiple tests and run them sequentially.
## Automate your Node.js Test
Tracetest is designed to work with all CI/CD platforms and automation tools. To enable Tracetest to run in CI/CD environments, make sure to install the Tracetest CLI.
Move to the `Automate` tab. Here you’ll find a test definition.
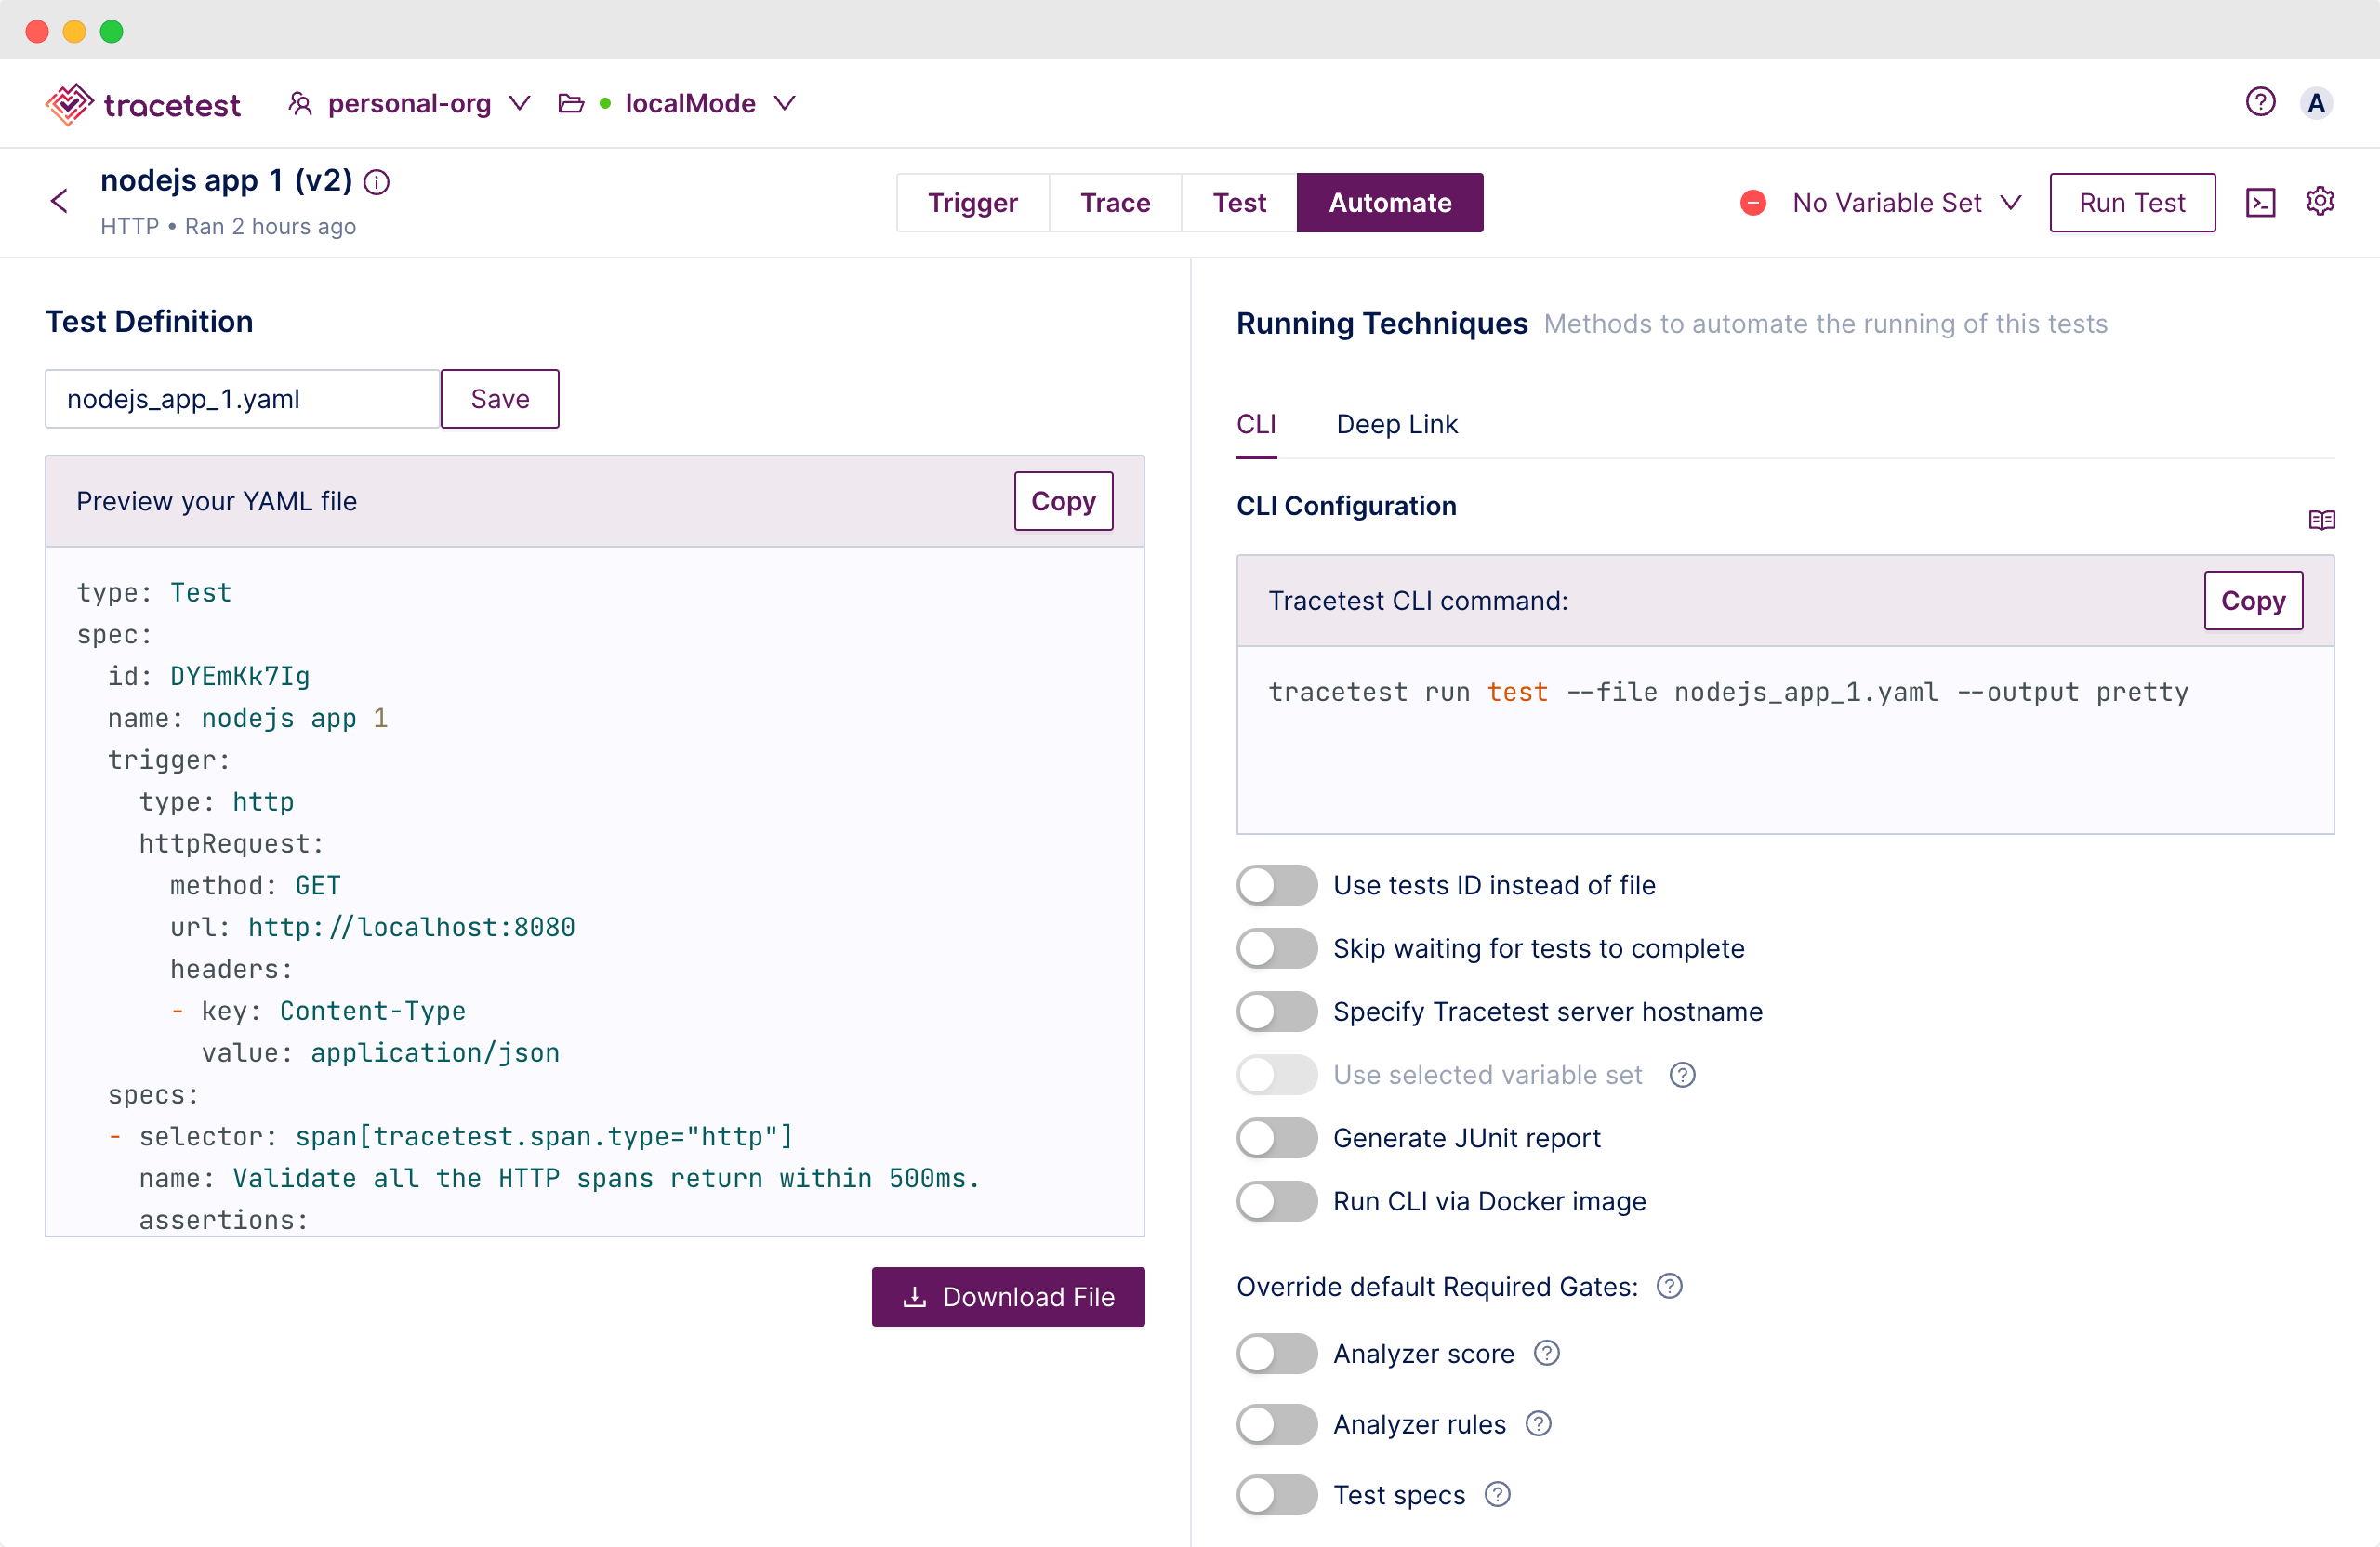
You can run the test with a CLI command either via the test ID, or a test definition file.
Let’s first try the test definition in case you want to keep tests in a GitHub repo.
Copy the test definition and paste into a file called `node-api-test.yaml`.
```yaml
type: Test
spec:
id: DYEmKk7Ig
name: nodejs app 1
trigger:
type: http
httpRequest:
method: GET
url: http://localhost:8080
headers:
- key: Content-Type
value: application/json
specs:
- selector: span[tracetest.span.type="http"]
name: Validate all the HTTP spans return within 500ms.
assertions:
- attr:tracetest.span.duration < 500ms
```
Run the test with the command below.
```bash
tracetest run test --file node-api-test.yaml --output pretty
```
Alternatively, you can run the test without a file by passing the test ID instead. Toggle the `Use tests ID instead of file` to on.
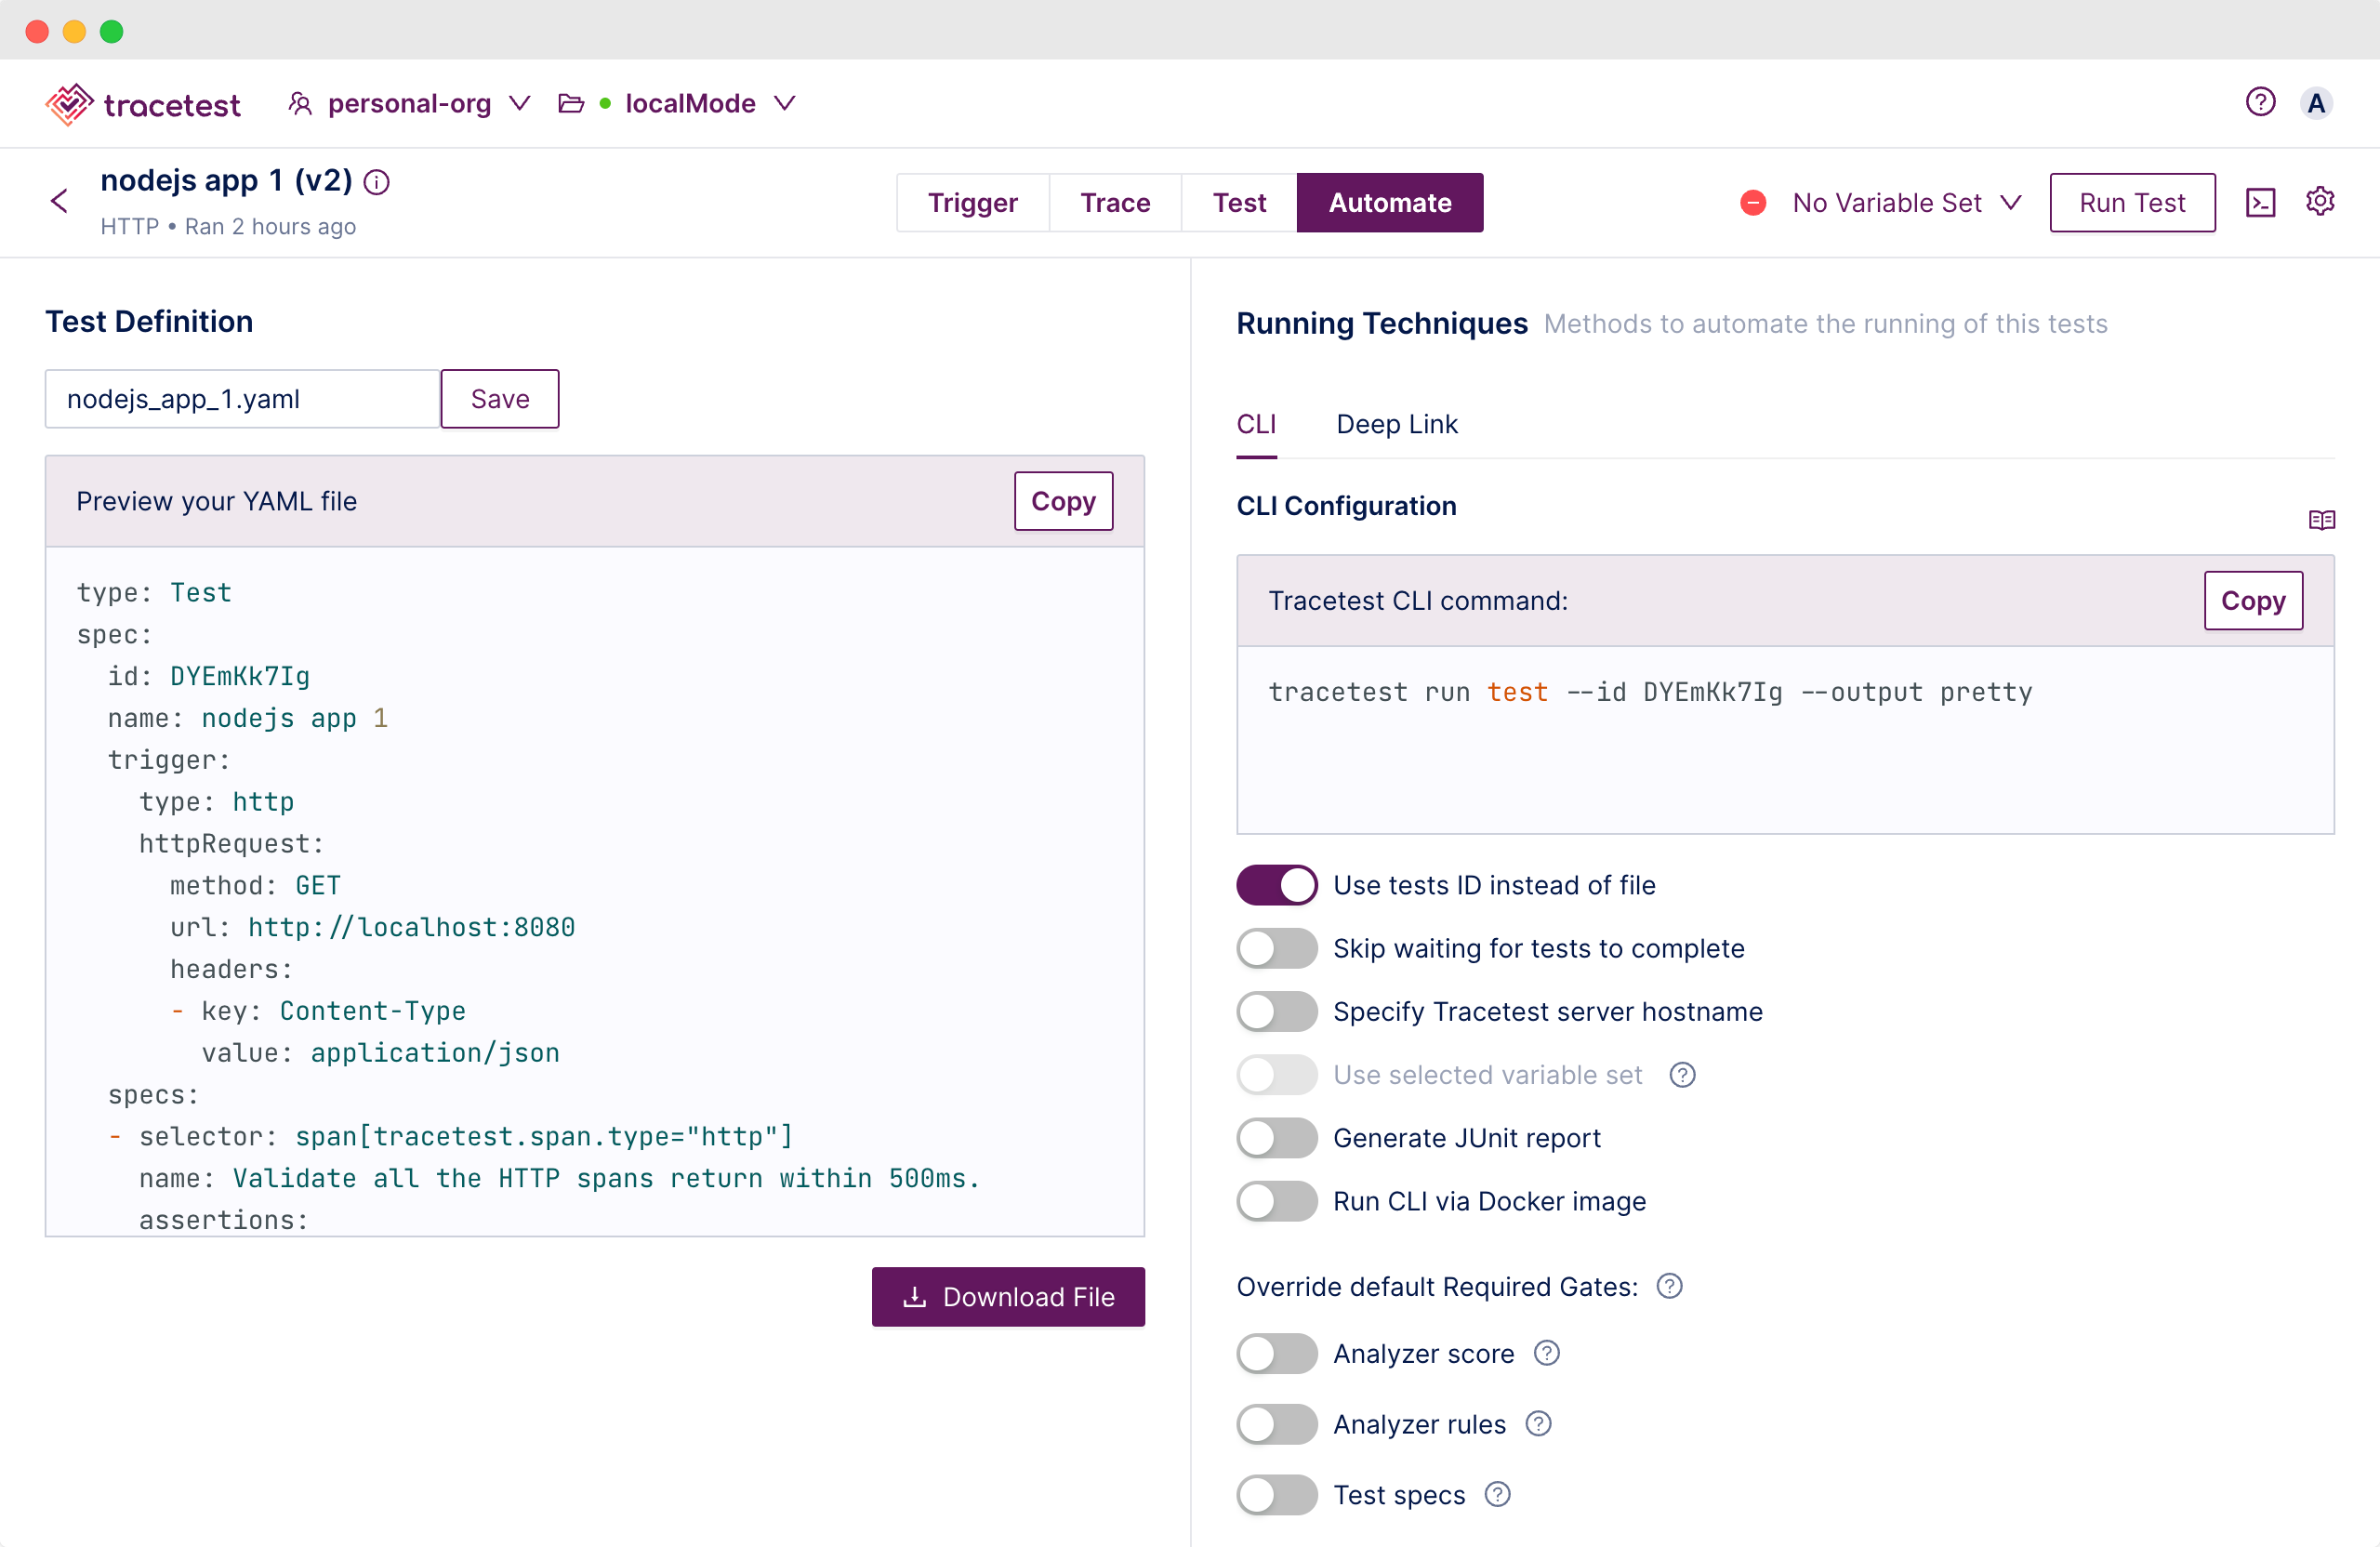
This will give you another command you can copy and run in the terminal.
```bash
tracetest run test --id DYEmKk7Ig --output pretty
[Output]
✘ nodejs-app-test-1 (https://app.tracetest.io/organizations/<orgid>/environments/<envid>/test/<testid>/run/7/test) - trace id: 5cf8c7bfe736428c3fe922a9ac95060e
✘ Validate all the HTTP spans return within 500ms.
✔ #bb72b34d9ce04d4a
✔ attr:tracetest.span.duration < 500ms (558us)
✔ #f5f919a47c3f222a
✔ attr:tracetest.span.duration < 500ms (479us)
✔ #5b2cb1a5762b9ea2
✔ attr:tracetest.span.duration < 500ms (313us)
✘ #9f0058fa82ece013
✘ attr:tracetest.span.duration < 500ms (1.1s)
```
Make sure to replace the test ID with your test ID.
Now you know how to run automated tests as well! Embedding the test definitions as part of your codebase will let you easily run integration and E2E tests in CI pipelines.
## Successfully Testing your OpenTelemetry Instrumented Node.js App!
By using data from distributed traces generated by OpenTelemetry, Tracetest ensures your applications align with predefined test specs.
This tutorial shows how to seamlessly integrate Tracetest with a Node.js application and use OpenTelemetry instrumentation to enhance end-to-end (E2E) and integration testing. This powerful combination not only improves testing capabilities but also enhances robustness and reliability throughout the development lifecycle.
With Tracetest and OpenTelemetry, testing becomes more than just a routine task; it becomes a strategic asset in delivering high-quality, well-tested applications!
## What's next?
Would you like to learn more about Tracetest and what it brings to the table? Check the [docs](https://docs.tracetest.io/examples-tutorials/recipes/running-tracetest-with-dynatrace) and try it out today by [downloading](https://tracetest.io/download) it today!
Also, please feel free to join our [Slack community](https://dub.sh/tracetest-community), give [Tracetest a star on GitHub](https://github.com/kubeshop/tracetest), or schedule a [time to chat 1:1](https://calendar.app.google/8qHAomjQZDKKDARd8).
.jpg)
.avif)
.avif)