Building an Observability Stack with Docker
.jpg)

Want to validate your observability features locally? This tutorial guides you through setting up an observability stack with Docker. Learn how to send metrics and traces, visualize data, and more.
Table of Contents
Get started with Tracetest!
Try Managed Tracetest Today!
When developing an application with observability, one challenge is to set up a minimal local infrastructure to validate if everything is running correctly. Typically, developers code observability features locally but connect them to an external infrastructure, such as a test environment or a quality assurance environment.
This article will showcase how to set up an observability stack locally. You will learn how to:
- Configure
Grafana,Tempo,Prometheus, andOpenTelemetry Collectorwith Docker Compose. - Run the observability stack locally using Docker and Docker Compose.
- Instrument a simple API to send metrics and traces to the observability stack.
- Visualize metrics and traces emitted by APIs.
If you want to see the code example right away, check it out on GitHub, here.
You can also clone the example and run it right away.
```bash
git clone https://github.com/kubeshop/tracetest.git
cd tracetest/examples/observability-stack
```To start the example, run these commands.
```bash
# run the observability stack
docker compose up -d
# install dependencies and run API
npm install
npm run with-telemetry
# then open a new terminal window and install Tracetest CLI:
# https://docs.tracetest.io/getting-started/installationainstall-the-tracetest-cli
# configure Tracetest CLI
tracetest configure
# export API Key
export TRACETEST_API_KEY={API Key from app.tracetest.io}
# run Tracetest Agent
docker compose -f ./docker-compose.yaml -f docker-compose.tracetest.yaml up -d
```
Setting up an Observability Stack
First, you will set up a folder called observability-stack containing the docker-compose.yaml file, where all the containers will be defined, as well as additional configuration files for each tool. Create a docker-compose.yaml file in this folder and add the following content:
```yaml
version: "3.7"
services:
# ...
```After that, you will set up a metrics server container. It will use Prometheus.io, an open-source monitoring and alerting toolkit designed to collect, store, and query time series data, making it a tool for monitoring your systems' performance and health through metrics.
You will create a folder called config inside observability-stack and then create a prometheus.config.yaml file inside it with the following contents to configure Prometheus to scrape metrics every 15 seconds from the OpenTelemetry Collector. Prometheus will also send traces to the OpenTelemetry Collector.
```yaml
global:
scrape_interval: 15s
evaluation_interval: 15s
scrape_configs:
-job_name: otel-collector
static_configs:
-targets: ['otel-collector:8889']
-targets: ['otel-collector:8888']
tracing:
endpoint: otel-collector:4317
insecure: true
```
After that, you can define the Prometheus container in our docker-compose.yaml to start with this config file using the following definition:
```yaml
version: "3.7"
services:
prometheus:
image: prom/prometheus:v2.49.1
command:
- --config.file=/etc/prometheus.yaml
- --web.enable-remote-write-receiver
- --enable-feature=exemplar-storage
volumes:
- type: bind
source: ./config/prometheus.config.yaml
target: /etc/prometheus.yaml
```With the metrics server set up, you will now set up our tracing backend server. To do that, it will use Tempo, a distributed tracing system that allows you to capture and analyze traces to gain insights into the performance and behavior of your applications. You will set up a tempo.config.yaml inside the observability-stack/config folder, configuring Tempo to receive OTLP data and submit metrics about its internal state. The content of the file is:
```yaml
stream_over_http_enabled: true
server:
http_listen_port: 3200
log_level: info
query_frontend:
search:
duration_slo: 5s
throughput_bytes_slo: 1.073741824e+09
trace_by_id:
duration_slo: 5s
distributor:
receivers:
otlp:
protocols:
http:
endpoint: 0.0.0.0:4318
grpc:
endpoint: 0.0.0.0:4317
ingester:
max_block_duration: 5m # cut the headblock when this much time passes. this is being set for demo purposes and should probably be left alone normally
compactor:
compaction:
block_retention: 1h # overall Tempo trace retention. set for demo purposes
metrics_generator:
registry:
external_labels:
source: tempo
cluster: docker-compose
storage:
path: /tmp/tempo/generator/wal
remote_write:
- url: http://prometheus:9090/api/v1/write
send_exemplars: true
storage:
trace:
backend: local # backend configuration to use
wal:
path: /tmp/tempo/wal # where to store the the wal locally
local:
path: /tmp/tempo/blocks
overrides:
defaults:
metrics_generator:
processors: [service-graphs, span-metrics] # enables metrics generator
```As with Prometheus, you will define a Tempo container in docker-compose.yaml:
```yaml
version: "3.7"
services:
tempo:
image: grafana/tempo:2.3.1
command: ["-config.file=/etc/tempo.yaml"]
volumes:
- type: bind
source: ./config/tempo.config.yaml
target: /etc/tempo.yaml
prometheus:
# ...
```With both metrics and trace servers defined, you will define an OpenTelemetry Collector to orchestrate the reception of OpenTelemetry data by our application, allowing us to centralize how it is sent OTLP data following this architecture:
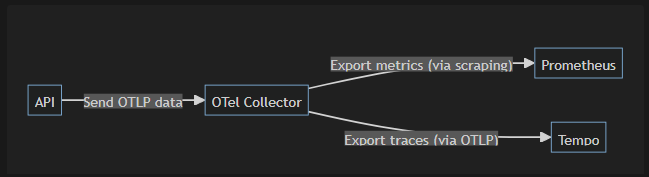
In the observability-stack/config folder, you will add a file called otel-collector.config.yaml with some configuration to receive telemetry data and to forward (export) it to Tempo and Prometheus.
To receive OTLP data, you set up the standard otlp receiver to receive data in HTTP or gRPC format. To forward traces and metrics, a batch processor was defined to accumulate data and send it every 100 milliseconds. Then set up a connection to Tempo (in otlp/tempo exporter, with a standard top exporter) and to Prometheus (in prometheus exporter, with a control exporter). A debug exporter also was added to log info on container standard I/O and see how the collector is working.
The final config file is structured as follows:
```yaml
receivers:
otlp:
protocols:
grpc:
http:
cors:
allowed_origins:
- "http://*"
- "https://*"
processors:
batch:
timeout: 100ms
exporters:
debug:
verbosity: detailed
otlp/tempo:
endpoint: tempo:4317
tls:
insecure: true
prometheus:
endpoint: 0.0.0.0:8889
extensions:
health_check: {}
service:
pipelines:
metrics:
receivers: [otlp]
processors: [batch]
exporters: [debug, prometheus]
traces:
receivers: [otlp]
processors: [batch]
exporters: [debug, otlp/tempo]
```Then, you will add an OpenTelemetry Collector container in docker-compose.yaml to start the service with the infrastructure needed to collect and store telemetry data:
```yaml
version: "3.7"
services:
otel-collector:
image: otel/opentelemetry-collector-contrib:0.92.0
command:
- "--config"
- "/otel-local-config.yaml"
volumes:
- ./config/otel-collector.config.yaml:/otel-local-config.yaml
ports:
- 4317:4317
tempo:
# ...
prometheus:
# ...
```With this stack complete, you can use it to collect telemetry. However, it is difficult to visualize it clearly since Tempo and Prometheus store traces and metrics and provide low-level API to view them.
So, you will add one last container to allow us to visualize this data: Grafana, an open-source analytics and visualization platform that allows us to see traces and metrics simply. You can set Grafana to read data from both Tempo and Prometheus by setting them as datastores with the following grafana.datasource.yaml config file:
```yaml
# config file version
apiVersion: 1
datasources:
- name: Prometheus
type: prometheus
uid: prometheus
access: proxy
orgId: 1
url: http://prometheus:9090
basicAuth: false
isDefault: false
version: 1
editable: false
jsonData:
httpMethod: GET
- name: Tempo
type: tempo
access: proxy
orgId: 1
url: http://tempo:3200
basicAuth: false
isDefault: true
version: 1
editable: false
apiVersion: 1
uid: tempo
jsonData:
httpMethod: GET
serviceMap:
datasourceUid: prometheus
```After that, you can define a Grafana container on our docker-compose.yaml:
```yaml
version: "3.7"
services:
grafana:
image: grafana/grafana:10.2.3
user: "472"
depends_on:
- prometheus
- tempo
- otel-collector
ports:
- 33000:33000
environment:
- GF_SERVER_HTTP_PORT=33000
- GF_AUTH_ANONYMOUS_ENABLED=true
- GF_AUTH_ANONYMOUS_ORG_ROLE=Admin
- GF_AUTH_DISABLE_LOGIN_FORM=true
volumes:
- type: bind
source: ./config/grafana.datasource.yaml
target: /etc/grafana/provisioning/datasources/datasources.yaml
otel-collector:
# ...
tempo:
# ...
prometheus:
# ...
```With all pieces configured, you can run an app and submit telemetry to check if everything works.
Running an App Emitting Telemetry Against Our Observability Stack
To test the telemetry, you will create a simple API in Node.js with a single endpoint that returns “Hello World” when called in a app.js file:
```javascript
const express = require("express")
const app = express()
app.get("/", (req, res) => {
setTimeout(() => {
res.send("Hello World")
}, 1000);
})
app.listen(8080, () => {
console.log(`Listening for requests on http://localhost:8080`)
})
```Then, you will create a file that manages all OpenTelemetry Instrumentation for this API, called app.instrumentation.js, that instruments the API calls with traces and metrics and sends it to our OpenTelemetry Collector exposed on localhost:4317:
```javascript
const opentelemetry = require('@opentelemetry/sdk-node')
const { getNodeAutoInstrumentations } = require('@opentelemetry/auto-instrumentations-node')
const { OTLPTraceExporter } = require('@opentelemetry/exporter-trace-otlp-grpc')
const { OTLPMetricExporter } = require('@opentelemetry/exporter-metrics-otlp-grpc')
const { PeriodicExportingMetricReader } = require('@opentelemetry/sdk-metrics')
const grpc = require('@grpc/grpc-js')
const exporterConfig = {
url: 'localhost:4317',
credentials: grpc.ChannelCredentials.createInsecure()
}
const sdk = new opentelemetry.NodeSDK({
metricReader: new PeriodicExportingMetricReader({
exporter: new OTLPMetricExporter(exporterConfig)
}),
traceExporter: new OTLPTraceExporter(exporterConfig),
instrumentations: [getNodeAutoInstrumentations()],
serviceName: 'test-api',
})
sdk.start()
```And finally, create a package.json file with API dependencies:
```javascript
{
"name": "test-api",
"version": "1.0.0",
"main": "app.js",
"scripts": {
"with-telemetry": "node --require ./app.instrumentation.js app.js"
},
"dependencies": {
"@opentelemetry/api": "^1.7.0",
"@opentelemetry/auto-instrumentations-node": "^0.41.0",
"@opentelemetry/exporter-metrics-otlp-grpc": "^0.48.0",
"@opentelemetry/exporter-trace-otlp-grpc": "^0.48.0",
"express": "^4.18.2"
}
}
```Start the observability stack with Docker Compose and the API by running the commands below. Note that the dependencies are being installed, and the API is listening on port 8080.
```bash
# run our Observability stack
docker compose up -d
# install dependencies and run API
npm installnpm run with-telemetry
# outputs
> test-api@1.0.0 with-telemetry
> node --require ./app.instrumentation.js app.js
Listening for requests on http://localhost:8080
```By running a command to trigger the API in another terminal, you will be able to see its response:
```bash
curl http://localhost:8080/
# outputs
Hello World
```And seeing the OpenTelemetry Collector logs in Docker with docker compose logs otel-collector, you should be able to see the API sending metrics and traces to it by seeing logs like:
```bash
# ...
# metrics logs
otel-collector-1 | InstrumentationScope @opentelemetry/instrumentation-http 0.48.0
otel-collector-1 | Metric #0
otel-collector-1 | Descriptor:
otel-collector-1 | -> Name: http.server.duration
otel-collector-1 | -> Description: Measures the duration of inbound HTTP requests.
otel-collector-1 | -> Unit: ms
otel-collector-1 | -> DataType: Histogram
otel-collector-1 | -> AggregationTemporality: Cumulative
# ...
# trace logs
otel-collector-1 | ScopeSpans #1
otel-collector-1 | ScopeSpans SchemaURL:
otel-collector-1 | InstrumentationScope @opentelemetry/instrumentation-express 0.35.0
otel-collector-1 | Span #0
otel-collector-1 | Trace ID : f31338cf98ec9bcb9a194a3fb092926c
otel-collector-1 | Parent ID : 1adc22218e485dc5
otel-collector-1 | ID : ca0be9c187c7b9fa
otel-collector-1 | Name : middleware - query
otel-collector-1 | Kind : Internal
otel-collector-1 | Start time : 2024-01-29 18:37:46.299 +0000 UTC
otel-collector-1 | End time : 2024-01-29 18:37:46.299479982 +0000 UTC
otel-collector-1 | Status code : Unset
otel-collector-1 | Status message :
otel-collector-1 | Attributes:
otel-collector-1 | -> http.route: Str(/)
otel-collector-1 | -> express.name: Str(query)
otel-collector-1 | -> express.type: Str(middleware)
```Now, one last step is to open Grafana in your browser at http://localhost:33000 and start visualizing metrics and traces. You can do it by going to the menu on the initial page and choosing the Explore option:

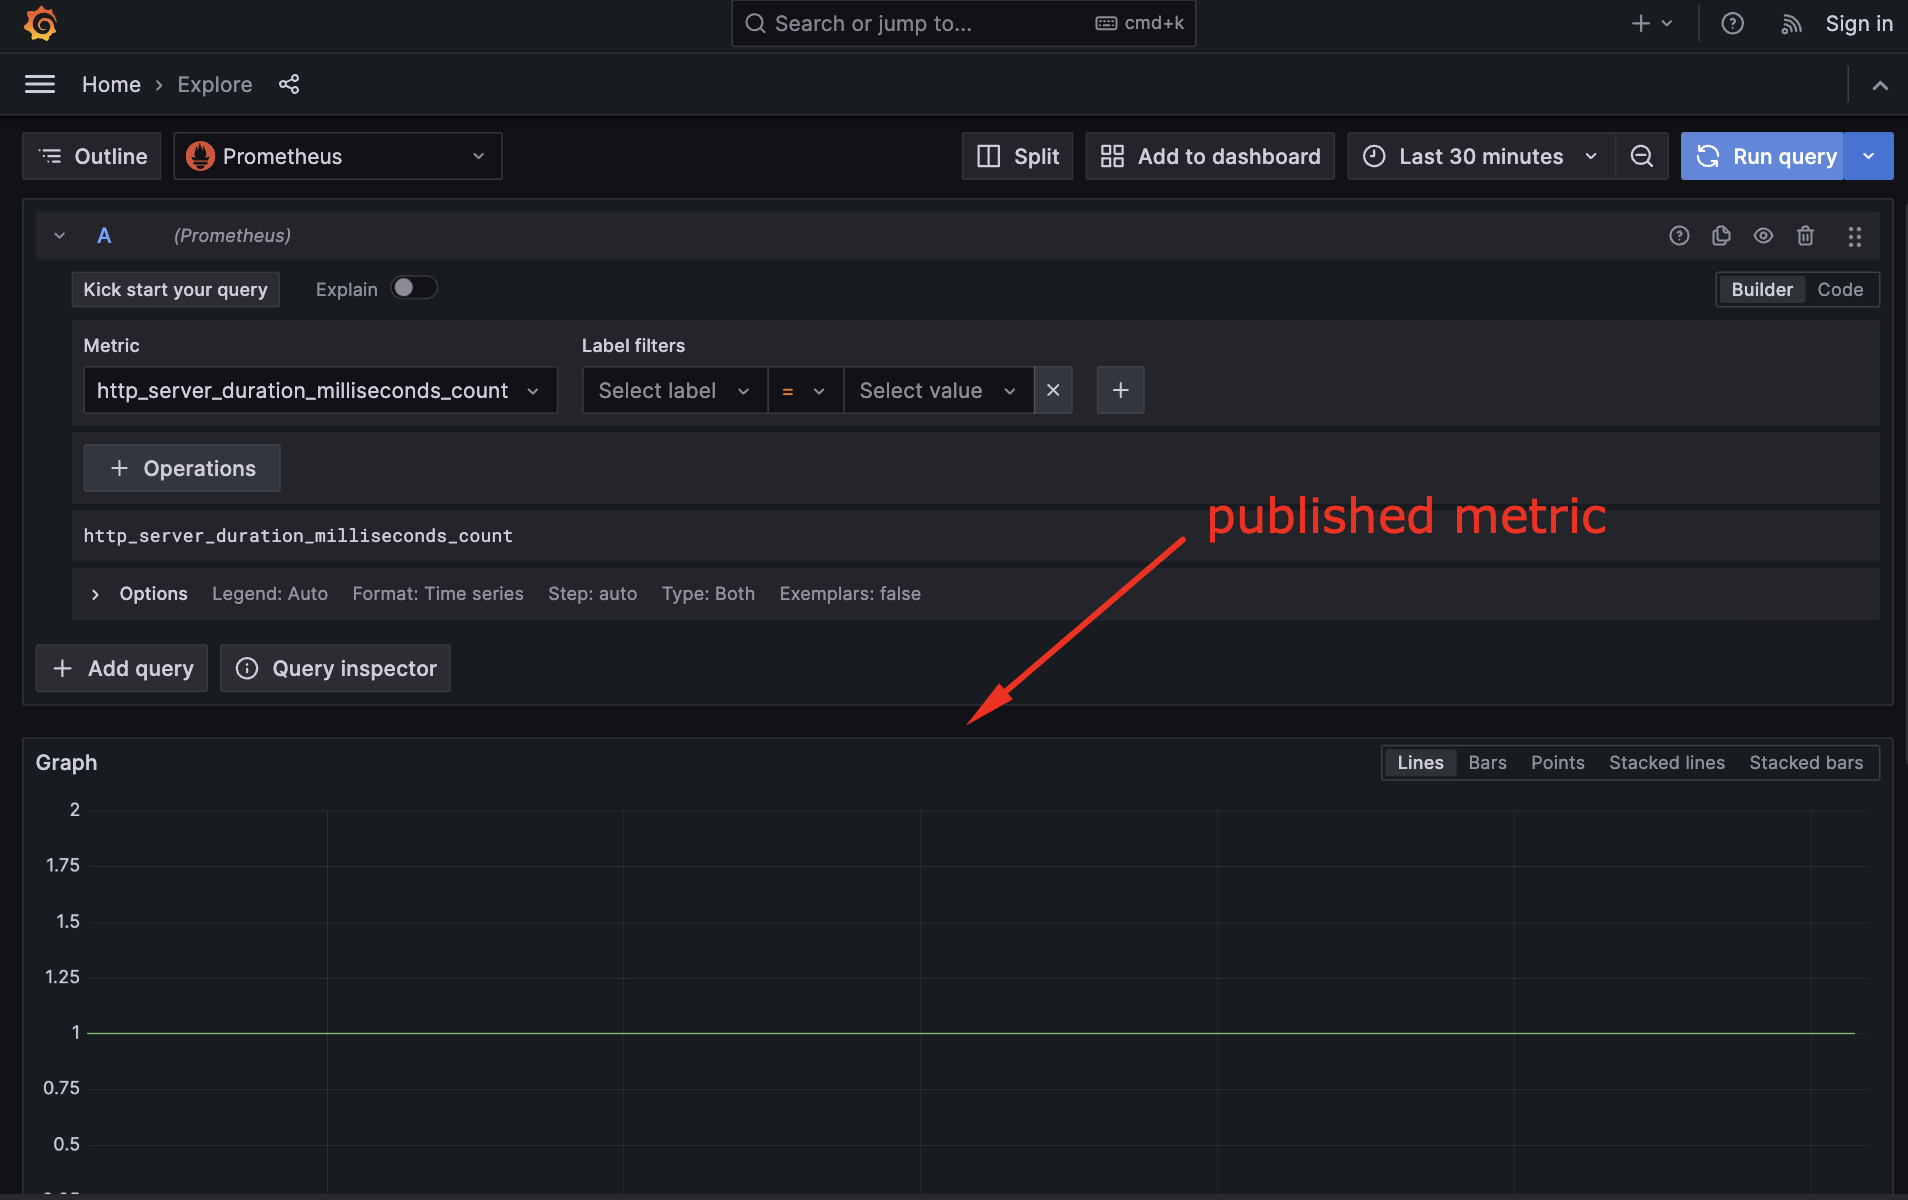
The Explore screen will open with the Prometheus datastore enabled. If you expand the query looking for the metrics, you can see all metrics published by the stack:

One of them is http_server_duration, emitted by the automatic instrumentation, that counts the number of requests made against our server and measures its duration:
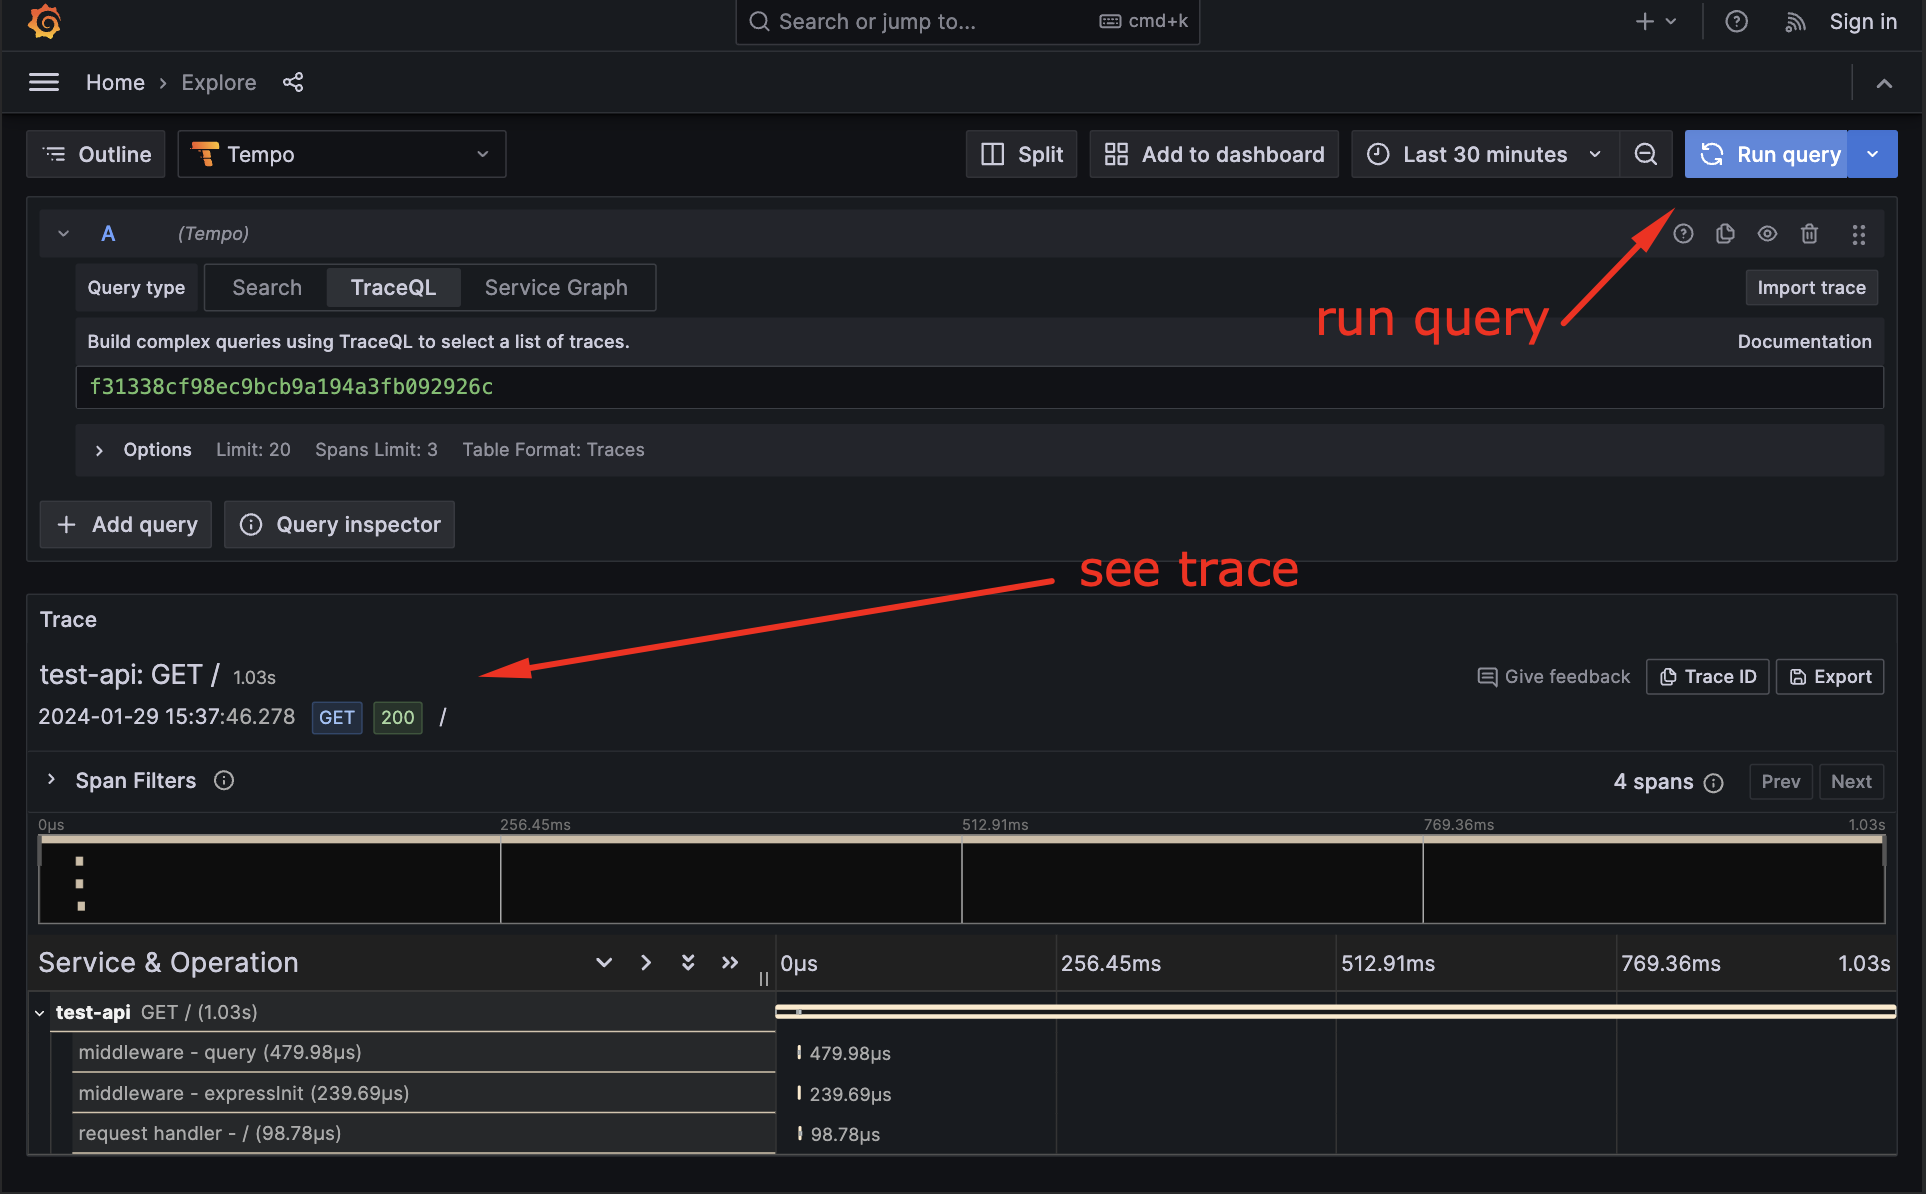
Changing the datastore to Tempo, you can see the traces emitted by the API.

If you add a Trace ID (like the Trace ID f31338cf98ec9bcb9a194a3fb092926c , captured in the logs) and click on Run query, you should be able to see the traces:
Done! You have a local API publishing telemetry to a local stack. Now, you can experiment with the API, add more traces and metrics, and evaluate everything locally.
Bonus: Trace-testing Your App to Automate Telemetry Tests
Now that you have a working API, instead of checking the telemetry manually, you can create trace-based tests, trigger HTTP calls to the API, and validate if the API is working as intended and emitting traces.
To do that, you will use Tracetest, which triggers service calls (in our case, HTTP calls) and validate the emitted traces to ensure that our applications are working as intended and that the telemetry is properly captured and sent to the observability stack.
First, you will add one more container in a separate docker-compose.tracetest.yaml file, which will define a Tracetest Agent container. This container is a lightweight, dependency-free agent that runs locally in your environment and is able to connect to the local tracing backend (in your case, Tempo), and executes API calls locally.
```yaml
version: "3.7"
services:
tracetest:
image: kubeshop/tracetest-agent:latest
platform: linux/amd64
command:
- --mode
- verbose
depends_on:
otel-collector:
condition: service_started
environment:
TRACETEST_API_KEY: ${TRACETEST_API_KEY}
```Then, you will run the observability stack and the API as you did before:
```bash
# run our Observability stack
docker compose up -d
# install dependencies and run API
npm install
npm run with-telemetry
```Now, in a new terminal window, you will install the Tracetest CLI using the following instructions for your operating system and execute the command:
```bash
tracetest configure
```
This command will guide you to access Tracetest and set up your account. Then, create a new environment by expanding the environment tab and clicking on Create a New Environment :
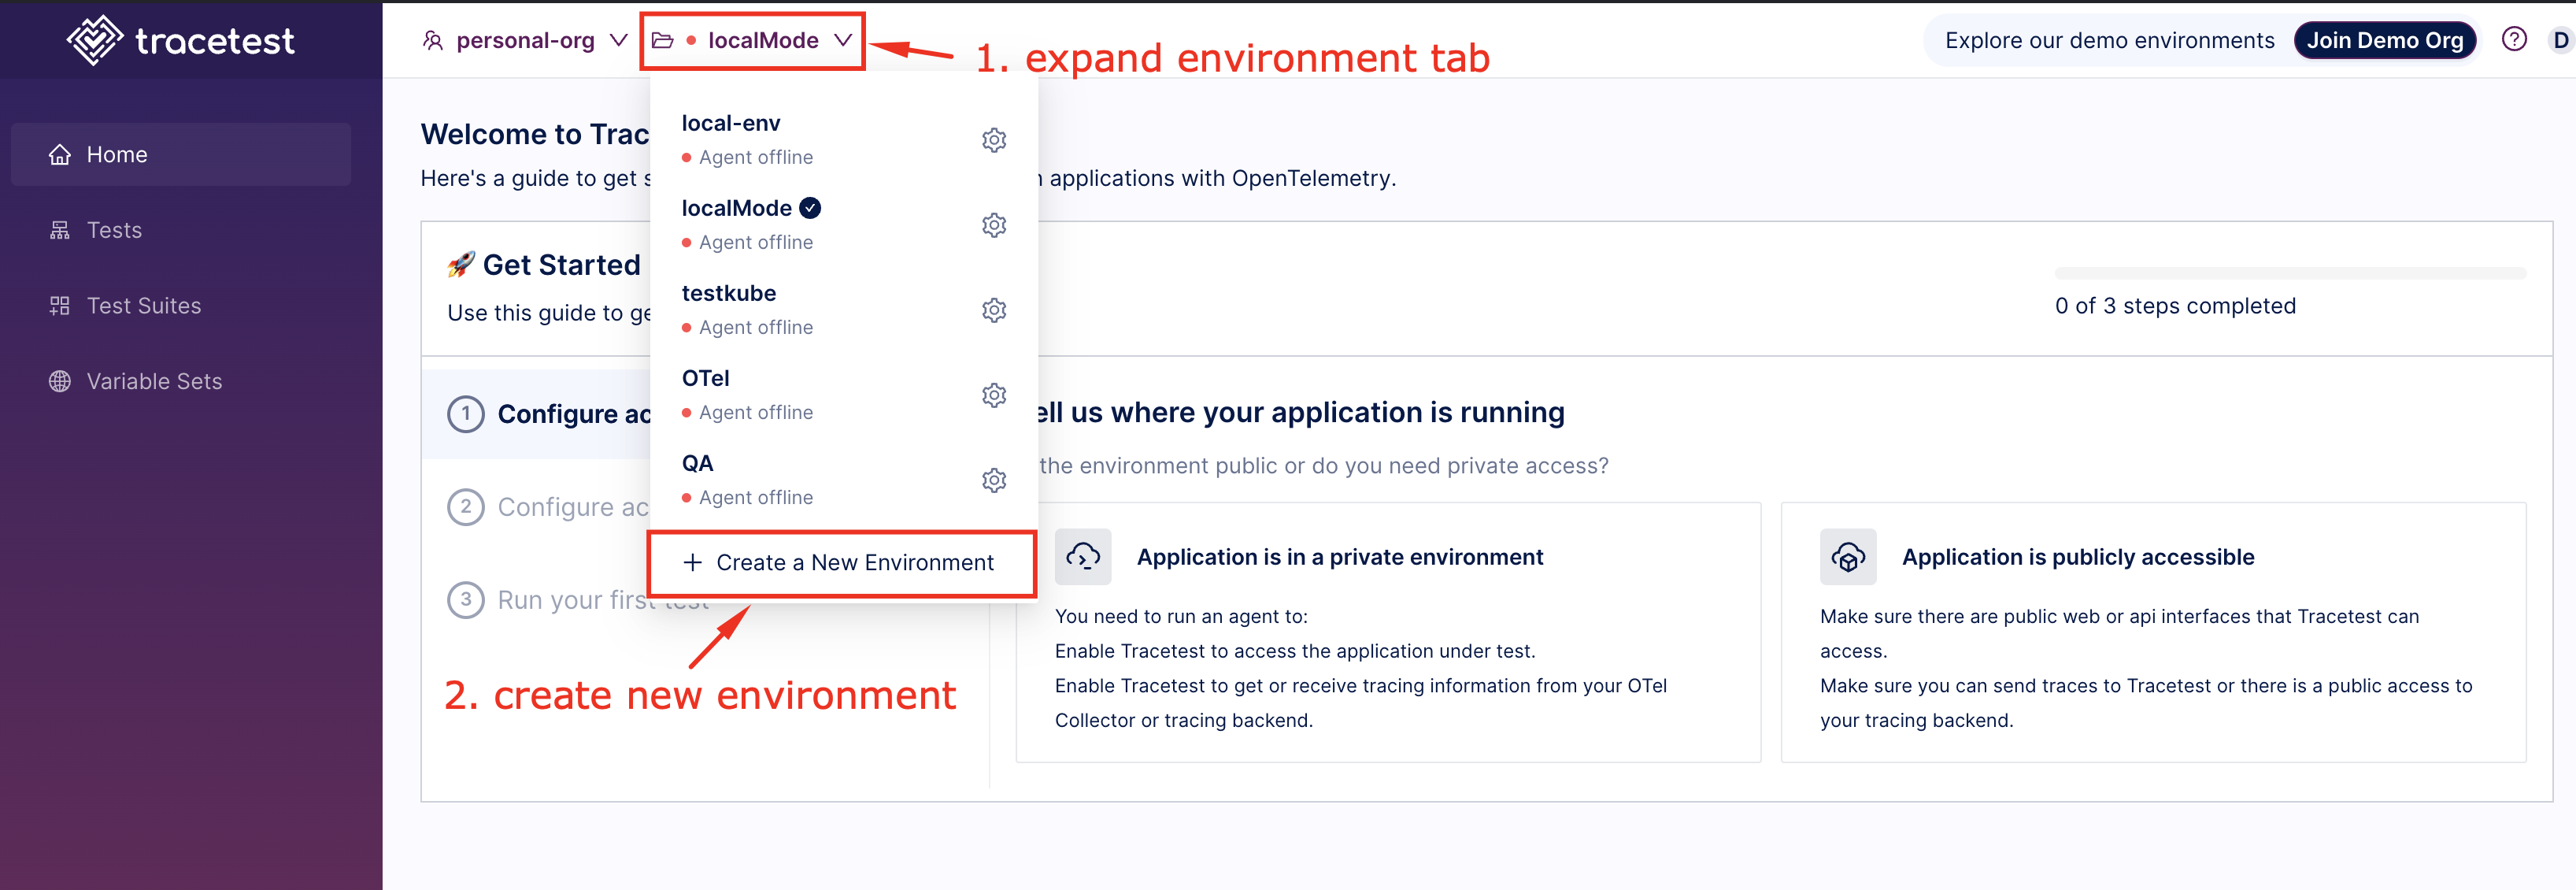
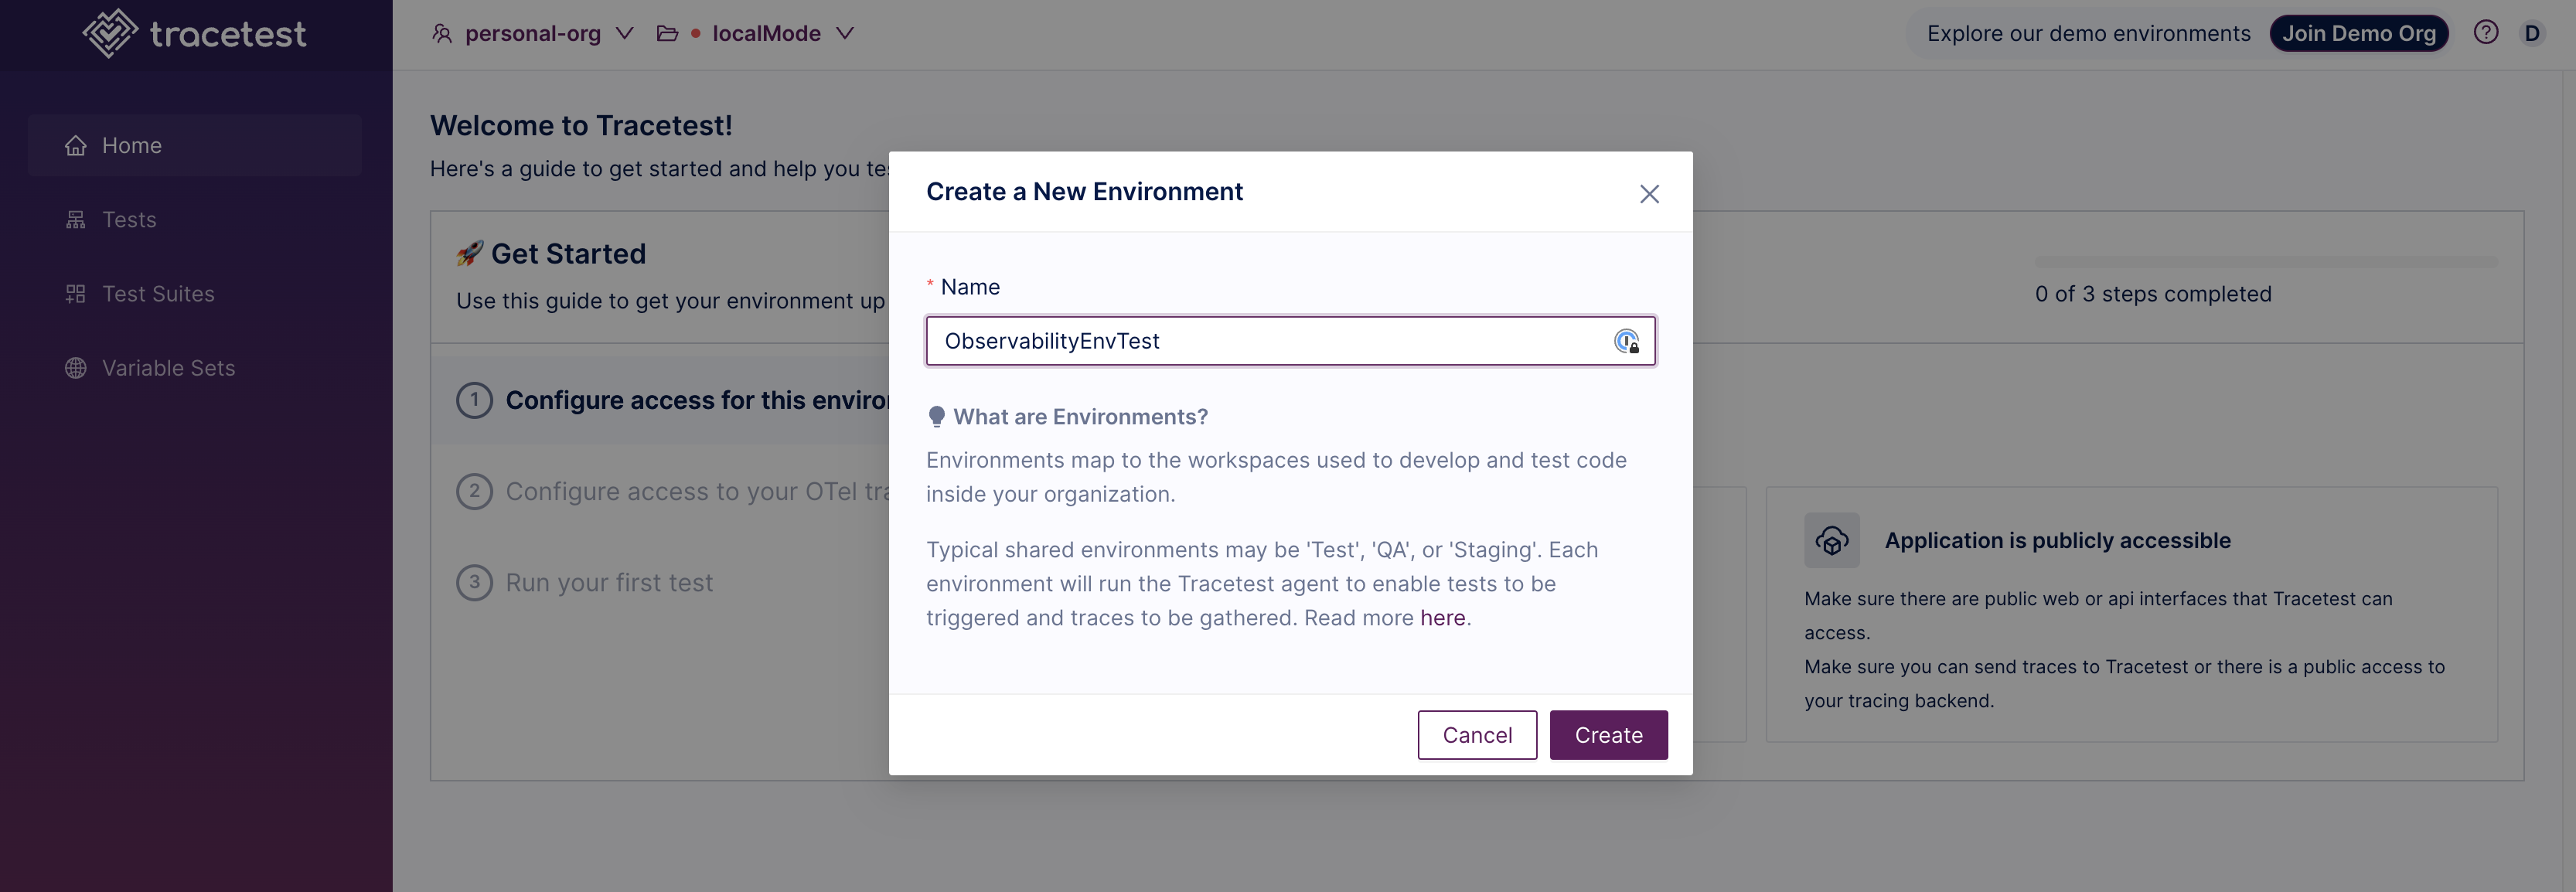
On the popup window, enter the name of the environment and click on Create:
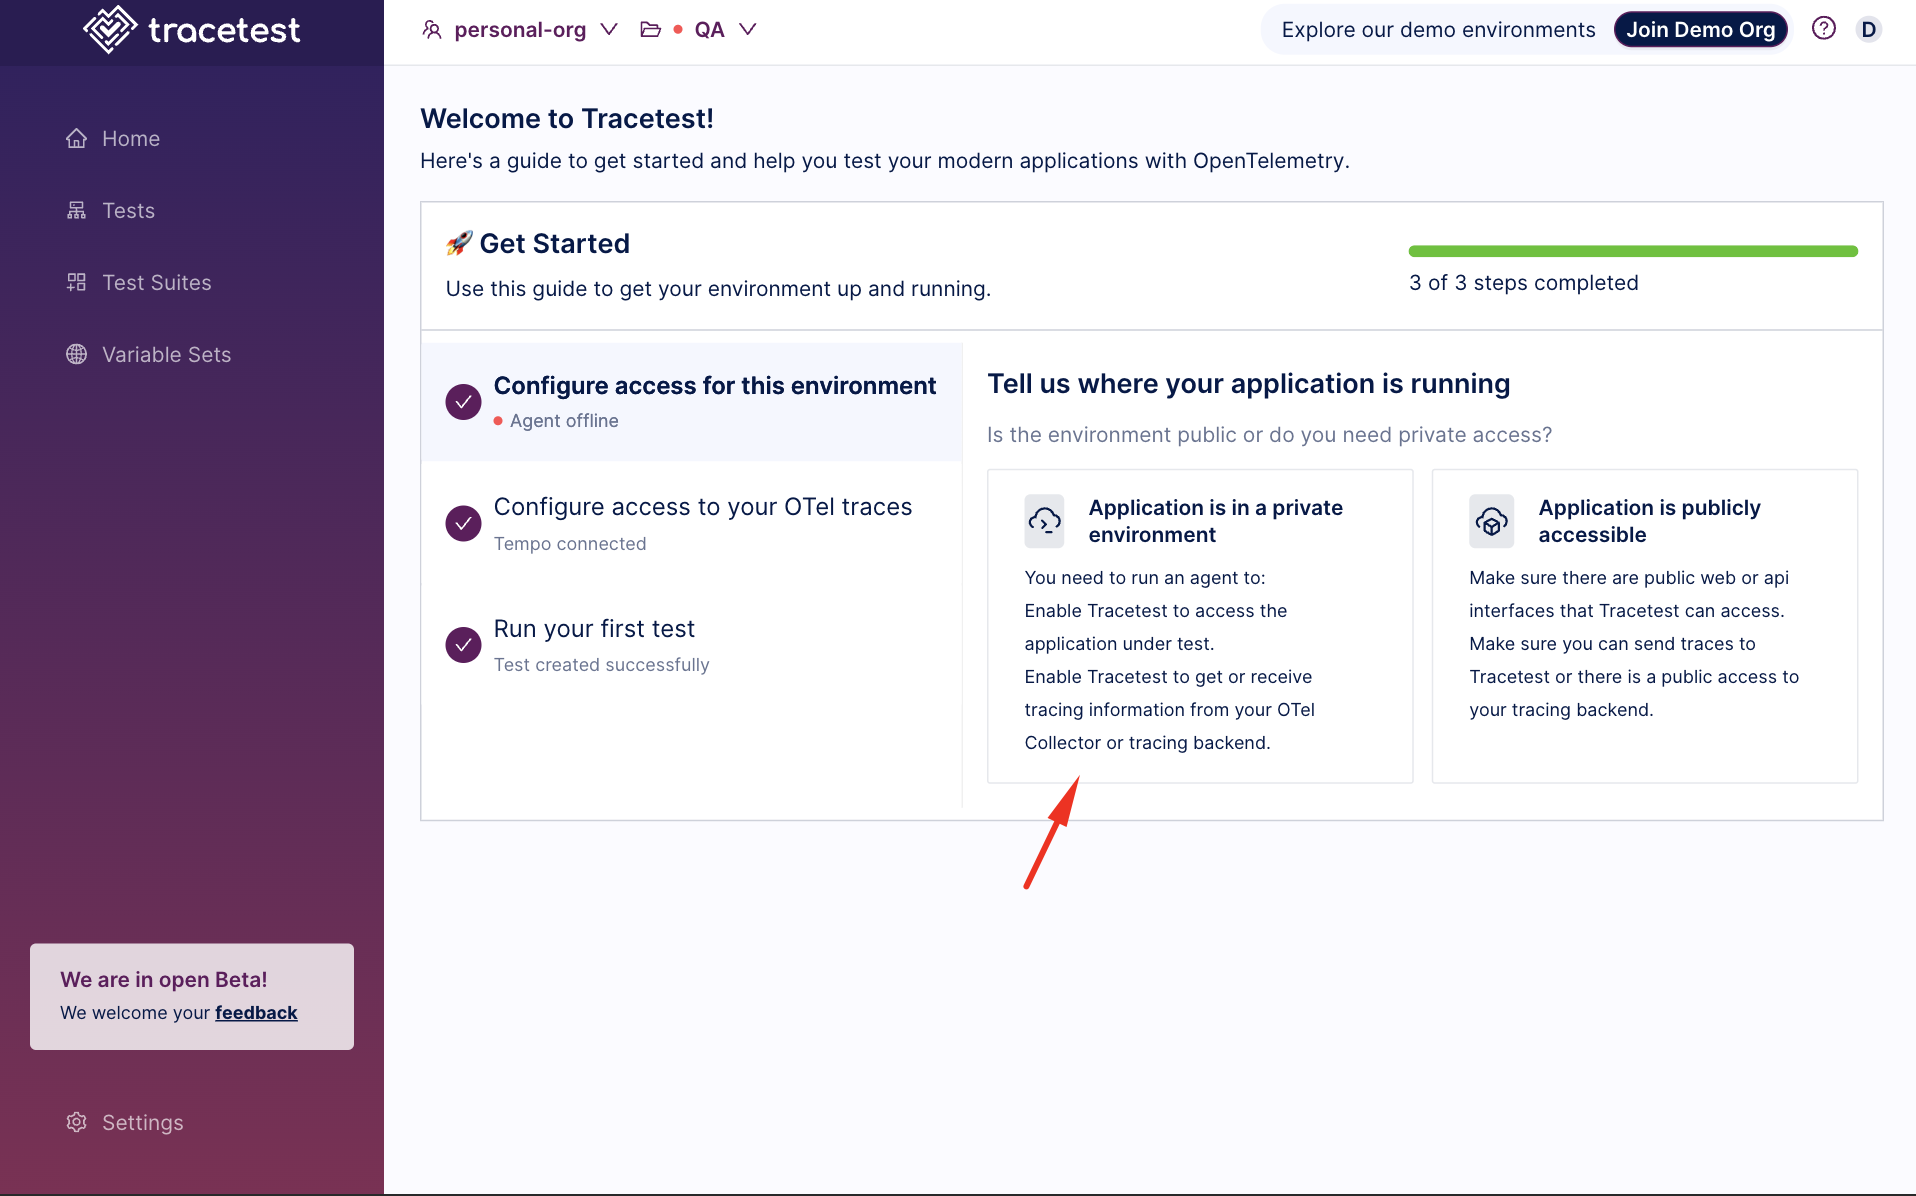
On the Get Started screen, choose the option “Application is in a private environment”, since you will connect the Tracetest Agent with our local observability stack in Docker.
Now copy the API Key on the screen to set up our Tracetest Agent in Docker:
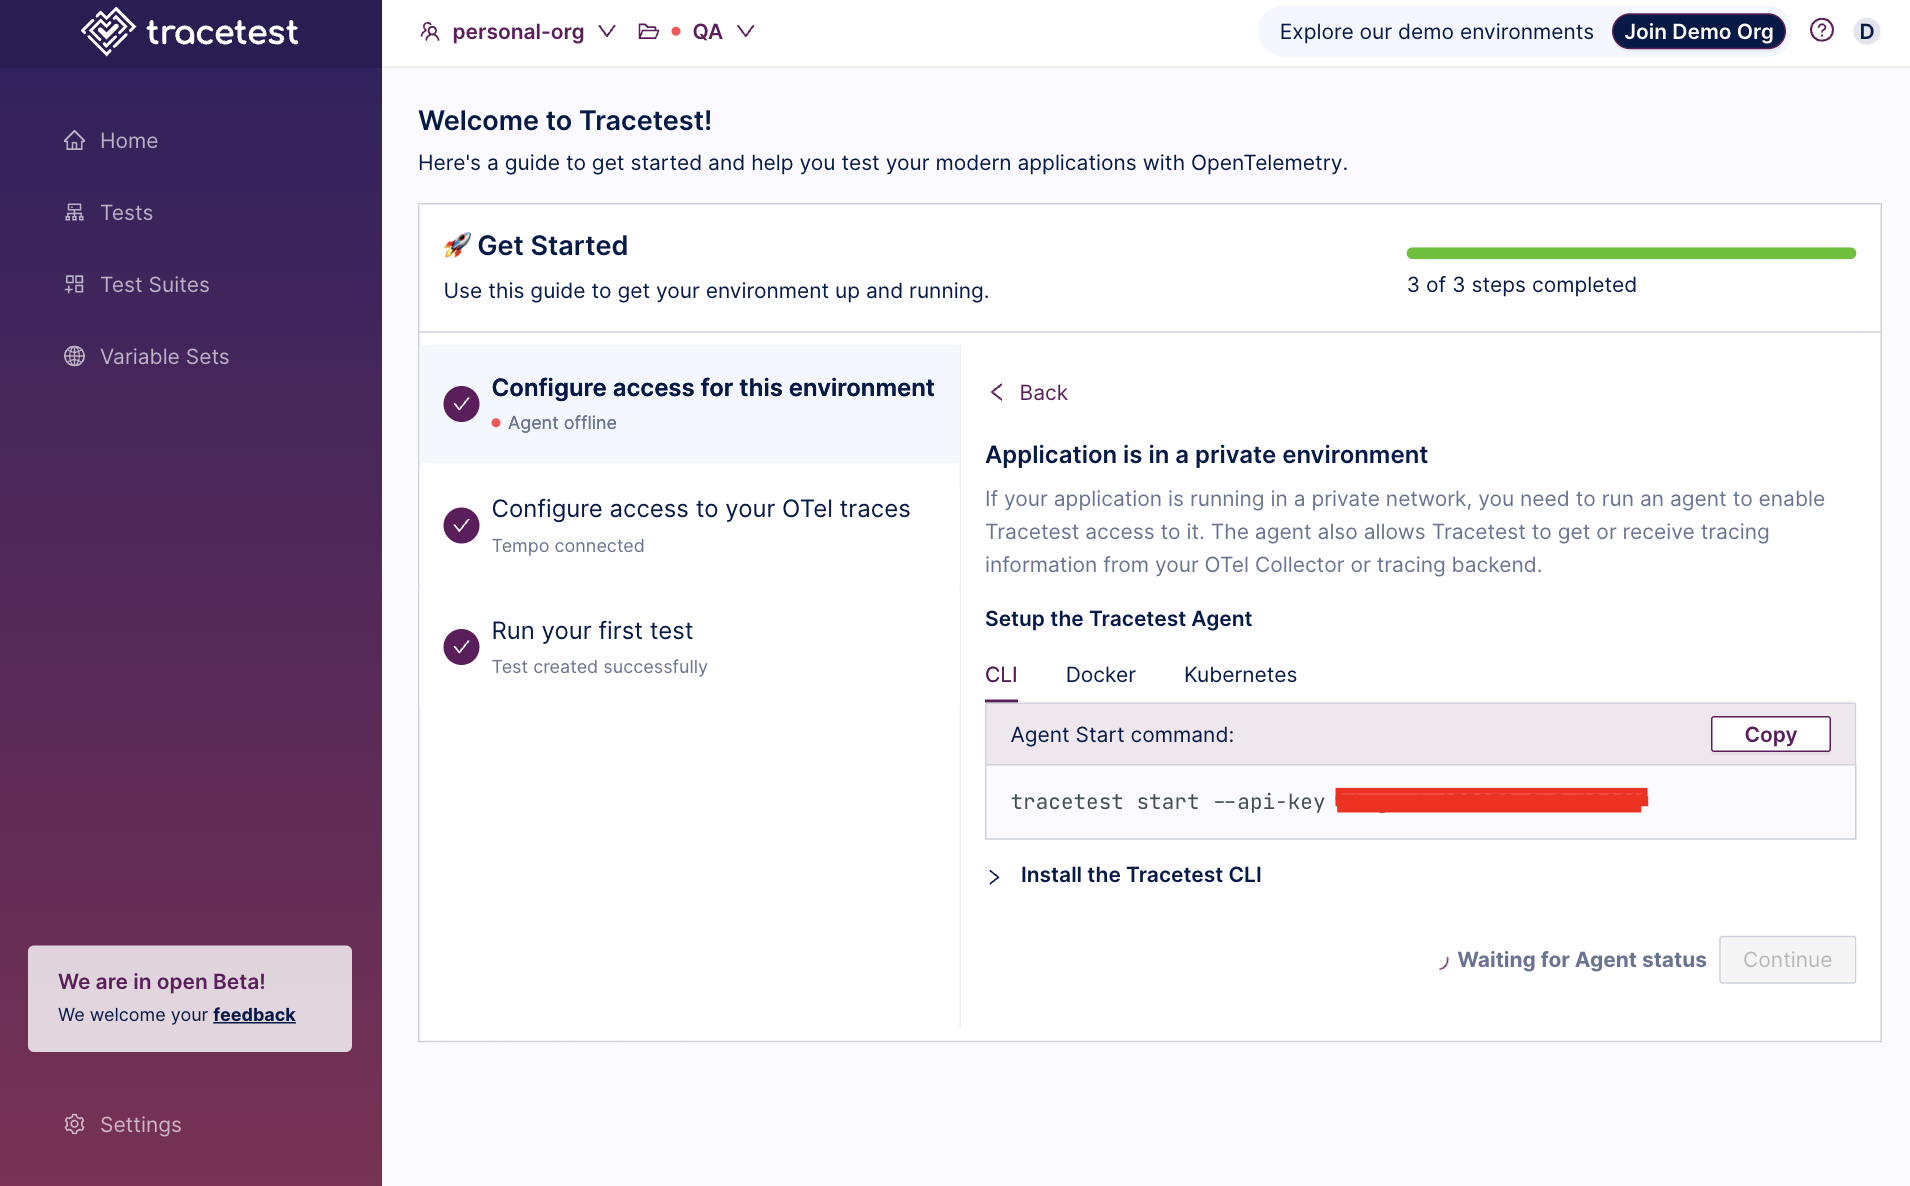
You will start the agent with Docker Compose using the command below.
```bash
export TRACETEST_API_KEY={API Key copied in last step}
docker compose -f ./docker-compose.yaml -f docker-compose.tracetest.yaml up -d
```

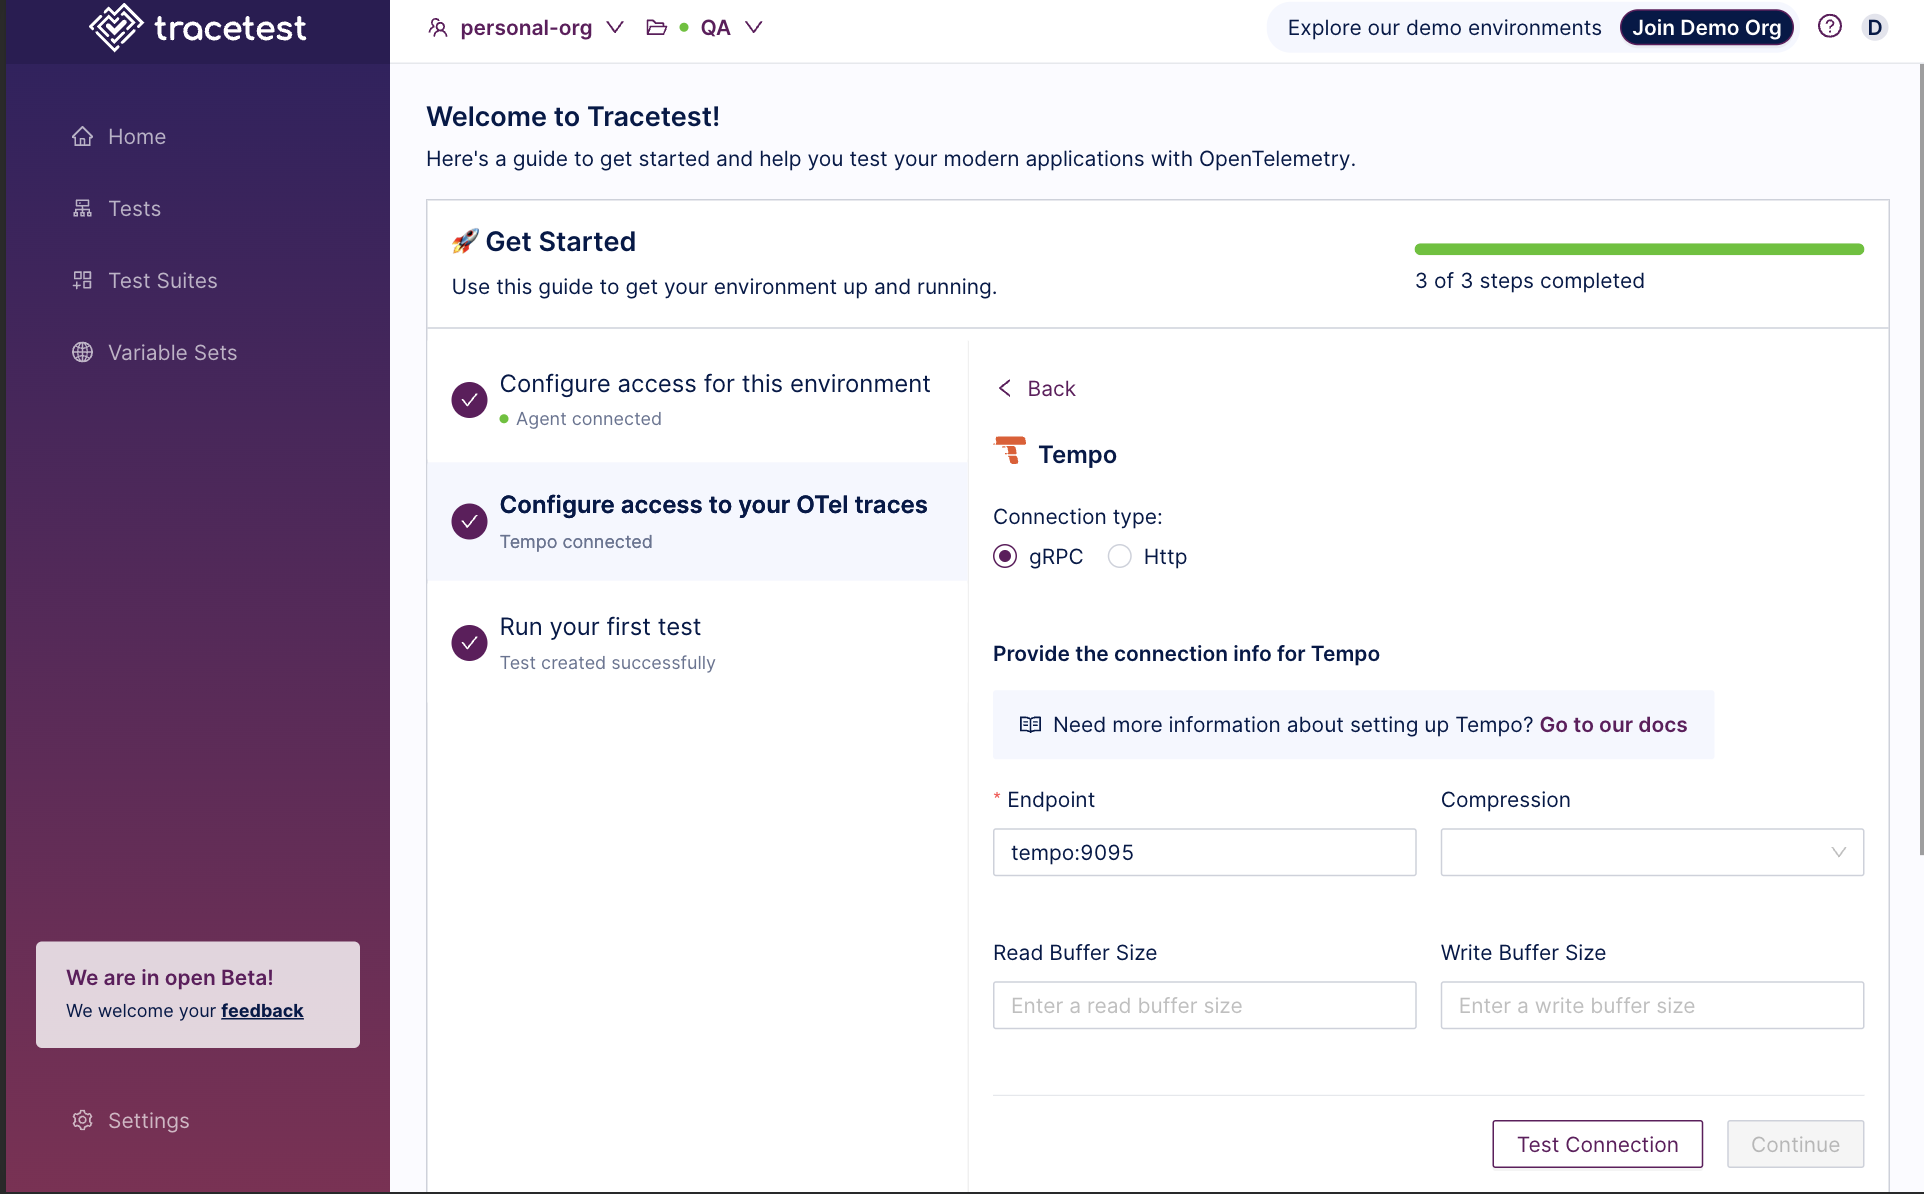
Choose Tempo as the application that will receive traces, and then enter the endpoint used to access it inside our stack, tempo:9095, and click Test Connection.
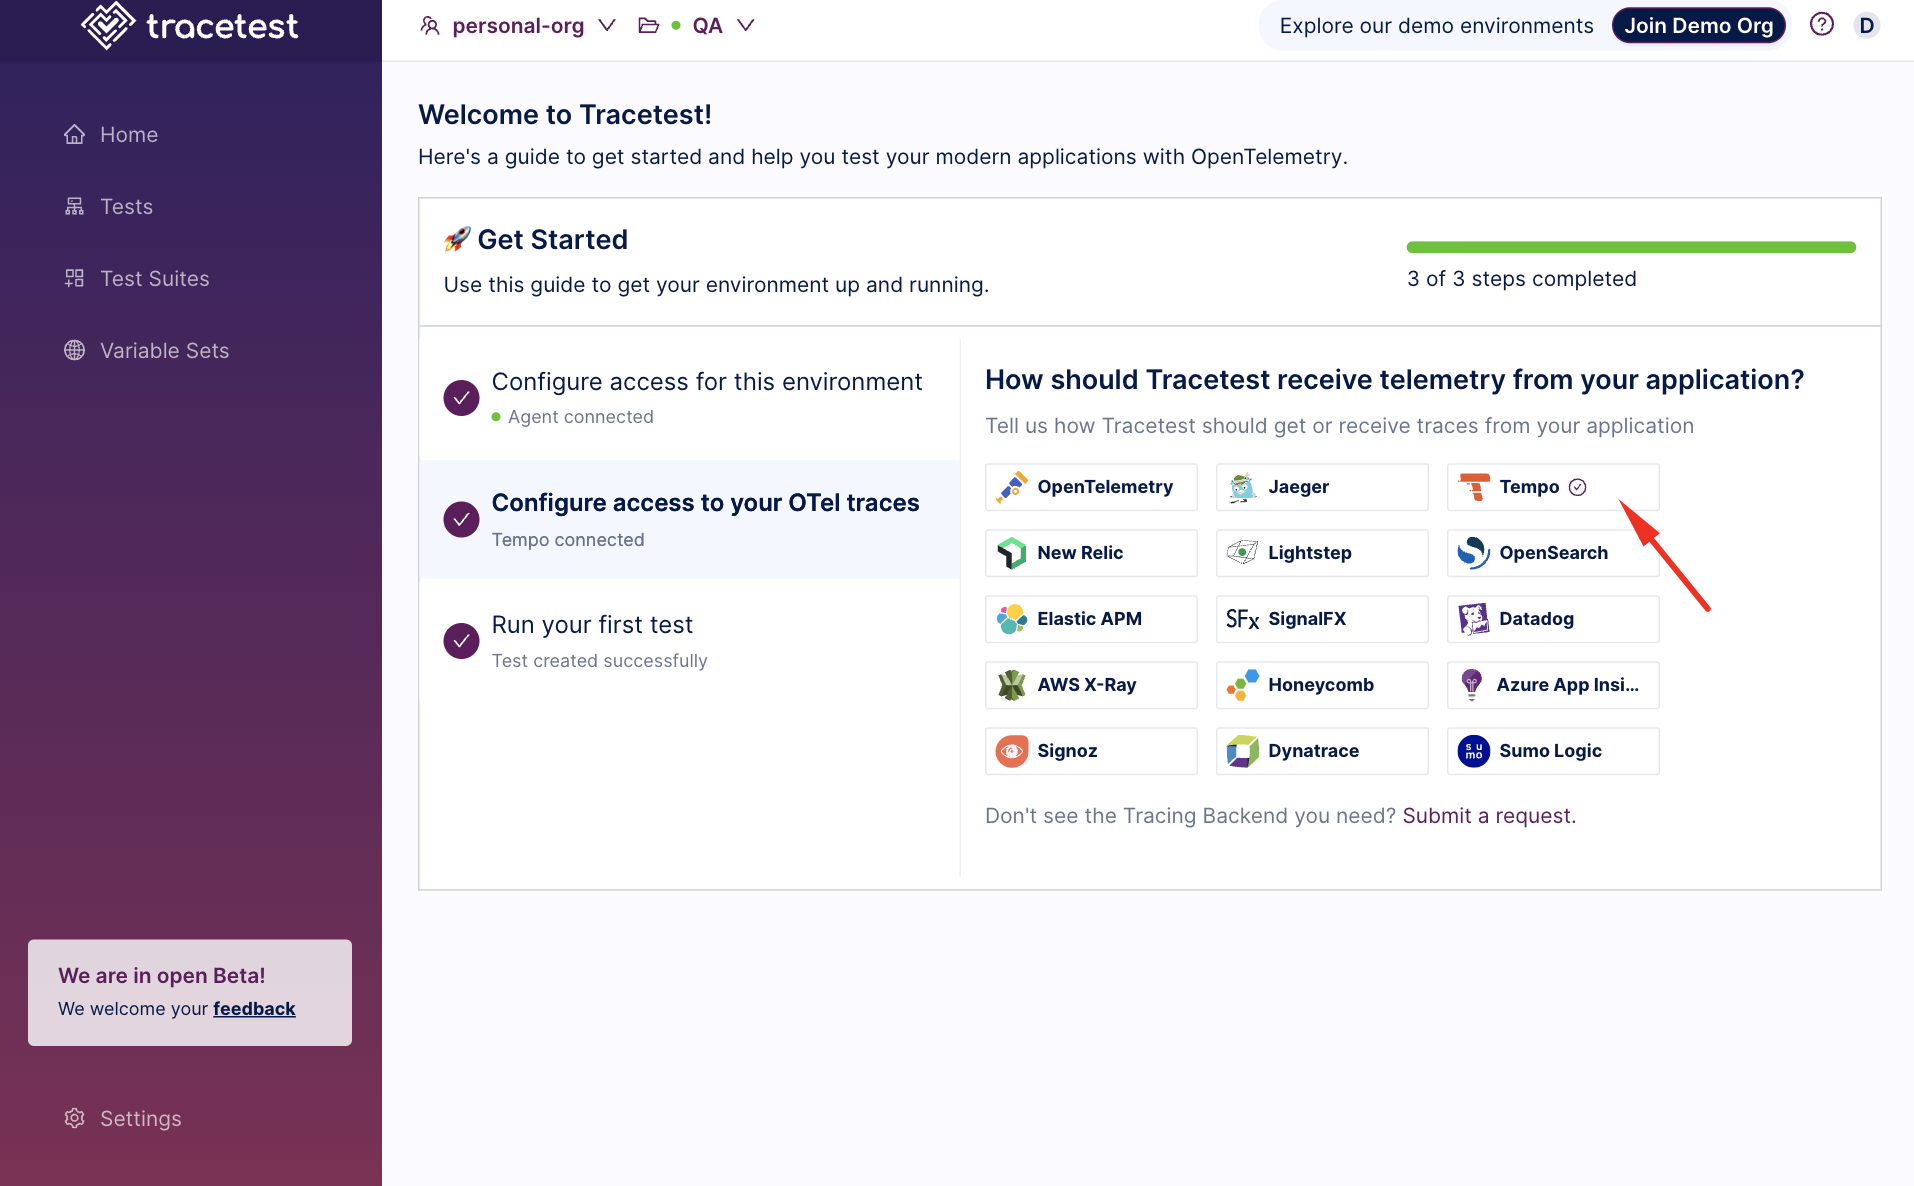
The connection will be validated. Click on Continue and then Save.
Now, you can proceed in the terminal and create a test file that calls the API, called test-api.yaml, which will trigger our API from the Tracetest Agent container and will validate if the API call emitted a trace with an HTTP span named GET / :
```yaml
type: Test
spec:
id: _0N272tIg
name: Test API call
trigger:
type: http
httpRequest:
method: GET
url: http://host.docker.internal:8080/
headers:
- key: Content-Type
value: application/json
specs:
- selector: span[tracetest.span.type="http" name="GET /" http.target="/" http.method="GET"]
name: HTTP call was made correctly
assertions:
- attr:http.status_code = 200
```Finally, you can run this test with Tracetest CLI and validate the API in the terminal:
```bash
tracetest run test -f ./test-api.yaml
# it return an output like this:
✔ Test API call (https://app.tracetest.io/organizations/your-organization/environments/your-environment/test/_0N272tIg/run/2/test) - trace id: 399568f5f202656ab926f1b1452d5dbd
✔ HTTP call was made correctly
```With this, you can validate the API with each change to guarantee that the telemetry is valid and returning everything as expected.
Final Remarks
Setting up an observability stack in Docker for local development can greatly enhance the ability to monitor and analyze the performance and behavior of applications. Also, with a local stack, a developer can iterate quickly when developing an API with easier code changes and adding more telemetry data.
Additionally, utilizing trace-based tests with Tracetest can automate the validation of telemetry and ensure that the application is functioning as intended. Overall, having an observability stack during local development can improve the development and testing process, leading to more reliable and efficient applications.
Would you like to learn more about Tracetest and what it brings to the table? Visit the Tracetest docs and try it out by signing up today!
Also, please feel free to join our Slack Community, give Tracetest a star on GitHub, or schedule a time to chat 1:1.
Related Content
.jpg)
.jpg)
.jpg)
Stay in the Loop

Join the Tracetest Community in one of these channels:


— a first of its kind open source accelerator focused on the cloud native ecosystem


